Genotype × environment interaction and selection parameters for high yielding wheat genotypes under irrigated and heat stress environment
Abstract
Introduction
Wheat is a significant contributor to the food and nutritional security of the world. Due to climatic constraints and heat stress condition, the potentiality of wheat to eradicate existing hunger and malnutrition has been severely limited all around the world.
Materials and Methods
To evaluate the performance and stability of elite wheat genotype under irrigated and heat stress environment, a field experiment was conducted during the wheat growing season of 2020, 2021 and 2022 under irrigated and heat stress environment that altogether created six distinct wheat growing environments.
Results
The combined ANOVA revealed that all quantitative traits studied were significantly influenced by heat stress environments (p < 0.01). Which Won Where (WWW) model revealed, Bhairahawa lines (BL) 4407, Nepal lines (NL) 1384 and NL 1346 performed best under irrigated environments of 2020, 2021 and 2022 while BL 4407, NL 1384 and NL 1381 performed best under heat stress environment of 2020, 2021 and 2022. WWW model showed, NL 1369, NL 1386 and NL 1376 as the most stable genotypes across irrigated and heat stress environment. The phenotypic correlation, path analysis, network diagram, cluster analysis and cluster based principal component analysis analysis revealed traits, days to booting (DTB), plant height (Ph), spike length (SL), ten spike weight (TSW) and thousand kernel weight (TKW) are most closely associated with grain yield of wheat.
Conclusion
High yielding genotypes should be selected based on earliness in DTB, longer Ph, SL and higher TSW and TKW under both environments. Breeding for taller genotypes should specifically be focused to obtain high yielding genotypes under heat stress environments.
1 INTRODUCTION
Wheat is an important human food crop that ranks among the top three cereals in the world because of its adaptability, nutritional values and high yield potential (Shewry & Hey, 2015). The majority of wheat is cultivated in Asian regions followed by European, Americas and Africa. Hence, Asia is the highest producer of wheat in the world. Majorities of the countries cultivate and prioritise wheat as a major crop that includes India, Russia, China, United States of America, Kazakisthan, Australia, Canada, Pakistan (FAOSTAT, 2023). It is a major part of the economy and the third most important crop in Nepal (AITC, 2021). The grain has protein and calorie value and is mainly used for bread and biscuits purposes these days (Roger et al., 2022). It is also used in feed mills, cake, pasta, spaghetti and macaroni. Furthermore, it is an industrial crop as the grain along with stalk and chaff serves as raw materials. Stalk and chaff are used as mulch, construction material and animal bedding, thus, it is an important food and trade crop in Nepal.
The production and productivity of wheat is 734 million tons and 3.43 t ha−1 in world, 328 million tons and 3.38 t ha−1 in Asia, 145 million tons and 3.05 t ha−1 in Southern Asia, respectively. Nepal has 1.9 million tons of production with the productivity of 2.99 t ha−1 in 2022 (FAOSTAT, 2023; MOALD, 2020). In the past 10 years from 2009/10 to 2018/19, the production of wheat increased by 449,126 t from 1,556,539 t in 2009/10 to 2,005,665 t in 2018/19 (MOALD, 2020). In addition, the productivity of wheat in Nepal has only increased by 0.72 t ha−1 in past 10 years from 2.13 to 2.85 t ha−1 with an average increase per year of 0.102 t ha−1 (AITC, 2021). The area under wheat production was 731,131 and 703,992 ha in 2009/10 and 2018/19, respectively. The net wheat grown area has decreased by 27,139 ha in the past 10 years (MOALD, 2020). Hence, it is extremely difficult to increase the net wheat production of the country via increasing land area for cultivation. This brings a major challenge in uplifting the overall production and the productivity of wheat. Hence, the main focus should be diverted toward the principles and practices that improves the yield potential of wheat genotypes. One major challenge behind uplifting the net productivity of wheat is the lack of adequate technology for breeding in the country, and abiotic stress such as heat stress and drought. The comparative lower productivity of wheat in Nepal is mainly reported to cause by terminal heat stress along with other biotic, abiotic and socioeconomic factors (Bhandari et al., 2023; Bhatt et al., 2014; Pandey et al., 2015). This lower productivity consequently drive Nepal to import wheat which was 103,705 t in 2015, 217,105 t in 2016, 199,626 t in 2017 and 107,467 t in 2018 (MOF, 2022). Hence, to make sure enough food is provided to everyone in the country, it is obvious to increase the productivity of wheat.
Heat stress reduces wheat production mainly in arid and semi-arid environments (Djanaguiraman et al., 2013; Sharma et al., 2023; Tack et al., 2017). In the past 50 years, increment in grain yield of wheat was mainly derived from agronomic improvement and seed quality, rather than genetic and crop improvement. Furthermore, the research and development sector of Nepal is poor for advance genetic based breeding. Temperature observations in Nepal showed there is a significant and consistent increase in temperature projected for Nepal in the future and temperature increment are somewhat projected to larger for winter months compared to summer months. The mean ambient temperature is predicted to increase by 1–6°C by the end of the 21st century. The grain yield of wheat reduces by 6%–10% by just a 1° rise in temperature (Asseng et al., 2015). Whereas, in Nepal, a 1–3°C rise in maximum temperature (during heat stress) causes an 8%–31% decrease in wheat yield (Poudel et al., 2021; Timalsina et al., 2023). High temperature stress impacts in yield parameters like grain number, grain weight, grain filling duration and grain yield (Chaudhary et al., 2023; Djanaguiraman et al., 2020). This decrease in yield is mainly because of reduction in the grain mass by the rise in temperature, which leads to an accelerated grain growth rate and shortened grain-filling period (Khan et al., 2020). The optimum range of temperature for wheat during sowing is 10–15°C. The optimum temperature for growth is 16–22°C for anthesis and grain filling is 12–22°C, and during it is ripening from 21°C to 25°C (Bhandari et al., 2024). Climate change and a rise in the temperature would be going to have a great impact on global wheat production (Bishwas & Poudel, 2021). Reduced production and poor improvement on productivity over time would definitely produce concerns on food and nutritional security of the world (Bhandari et al., 2021). FAO estimated about 198 million tons of additional wheat requirement by 2050 to accomplish the future demands, to meet the demand as per requirement; wheat production needs to be increased by 77% in developing countries. Hence, it is very crucial to improve the production and the productivity of wheat to create a sustainable food system in world.
This research tends to work with the stress in wheat cultivation, especially under heat stress environments. A significant part of wheat in South Asia including Nepal is under heat stress. With the rise in temperature, the amount of yield loss is increasing, in 2005, there was a decline of 32 kg ha−1 while in 2020 the decline increased to 1534 kg ha−1 (46%) (Poudel et al., 2020). To minimise these losses several improved varieties with high grain yield, stress tolerance and disease resistance have been developed but still, the problem exists in improving the productivity and profitability of wheat farming. Thus, new germplasm and technology are needed to gain heat tolerance through wheat breeding. Till now, Nepal had only 42 wheat lines as a variety with a mean genetic yield potential of 4.47 t ha−1 which is reduced by 33% to 2.99 t ha−1 in farmers' field conditions (SQCC, 2021). Of them, only Bhrikuti, Gautam and Badganda are accepted by farmers as heat-tolerant genotypes. Agriculture development strategy (ADS) and the fifteenth 5-year plan reported 21% of the Nepalese population has no direct access to sufficient nutritious food. Nepal has 16.67% of the population in poverty (MOF, 2022), 6.1% in malnutrition and 17% of the population under severe micronutrient deficiency and ranks 81st position on the global hunger index (FAOSTAT, 2023). About 13.6% of the Nepalese population are food unsecured, 5.5% are undernourished, 12% are wasted, 31.5% are stunted and 2.8% of the children below 5 years of age are dying each year due to lack of nutritious food. ADS and sustainable development goals (SDGs) had aimed at achieving food security, ending hunger, and improving human nutrition (Bhandari et al., 2023). Identification of climate resilient wheat genotypes would help to achieve the SDG by United Nations to end hunger, malnutrition and all forms of micronutrient deficiencies (Bhandari et al., 2024).
The wheat improvement programme in Nepal follow conventional approach of selection in high production environments and thus modern varieties are not specifically tested for stressed environment. To minimise the production losses due to abiotic stress, future whet varieties must have enhanced adaptability to stress, because due to the change in global climate abiotic stress episodes are expected to become more frequent and severe (Xu et al., 2022). With the hypothesis of all the genetic materials and the environments evaluated were same, the experiment tends to contribute the wheat improvement programme of Nepal via climate resilient breeding. The knowledge of genetic variability of heat stress adaptive trait including their interaction with environment is a prerequisite for wheat improvement for abiotic stressed production area. The present study is therefore aimed at accessing the genetic variability of heat stress adaptive traits along with important agronomic traits, among the wheat lines.
2 MATERIALS AND METHODS
The field experiment was conducted for three continuous wheat growing season of 2020, 2021 and 2022 at the field conditions of Institute of Agriculture and Animal Science (IAAS), Tribhuvan University, Paklihawa Campus, located in the western region of Nepal. The experimental site lies in the tropical Terai region of Nepal with latitude and longitude of 27°29′02″ N and 83°27′17″ E at 104 m above sea level. The on field evaluation of wheat genotypes were carried out using 20 advanced wheat lines provided by National Wheat Research Programme (NWRP), Bhairahawa that included 15 Nepal lines (NL), 3 Bhairahawa lines (BL) and 2 commercial heat tolerant check varieties, that is, Bhrikuti and Gautam (Table 1).
| S. No. | Genotypesa | Source | Characteristics | S. No. | Genotypesa | Source | Characteristics |
|---|---|---|---|---|---|---|---|
| T1 | Bhrikuti | CIMMYT, Mexico | Heat tolerant check | T11 | NL 1376 | CIMMYT, Mexico | Advanced line |
| T2 | BL 4407 | Nepal | Advanced line | T12 | NL 1381 | CIMMYT, Mexico | Advanced line |
| T3 | BL 4669 | Nepal | Advanced line | T13 | NL1384 | CIMMYT, Mexico | Advanced line |
| T4 | BL 4919 | Nepal | Advanced line | T14 | NL 1386 | CIMMYT, Mexico | Advanced line |
| T5 | Gautam | Nepal | Heat stress tolerant | T15 | NL 1387 | CIMMYT, Mexico | Advanced line |
| T6 | NL 1179 | CIMMYT, Mexico | Advanced line | T16 | NL 1404 | CIMMYT, Mexico | Advanced line |
| T7 | NL 1346 | CIMMYT, Mexico | Advanced line | T17 | NL 1412 | CIMMYT, Mexico | Advanced line |
| T8 | NL1350 | CIMMYT, Mexico | Advanced line | T18 | NL 1413 | CIMMYT, Mexico | Advanced line |
| T9 | NL 1368 | CIMMYT, Mexico | Advanced line | T19 | NL 1417 | CIMMYT, Mexico | Advanced line |
| T10 | NL 1369 | CIMMYT, Mexico | Zn fortified variety | T20 | NL 1420 | CIMMYT, Mexico | Advanced line |
- Abbreviations: BL, Bhairahawa lines; NL, Nepal lines; NWRP, National Wheat Research Programme.
- a The pedigree information of the genotypes were maintained by NWRP, Bhairahawa for confidential purpose.
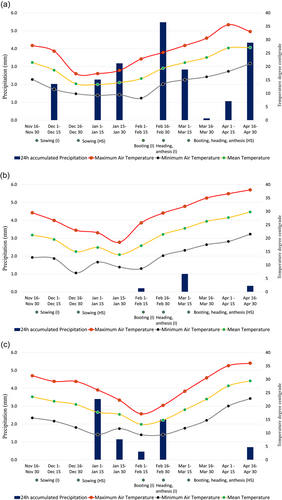
The agroclimatic parameters such as maximum daily air temperature, minimum daily air temperature, mean daily air temperature and 24 h accumulated precipitation were provided by Department of Hydrology and Meteorology (DHM), located near the experimental site at Bhairahawa. The daily climatic parameters were averaged at 15 days interval and is presented in (Figure 1).
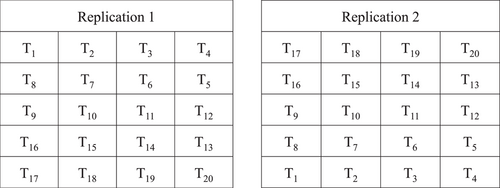
The field experiment was conducted under irrigated and heat stress environments by using alpha lattice design for three wheat growing season of 2020, 2021, 2022 altogether created six distinct environments (two environments each year × 3 years). Each environments (irrigated and heat stress) comprised of 20 genotypes as treatments which were replicated twice (Figure 2). There were five blocks and four plots in each replications. Each genotypes were planted in a plot with dimension of 4 m × 2.5 m. The environment were assigned as irrigated 2020 (IR1), irrigated 2021 (IR2), irrigated 2022 (IR3) and heat stress 2020 (HS1), heat stress 2021 (HS2) and heat stress 2022 (HS3).
Wheat sowing was done on 25th November and 25th December under irrigated and heat stress environment, respectively. One month late sowing of wheat on 25th December ensured the flowering and grain filling period of wheat coincides with terminal heat stress in February–March and temperature range of (>24°C) that ensured heat stress on wheat (Figure 1). A recommended six doses of irrigation as suggested by NWRP was provided at crown root initiation, tillering, jointing, booting, heading and soft dough stages of wheat under all tested environments.
Compost manure was applied at the rate of 5 t ha−1 and the recommended dose of chemical fertiliser at 100:50:25 kg NPK ha−1 were applied. Full dose of phosphorus, potash and half dose of nitrogen were applied at the time of field preparation and the remaining dose of nitrogen was top dressed in two split doses: 25% at 30 days after sowing (DAS) and remaining 25% at 70 DAS. Two manual weddings were done during tillering and heading stages of plants. When the crop reached harvestable maturity, harvesting was done from two quadrants of 1 m2 plot and converted to kg ha−1.
The experiment employs collection of phenolgical, growth, spike related and yield of wheat. The phenological data such as days to booting (DTB), days to heading (DTH) and days to anthesis (DTA) were collected when 50% of the whole plants on the plot showed full booting, full heading and full anthesis, respectively. Growth related parameters such as plant height (Ph) and spike length (SL) were measured using a measuring scale. The length from ground to the top of uppermost spikelet was considered as Ph while the length from spike base to uppermost spikelet was considered as SL. NSPMS were counted manually. Spikelet per spike (SPS) and grains per spike (GPS) were counted manually from randomly selected 10 sample plants. Ten spike weight (TSW) and thousand kernel weight (TKW) were taken by measuring 10 sample spikes and 1000 counted grains.
Pearson correlation method was employed to access the overall association among agronomic parameters studied. The direct and indirect contribution of agronomic parameters on grain yield of wheat was accessed via path coefficient analysis. Matrix method was employed to access path coefficient analysis keeping grain yield as dependent variable and other agronomic parameters as independent variables. The mathematical calculation for path analysis employs formation of Matrix A (correlation matrix), calculation of A−1 and matrix multiplication of A−1 with B (grain yield matrix). To visually demonstrate the direct and indirect association among agronomic parameters, network diagram were plotted where the boldness of the line denotes strength of association.
The performance of wheat genotypes under irrigated and heat stress environment were classified using Ward method's based cluster analysis. To explore the association among high yielding clusters and agronomic parameters of wheat, PCA was plotted where, the association among agronomic parameters were presented based on cosine of angle between component vectors (Bhandari et al., 2024).
3 RESULTS AND DISCUSSION
The combined analysis of variance showed that heat stress environment had significant effect on the expression of all the parameters studied (p < 0.01). Phenological parameters such as DTB, DTH and DTA were reduced by 14%, 14.8% and 16.1%, respectively. The growth parameters Ph, SL were reduced by 9.7% and 4.2% while spike related parameters such as NSPMS, number of spikelets per spike (NSPS), number of grains per spike (NGPS), TSW and TKW were reduced by 7.3%, 4.3%, 9.2%, 13.4% and 12.1%, respectively. The maximum impact of heat stress environment was observed on grain yield of wheat with 28.8% reduction as compared to irrigated environment (Table 2).
| Environments | DTB | DTH | DTA | Ph (cm) | SL (cm) | NSPMS | NSPS | NGPS | TSW (g) | TKW (g) | GY (kg ha−1) |
|---|---|---|---|---|---|---|---|---|---|---|---|
| Irrigated | 79 | 85 | 89 | 93.8 | 10.4 | 379 | 18 | 44 | 22.0 | 36.1 | 3978.8 |
| Heat stress | 68 | 72 | 75 | 84.8 | 10.0 | 351 | 17 | 40 | 19.1 | 31.7 | 2833.3 |
| Mean | 74 | 78 | 82 | 89.3 | 10.2 | 365 | 17 | 42 | 20.6 | 33.9 | 3406.1 |
| % Reduction | 14.0 | 14.8 | 16.1 | 9.7 | 4.2 | 7.3 | 4.3 | 9.2 | 13.4 | 12.1 | 28.8 |
| F-value | *** | *** | *** | *** | *** | *** | *** | *** | *** | *** | *** |
- Abbreviations: DTA, days to anthesis; DTB, days to booting; DTH, days to heading; GY, grain yield; NGPS, number of grains per spike; NSPMS, number of spikes per metre square; NSPS, number of spikelets per spike; Ph, plant height; SL, spike length; TKW, thousand kernel weight; TSW, ten spike weight.
- *** Level of significance at 0.1%.
All the genotypes under heat stress environments were earlier in booting, heading, and anthesis (Table 2, Supporting Information: Tables S1 and S2). The earliness in heading and booting of wheat genotypes under heat stress environments is considered as a mechanism of avoidance for upcoming terminal heat stress (Mondal et al., 2013). Heat stress causes malfunctioning of biochemical processes inside the cells. The major biochemical changes includes the production of reactive oxygen species such as singlet oxygen (1O2), superoxide (O−2), hydrogen peroxide (H2O2) and hydroxyl radicals (OH−1) (Chen et al., 2017; Dudziak et al., 2019; Khan et al., 2020). Heat stress also induces the production of growth retardants such as abscisic acid and ethylene. ROS along with growth retardants induces senescence related metabolic reaction that induces the earlier senescence in wheat (Bhandari et al., 2024). The earlier senescence is associated with earliness in booting and heading which helps plant to escape from upcoming terminal heat stress (Bhandari et al., 2024; Pinto et al., 2016). Late booting and heading genotypes generally suffers from heat stress at critical phenological stages (Zahra et al., 2021). Temperature stress during critical reproductive and grain filling stage causes grain shrinkage that ultimately causes poor grains development. Temperature above 24°C during anthesis also causes pollen abortion and premature pollen dehiscence (Bokshi et al., 2021). Hence, the change of pollen abortion and premature pollen dehiscence is higher in wheat suffering from heat stress. Hence, the net GPS and spike weight was reduced by 7% and 14%, respectively, under heat stress environment.
Parameters such as Ph, SL and NSPS are rather associated to growth of wheat (Bhandari et al., 2024). The time period for growth of wheat critically determines the overall Ph, SL and NSPS. Longer growth period helps plants to collect more photosynthates that are used for apical growth. The length of spikes on the other hand starts 1 month before booting of wheat. Hence, the time period for spike initiation to booting plays critical role for SL of wheat. Longer duration of spike initiation to booting results in longer spikes. Since, spikelets are borne on rachis of spike, longer spike can have more spikelets on spike (Fernández-Gómez et al., 2020; Gaju et al., 2009). Since, under heat stress environment, the growth of wheat is suppressed, the overall time period for spike initiation to booting reduces as a result SL and SPS reduces.
The ANOVA of AMMI model showed that, grain yield of wheat was significantly affected by the Environments (E), genotypes (G), and genotypes x environment interaction (G × E) that explained 72.70%, 5.56% and 21.75% variation in the yield, respectively (Table 3). The AMMI model ANOVA also revealed that the first two PCs explained 50.11%, 22.60% of the total variation in the yield. All together, 72.71% of the total variation was explained by the first two principal components which is sufficient to explain the yield stability of genotypes under the GGE biplot model (Aktaş, 2016; Ngailo et al., 2019; Thungo et al., 2020).
| Sum of square | % Variation explained | % Cumulative variation | Mean sum of square | F-value | |
|---|---|---|---|---|---|
| Environment (E) (df = 5) | 130,512,992.1 | 72.70 | 72.70 | 26,102,598.42 | *** |
| Genotypes (G) (df = 19) | 9,979,431.5 | 5.56 | 78.25 | 525,233.24 | *** |
| G × E interaction (df = 95) | 39,041,413.2 | 21.75 | 100.00 | 410,962.24 | *** |
| PC1 (df = 23) | 19,562,967.7 | 50.11 | 50.11 | 850,563.81 | *** |
| PC2 (df = 21) | 8,824,672.7 | 22.60 | 72.71 | 420,222.51 | ** |
| Residuals (df = 120) | 28,086,561.6 | 0.00 | 0.00 | 234,054.68 | ns |
- Note: ** and *** denotes level of significance at 1% and 0.1%, respectively.
- Abbreviations: PC1, principal component 1; PC2, principal component 2.
The genotypes and environments lying on the same vertical line have the same yield performance and the genotypes and environments lying in the same horizontal line have same interaction pattern. In AMMI biplot, a PC1 score close to the origin identifies stable genotypes (Figure 3a). The vectors with larger PC1 identifies adaptive genotypes. Genotypes clustering together have similar performance. Two cluster are formed in the AMMI biplot. The first cluster consists of three genotypes NL 1346 (7), NL 1381 (12) and NL 1404 (16). Whereas another cluster consists of seven clusters comprising Gautam (5), NL 1350 (8), NL 1376 (11), NL 1384 (13), NL 1386 (14), NL 1387 (15) and NL 1413 (18) (Figure 3a). NL 1369 (10) was found to be the most stable genotype of wheat. Bhrikuti (1), NL 1350 (8) and BL 4919 (4) were the most adaptable wheat genotypes under irrigated wheat growing environment of 2020 (IR1), 2021 (IR2) and 2022 (IR3) while NL 1387 (15), NL 1417 (19) and NL 1412 (17) were the most adaptable wheat genotypes under heat stress environments of 2020 (HS1), 2021 (HS2) and 2022 (HS3) (Figure 3a).

The Which Won Where (WWW) model suggests winning genotypes under different environments by visualising performance and stability in the graph through Average Environmental Co-ordinates (AEC) (Bhandari et al., 2024; Thungo et al., 2020). WWW model have been used to evaluate stability of the genotypes in a multienvironmental trail (Bishwas et al., 2021; Thungo et al., 2020). To determine stability of genotypes, arrowheads are projected from AEC in the form of dotted vertical lines that determine the stability of the genotypes (Thungo et al., 2020). Genotypes with short projections from the AEC axis indicate high stability and vice versa is true. High-yielding and adaptable genotypes can also be identified using WWW model (Bhandari et al., 2024; Jat et al., 2017; Kendal & Kendal, 2019; Neisse et al., 2018; Regmi et al., 2021). The genotypes towards origin in the polygon were stable genotypes. NL 1369 (10), NL 1386 (14) and NL 1376 (11) were the most stable genotypes under all tested environments (Figure 3b). The genotypes lying towards the vertex of a certain environment are considered as adaptable genotypes to that environment. The polygon on the WWW biplot shows BL 4407 (2), NL 1384 (13) and NL 1346 (7) to be most adaptable wheat genotypes under irrigated environment of 2020 (IR1), 2021 (IR2) and 2022 (IR3) while BL 4407 (2), NL 1384 (13) and NL 1381 (12) under heat stress environment of 2020 (HS1), 2021(HS2) and 2022 (HS3), respectively (Figure 3b).
In the Mean versus Stability model, the length of abscissa gives genotypes with above and below-average yield genotypes of right and left of the origin, respectively (Figure 3c). The length of the ordinate gives stability to genotypes, the more the length, the more will be variability and vice versa is true (Bishwas et al., 2021). Genotypes lying far right from the origin with smaller arrowhead projection are identified as high-yielding stable genotypes (Figure 3c).
The biplot shows BL 4407 (2), NL 1384 (13), NL 1404 (16), NL 1417 (19), NL 1386 (14), NL 1412 (17), NL 1381 (12), NL 1346 (7) and NL 1387 (15) were the above average yielding genotypes among them NL 1404 (16), NL 1417 (19) and NL 1386 (14) were the above average yielding stable genotypes. On contract, Gautam (5), BL 4669 (3), NL 1413 (18), NL 1179 (6), NL 1350 (8), BL 4919 (4), NL 1420 (20), Bhrikuti (1) and NL 1368 (9) among them NL 1350 (8) and Bhrikuti (1) were below average yielding stable genotypes (Figure 3c).
Ranking genotypes help in the identification of ideal genotypes across all environments (Akter et al., 2015). The ideal genotypes are selected based on the arrowhead at the innermost concentric circles (Figure 3d). The ranking is done by drawing two coordinate axis—a line joining the arrowhead and origin and first axis and the line perpendicular to it at origin (Bishwas et al., 2021; Ngailo et al., 2019). NL 1384 (13) was the most ideal genotype that can be used for comparison with other genotypes. NL 1384 (13) was very close to the ideal line and concentric centre. The general ranking of genotypes from the biplot is,
NL 1384 (13) > NL 1417 (19) > NL 1413 (18) > Gautam (5) > NL 1404(16) > NL 1381(12) > NL 1412(17) > NL 1386(14) > NL 1387(15) > NL 1369 (10) > NL 1376 (11) > NL 1420 (20) > NL 1350 (8) > Bhrikuti (1) > NL 1368 (9) > BL 4669 (3) > NL 1346 (7) > NL 1179 (6) > BL 4407 (2) > BL 4919 (4) (Figure 3d).
The combined phenotypic correlation among yield and yield attributing parameters showed that grain yield had a significant positive correlation with TSW and TKW under both irrigated and heat stress environment (Table 4). Majority of the morphological parameters were found to have statistically significant association with agronomic parameters studied. Grain yield had a significant positive correlation with Ph, NGPS as well under heat stress environment. The phenological parameters especially DTB has significant negative correlation with grain yield of wheat under both environments (Table 4). It clearly presents some form of selection parameters for effective selection of high yielding wheat genotype under irrigated and heat stress environment. Genotypes with earlier booting along with higher grain yield and spike weight can be promoted under both wheat growing environments (Bhandari et al., 2023). Whereas taller genotypes should especially considered for heat stress breeding of elite wheat genotypes.
| DTB | DTH | DTA | Ph | SL | NSPMS | NSPS | NGPS | TSW | TKW | GY | |
|---|---|---|---|---|---|---|---|---|---|---|---|
| DTB | 1 | 0.892** | 0.776** | −0.257** | −0.104 | −0.034 | 0.458** | −0.126 | 0.058 | 0.015 | −0.285** |
| DTH | 0.714** | 1 | 0.739** | −0.060 | −0.016 | −0.042 | 0.502** | −0.021 | 0.150 | 0.184 | −0.170 |
| DTA | 0.721** | 0.884** | 1 | −0.109 | −0.137 | −0.009 | 0.096 | −0.138 | −0.066 | −0.094 | −0.033 |
| Ph | −0.172 | 0.237** | 0.209 | 1 | 0.452** | −0.281* | 0.130 | 0.387** | 0.449** | 0.647** | 0.586** |
| SL | −0.298** | −0.279** | −0.244* | 0.314** | 1 | −0.434** | 0.268** | 0.289** | 0.568** | 0.539** | 0.133 |
| NSPMS | 0.242* | −0.027 | 0.042 | −0.387** | −0.235* | 1 | −0.163 | −0.256* | −0.556** | −0.511** | 0.103 |
| NSPS | 0.162 | 0.416** | 0.352** | 0.265** | 0.153 | −0.150 | 1 | 0.221* | 0.441** | 0.406** | −0.090 |
| NGPS | −0.158 | 0.047 | 0.146 | 0.346** | 0.177 | −0.117 | 0.409** | 1 | 0.581** | 0.322** | 0.543** |
| TSW | −0.144 | 0.071 | 0.200 | 0.451** | 0.460** | −0.507** | 0.494** | 0.589** | 1 | 0.731** | 0.272** |
| TKW | −0.428** | 0.065 | −0.009 | 0.463** | 0.247* | −0.481** | 0.213 | 0.028 | 0.461** | 1 | 0.353** |
| GY | −0.233* | −0.015 | −0.021 | 0.101 | 0.046 | −0.035 | 0.167 | 0.107 | 0.183* | 0.341** | 1 |
- Note: * and ** denotes level of significance at 5% and 1% respectively while bold number denotes significant correlation coefficients.
- Abbreviations: DTA, days to anthesis; DTB, days to booting; DTH, days to heading; GY, grain yield (kg ha−1); NGPS, number of grains per spike; NSPMS, number of spikes per metre square; NSPS, number of spikelets per spike; Ph, plant height; SL, spike length; TKW, thousand kernel weight; TSW, ten spike weight.
Path analysis revealed that under irrigated environment, day to booting had direct negative effect on grain yield of wheat, while NSPS, NGPS, TSW, TKW had direct positive effect on grain yield of wheat. DTH, DTA and NSPMS had indirect negative effect on yield of wheat while SL had indirect positive effect on grain yield of wheat (Table 5).
| Parameters | DTB | DTH | DTA | Ph | SL | NSPMS | NSPS | NGPS | TSW | TKW | r(GY) | |
|---|---|---|---|---|---|---|---|---|---|---|---|---|
| DTB | I | −0.290 | 0.057 | 0.041 | 0.017 | 0.020 | 0.047 | 0.018 | 0.000 | −0.015 | −0.126 | −0.233* |
| HS | −0.122 | −0.429 | 0.437 | −0.064 | 0.011 | −0.016 | −0.037 | −0.068 | −0.005 | 0.008 | −0.285* | |
| DTH | I | −0.207 | 0.079 | 0.050 | −0.023 | 0.019 | −0.005 | 0.046 | 0.000 | 0.008 | 0.019 | −0.015 |
| HS | −0.109 | −0.481 | 0.416 | −0.015 | 0.002 | −0.020 | −0.040 | −0.011 | −0.013 | 0.101 | −0.170 | |
| DTA | I | −0.209 | 0.070 | 0.056 | −0.020 | 0.016 | 0.008 | 0.039 | 0.000 | 0.021 | −0.003 | −0.021 |
| HS | −0.095 | −0.355 | 0.563 | −0.027 | 0.014 | −0.004 | −0.008 | −0.074 | 0.006 | −0.052 | −0.033 | |
| Ph | I | 0.050 | 0.019 | 0.012 | −0.097 | −0.021 | −0.075 | 0.029 | 0.001 | 0.048 | 0.136 | 0.101 |
| HS | 0.031 | 0.029 | −0.061 | 0.249 | −0.046 | −0.132 | −0.010 | 0.208 | −0.038 | 0.357 | 0.586* | |
| SL | I | 0.086 | −0.022 | −0.014 | −0.031 | −0.067 | −0.046 | 0.017 | 0.000 | 0.049 | 0.073 | 0.046 |
| HS | 0.013 | 0.008 | −0.077 | 0.112 | −0.102 | −0.203 | −0.022 | 0.155 | −0.048 | 0.297 | 0.133 | |
| NSPMS | I | −0.070 | −0.002 | 0.002 | 0.038 | 0.016 | 0.194 | −0.017 | 0.000 | −0.054 | −0.142 | −0.035 |
| HS | 0.004 | 0.020 | −0.005 | −0.070 | 0.044 | 0.468 | 0.013 | −0.138 | 0.047 | −0.282 | 0.103 | |
| NSPS | I | −0.047 | 0.033 | 0.020 | −0.026 | −0.010 | −0.029 | 0.111 | 0.001 | 0.052 | 0.063 | 0.167 |
| HS | −0.056 | −0.241 | 0.054 | 0.032 | −0.027 | −0.076 | −0.081 | 0.119 | −0.037 | 0.224 | −0.090 | |
| NGPS | I | 0.046 | 0.004 | 0.008 | −0.034 | −0.012 | −0.023 | 0.045 | 0.002 | 0.063 | 0.008 | 0.107 |
| HS | 0.015 | 0.010 | −0.078 | 0.096 | −0.030 | −0.120 | −0.018 | 0.538 | −0.049 | 0.178 | 0.543* | |
| TSW | I | 0.042 | 0.006 | 0.011 | −0.044 | −0.031 | −0.098 | 0.055 | 0.001 | 0.106 | 0.136 | 0.183* |
| HS | −0.007 | −0.072 | −0.037 | 0.112 | −0.058 | −0.260 | −0.036 | 0.313 | −0.085 | 0.403 | 0.272* | |
| TKW | I | 0.124 | 0.005 | −0.001 | −0.045 | −0.017 | −0.093 | 0.024 | 0.000 | 0.049 | 0.295 | 0.341* |
| HS | −0.002 | −0.088 | −0.053 | 0.161 | −0.055 | −0.239 | −0.033 | 0.173 | −0.062 | 0.551 | 0.353* |
- Note: * denotes level of significance at 5% and bold number denotes direct effect of parameters on grain yield of wheat.
- Abbreviations: DTA, days to anthesis; DTB, days to booting; DTH, days to heading; HS, heat stress environment; I, irrigated environment; NGPS, number of grains per spike; NSPMS, number of spikes per metre square; NSPS, number of spikelets per spike; Ph, plant height; r(GY), correlation with grain yield; SL, spike length; TKW, thousand kernel weight; TSW, ten spike weight.
Under heat stress environment, DTB, DTH and NSPS had direct negative effect, while Ph, NSPMS, NGPS and TKW had direct positive effect on grain yield of wheat. While DTA had indirect negative effect on the yield and SL and TSW had indirect positive effect on grain yield of wheat (Table 5).
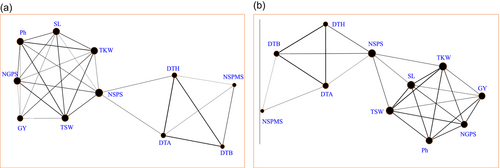
The direct and indirect association among agronomic parameters of wheat with the yield is represented by direct connected black line on the network diagram where the degree of boldness represents the strength of association among two parameters (Figure 4). Network diagram revealed, yield is mainly determined by Ph, SL, NGPS, TSW and TKW. The grain yield of wheat under irrigated environment is mainly affected by TKW, NGPS and TSW while it is moderately affected by Ph and SL (Figure 4a). Whereas under heat stress environment, grain yield is mainly affected by Ph and NGPS while moderate effect of TKW, TSW and SL were observed (Figure 4b).
To visualise the yield performance of wheat genotypes under irrigated and heat stress environment, classical clustering was done based on grain yield of wheat under both wheat growing environments. The Ward's method based classical clustering classified wheat genotypes into five and four distinct clusters under irrigated and heat stress environment, respectively (Figure 5).
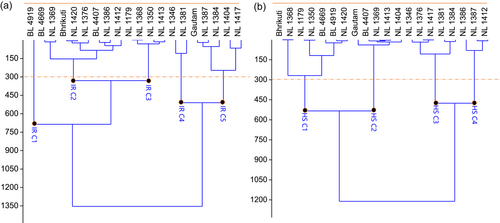
The mean performance of genotypic clusters under irrigated and heat stress environment is presented in (Table 6). IR C1 (4728.9 kg ha−1) and HS C1 (3123.9 kg ha−1) were the highest yielding clusters under irrigated and heat stress environments, respectively (Table 6).
| Cluster | DTB | DTH | DTA | Ph (cm) | SL (cm) | NSPMS | NSPS | NGPS | TSW (g) | TKW (g) | GY (kg ha-1) |
|---|---|---|---|---|---|---|---|---|---|---|---|
| IR C1 | 73.7 | 79.2 | 85.5 | 96.4 | 11.4 | 368.9 | 17.5 | 49.4 | 26.7 | 40.3 | 4728.9 |
| IR C2 | 79.3 | 84.8 | 90.1 | 93.6 | 10.5 | 368.3 | 17.4 | 42.4 | 22.1 | 37.8 | 4043.7 |
| IR C3 | 79.6 | 85.0 | 88.8 | 95.1 | 10.4 | 391.7 | 17.4 | 44.4 | 21.1 | 34.3 | 4221.7 |
| IR C4 | 77.5 | 83.0 | 87.4 | 91.9 | 9.9 | 390.0 | 17.8 | 48.4 | 20.8 | 33.7 | 3399.9 |
| IR C5 | 80.1 | 85.5 | 90.4 | 93.4 | 10.4 | 382.0 | 17.6 | 44.1 | 22.2 | 35.0 | 3762.4 |
| HS C1 | 67.7 | 71.7 | 74.6 | 86.4 | 10.2 | 352.4 | 16.6 | 42.3 | 19.8 | 32.8 | 3123.9 |
| HS C2 | 67.8 | 71.9 | 74.8 | 84.4 | 9.9 | 350.0 | 16.7 | 39.4 | 19.4 | 31.6 | 2854.9 |
| HS C3 | 67.8 | 71.8 | 74.7 | 83.0 | 9.7 | 359.8 | 16.7 | 40.6 | 17.7 | 29.6 | 2690.5 |
| HS C4 | 69.6 | 73.6 | 76.8 | 84.3 | 10.1 | 335.3 | 17.3 | 35.2 | 19.2 | 33.0 | 2357.4 |
- Abbreviations: DTA, days to anthesis; DTB, days to booting; DTH, days to heading; GY, grain yield; NGPS, number of grains per spike; NSPMS, number of spikes per metre square; NSPS, number of spikelets per spike; Ph, plant height; SL, spike length; TKW, thousand kernel weight; TSW, ten spike weight.
The PCA among agronomic parameters and clusters (five clusters under irrigated and four clusters under heat stress) were done and the degree of association among clusters and agronomic parameters were accessed based on the cosine of angle between the agronomic parameters (Supporting Information: Tables S3 and S4). PCA extracted two components PC1 and PC2 under both irrigated and heat stress environment (Eigen value > 1) that cumulatively explained 98.07% and 89.94% of the total variation, respectively (Figure 6).
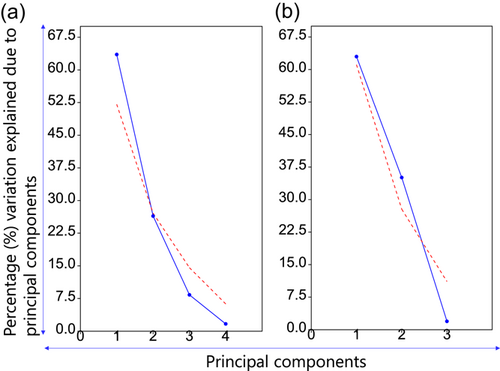
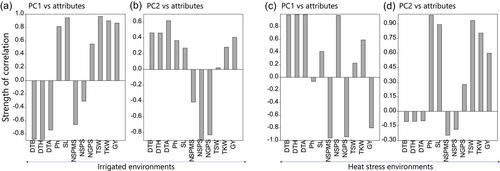
The high yielding and low yielding clusters are represented by their relative position on the biplot. The principal component biplot is divided into four quadrants under both irrigated and heat stress environment. The high yielding and low yielding quadrant are classified based on correlation of PC1 and PC2 with desired agronomic parameters. The length of bar on correlation plot represents strength of correlation either positive (upward bar) and negative (downward bar). PC1 and PC2 had a positive correlation with grain yield under irrigated environment which means genotypes or clusters having higher PC1 and PC2 would have higher yield under irrigated environment (Figure 7a,b). Hence, the high yielding genotypes or clusters lies in the first quadrant in the component biplot (Figure 8a). On contract, PC1 and PC2 had negative and positive correlation with grain yield of wheat under heat stress environment, respectively (Figure 7a,b). Which means, genotype having lower PC1 and higher PC2 would yield high under heat stress environments. Hence, the high yielding genotype or cluster lies on the second quadrant on the component biplot (Figure 8b). Hence, IR C1 and HS C1 cluster were highest yielding cluster under irrigated and heat stress environment, respectively.
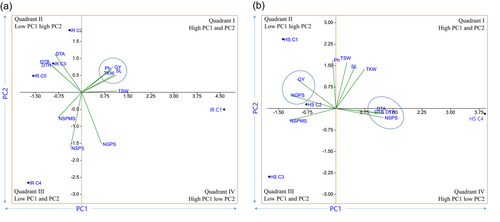
On the PCA biplot, the vector angle of less than 90° represents strong positive correlation while vector angle close to 180° represents strong negative correlation (Bhandari et al., 2024; Dorostkar et al., 2015; Nayana et al., 2022). Similarly, vector angle close to 90° represents no correlation among two parameters studied. Grain yield showed lowest vector angle with Ph, SL, TKW and TSW whereas highest vector angle was observed with DTB, DTH and DTA under irrigated environments (Figure 8a). Similarly, GY had lowest vector angle with GPS, NSPMS and Ph with highest vector angle with DTB, DTH and DTA under heat stress environment (Figure 8b). Hence, selection can be done with agronomic parameters such as Ph, SL, TSW and TKW under irrigated environment while NSPMS, NGPS and Ph under heat stress environment. Selection based on phenological parameters favours both environments where earliness should be promoted to get high yielding genotypes.
4 CONCLUSION
Climate change has been one of the major threats of food and nutritional security of the world. Heat stress and temperature rise have been reported to affect various agronomic parameters including the yield of wheat. The research was conducted to evaluate the stability and adaptability of elite wheat genotypes and to identify the selection parameters for high yield wheat genotypes. The finding shows heat stress had a substantial effect on all the parameters studied. Environment, genotype, and G × E interaction explained 72.70%, 5.56% and 21.75% of total yield variation. WWW model revealed that NL 1369, NL 1386 and NL 1376 were the most adaptable genotypes. BL 4407, NL 1384 and NL 1346 were the most adaptable genotypes under irrigated environments while BL 4407, NL 1384 and NL 1381 under heat stress environment. DTB, Ph, SL, TSW and TKW had overall highest association and direct effect on overall yield performance of wheat. Hence, selection via traits such as shorter DTB, longer Ph, SL and higher TSW and TKW would be beneficial across both environments. Whereas breeding based on higher Ph should specifically be focused for high yielding genotypes under heat stress environments.
AUTHOR CONTRIBUTIONS
Radhakrishna Bhandari: Experiment; analytical methods; data analysis; visualisation; validation; writing—original draft; writing—review and editing. Mukti R. Poudel: Conceptualisation; design; experiment; supervision. The final version of the manuscript was proofread by both the authors.
ACKNOWLEDGEMENTS
The authors acknowledge National Wheat Research Programme (NWRP) for providing the genetic material, and Institute of Agriculture and Animal Science (IAAS), Paklihawa Campus for providing field for the experiment.
CONFLICT OF INTEREST STATEMENT
The authors declare no conflict of interest.
ETHICS STATEMENT
The author confirm that they have adhered to the ethical policy of the journal.
Open Research
DATA AVAILABILITY STATEMENT
The data will be available on request to the corresponding author Radhakrishna Bhandari.


