First-Principles Study of the 30° and 90° Partial Dislocations in HgTe, CdTe, and Hg0.7Cd0.3Te
Abstract
The goals of this study are to use density functional theory to study the core structure energetics of the 30° and 90° partial dislocations in HgTe, CdTe, and Hg0.7Cd0.3Te as well as the density of states of these dislocations in CdTe and Hg0.7Cd0.3Te. For the 30° partial dislocations, two stable dislocation pairs were found. The pair with a double-periodic α-core (Te) dislocation and a single-periodic β-core (Hg/Cd) dislocation was found to be the most stable out of the two for the simulation sizes tested. For the 90° partial dislocations, two stable dislocation pairs were also found. The first has a single-periodic β-core dislocation and a single-periodic α-core dislocation, whereas the second has a double-periodic β-core dislocation and a single-periodic α-core dislocation. The most stable out of the two depends on the simulation size tested. For both of these partial dislocations in Hg0.7Cd0.3Te, it was found that it is energetically favourable for Hg atoms to segregate to the dislocation cores. Furthermore, in CdTe and Hg0.7Cd0.3Te, it was found that the 90° partial dislocations are likely to be more detrimental to the material optoelectronic properties since they introduce more mid-gap states within the band gap in comparison to the 30° partial dislocations.
1 Introduction
Since its conception in 1959,[1] Hg1−xCdxTe remains the semiconductor material of choice for fabricating infrared (IR) detectors for the mid-wavelength (MWIR; 3-5 μm) and long-wavelength (LWIR; 8-12 μm) range for high-performance applications.[2, 3] This is despite the competition from alternative material systems, such as InSb for MWIR detectors and GaAs/AlGaAs quantum well IR photoconductors (QWIP) for LWIR applications.[3] The success of Hg1−xCdxTe compared to its competitors is due to its superior optoelectronic properties––tailorable energy bandgap over the entire infrared spectrum (by modifying the Cd composition x), high quantum efficiency, and favorable inherent recombination mechanisms.[3]
The presence of dislocations in Hg1−xCdxTe is suspected to cause trap states within the bandgap which are responsible for Shockley–Read–Hall (SRH) recombination.[4] An increase in the dislocation density, and thus an increase in SRH recombination, is undesirable since it degrades the optoelectronic properties of the detector, particularly during low-temperature operation.[5] For example, it has been found experimentally that an increase in dislocation density causes a decrease in the detector R0A product (differential zero-bias diode resistance times junction area) and an increase in the 1/f (f is frequency) noise current for LWIR detectors at temperatures below 78 K.[6] Similar results have also been found for MWIR detectors showing a correlation between an increase in the dislocation density and reduced detector performance at 80 K.[7, 8] Nonetheless, there is still a lack of theoretical understanding of the direct effects that dislocations have on the electronic properties of Hg1−xCdxTe. While there have been models proposed that treat dislocations as regions where SRH recombination occurs,[9-11] it is still not known a priori the energy positions of the trap states that are introduced within the bandgap. This information can only be obtained through ab initio methods such as density functional theory (DFT).
Several studies of dislocations in CdTe using DFT are available in the open literature. Some examples include the study of dislocations formed in grain boundaries,[12-14] the glide 60° perfect,[15] 30° partial,[15, 16] and 90° partial dislocations.[15] There has been some discrepancy regarding the most stable core configuration for the 30° partial dislocation. Using hydrogen-terminated clusters as boundary conditions, Kweon et al.[15] found that the most stable configuration for the Cd-core and Te-core is a quadrupole-period (QP) structure. In contrast, using the dipole arrangement of dislocations as boundary conditions, Li et al.[16] found that the core structures do not reconstruct into dimers upon relaxation and essentially have a single-period (SP) structure. The determination of the most stable core configuration is important as the electronic properties depend heavily on it. For example, the QP structure introduces states close to the middle of the bandgap whereas the SP structure only introduces shallow states.[15] Thus far, there has yet to be a study of dislocations in HgTe and Hg1−xCdxTe using DFT.
The purpose of this study was to first find the possible stable core structures of the 30° and 90° partial dislocations. Before introducing dislocations, we first studied bulk HgTe and CdTe as well as bulk Hg1−xCdxTe (x = 0.25, x = 0.30, x = 0.50, and x = 0.75) to observe how well DFT can predict the bulk properties for different compositions, x. Next, dislocation studies were undertaken in HgTe and CdTe and then extended to Hg0.7Cd0.3Te which is the alloy composition suitable for MWIR applications. Subsequently, relevant properties of these core structures were obtained, including the energy differences between different core reconstructions to assess their relative stabilities and the dislocated-related states to assess their impact on the optoelectronic properties.
2 Methodology
2.1 Perfect Crystals of HgTe and CdTe
All DFT calculations were performed using the Vienna Ab Initio Simulation Package (VASP)[17-20] in which the projected augmented-wave (PAW) method was used.[21] All calculations were performed at 0 K and 0 atm. Before simulations were undertaken on systems containing dislocations, we first ran tests on perfect crystals of the primitive cells of binary HgTe and CdTe which contain two atoms. The valence electron configurations used were 5d106s2 for Hg, 4d105s2 for Cd, and 5s25p4 for Te. The exchange-correlation functionals tested include the LDA,[22] LDA + U, PBE,[23] PBE + U, PBEsol,[24] PBEsol + U, and the hybrid functional HSE06.[25] The U parameter here refers to the form introduced by Dudarev et al.,[26] where values of U (or more precisely U–J) up to 12 eV were tested on the Hg d-orbital and Cd d-orbital. The wave functions were expanded in plane waves up to an energy cutoff of 500 eV and the k-space integration was carried out on a 10 × 10 × 10 Γ-centered k-mesh. Convergence concerning the energy cutoff and k-space integration was carefully checked. The values used here provided total energies that converged within 2 meV atom−1. For all the calculations, spin–orbit coupling was taken into account.
Murnaghan's equation of state[27, 28] was used to fit the energy–volume curve to obtain the equilibrium lattice constant and bulk modulus of HgTe and CdTe. The primitive cells with the equilibrium lattice constant were then used to obtain the density of states (DOS) and band structure. From the DOS and band structure, we obtained the bandgap () and spin–orbit splitting energy ().
2.2 Perfect Crystals of Hg1−xCdxTe (x = 0.25, x = 0.30, x = 0.50, and x = 0.75)
To study compositions of Hg1−xCdxTe other than x = 0 and x = 1, a supercell larger than the primitive cell of two atoms is required. Moreover, the Hg and Cd atoms in the lattice should be distributed in a way that is somewhat representative of a perfectly random alloy. Representative structures can be achieved by using special quasirandom structures (SQS),[29] which can mimic the correlation functions of a perfectly random structure up to a certain extent. The “mcsqs” code[30] of the Alloy Theoretic Automated Toolkit (ATAT) was used to generate SQSs by varying the number of atoms, distribution of atoms, and lattice vectors until the desired range of correlation functions were matched.
For x = 0.25, x = 0.50, and x = 0.75, SQSs with 32 atoms were used while for x = 0.30, SQSs with 60 atoms was used. The convergence of the properties of interest — equilibrium lattice constant, bulk modulus, bandgap, and spin–orbit splitting energy—was investigated over a sequence of four different SQSs with an increasing range of matched correlation functions for each composition x. The equilibrium lattice constant and bulk modulus was obtained using the same method mentioned in the previous section using Murnaghan's equation of state.[27, 28] In contrast, the bandgap and spin–orbit splitting energy were obtained using the effective band structures (EBSs),[31] which were calculated for these SQSs in the fcc primitive Brillouin zone. The EBS was obtained by unfolding the band structure of these SQS supercells using the BandUP code.[32, 33] All the information regarding the SQSs used and the resultant properties can be found in Table S1 to S8 for SQS 1 to SQS 4, Supporting Information.
The exchange-correlation functionals tested include the LDA + U, where a U value of 8.5 eV on the Hg d-orbital and 11 eV on the Cd d-orbital was used. For x = 0.25, x = 0.50, and x = 0.75, an energy cutoff of 500 eV and a 6 × 6 × 6 Γ-centered k-mesh were used. For x = 0.30, an energy cutoff of 500 eV and a 4 × 4 × 4 Γ-centered k-mesh were used. The values used here provided total energies that converged within 2 meV atom−1. The equilibrium lattice constant, bulk modulus, bandgap, and spin–orbit splitting energy of the SQS with the largest range of matched correlation functions are presented for each composition x. These include pair, triplet, and quadruplet correlation functions up to the third nearest neighbor.
2.3 Dislocations in HgTe, Hg0.7Cd0.3Te, and CdTe
The long-range strain and stress fields of dislocations limit the number of boundary conditions that can be used in atomistic simulations. One choice would be to use the cluster method, which has the advantage of modeling a single isolated dislocation.[34] Most studies have used a cylinder-shaped cluster of atoms,[35-38] but other configurations such as an oblique-shaped cluster of atoms have also been used.[15] A single dislocation can be introduced using the displacement fields of elasticity theory,[39, 40] which results in boundary conditions that are periodic along the dislocation line in the z-direction, but nonperiodic in the x- and y-directions. As a result, atoms on the cluster surface are usually held fixed to mimic the bulk material and a sufficient vacuum is needed to avoid interactions between neighboring clusters in periodic supercells. However, the presence of surface atoms and their associated dangling bonds often give rise to states within the bandgap.[35] This problem is often circumvented by adding hydrogen or pseudo-hydrogen atoms to these dangling bonds to passivate the surface states.[35] However, fixing this problem results in another issue being introduced as these hydrogen or pseudo-hydrogen atoms interact strongly with the valence and conduction band edges which artificially enlarges the bandgap.[35, 41] The lack of coupling between the long-range elastic field and the core structure may also yield unrealistic results.[35, 41]
Another choice would be to use full periodic boundary conditions. The advantage of this method in comparison to the cluster method is that there are no surfaces involved and thus no interactions between dislocations with either surface, hydrogen, or pseudo-hydrogen atoms.[35] The dislocations are also embedded in an infinite elastic medium, and thus there is full coupling between the long-range elastic field and the core structures.[35] One disadvantage of this method is that it requires multiple dislocations in the supercell and that the sum of their Burgers vectors be equal to zero.[35] A dislocation dipole arrangement in an orthorhombic supercell has been first suggested in the literature,[42] but it was later found that periodicity will not be maintained along one direction of the supercell if the improper height is used.[41] A more convenient solution would be to use the quadrupole arrangement that is always fully periodic regardless of supercell dimensions.[41] This arrangement can be achieved with four dislocations in an orthorhombic supercell or with two dislocations in an oblique supercell.[41] This arrangement has been used extensively in the past since it minimizes the Peach–Koehler force due to image dislocations.[34]
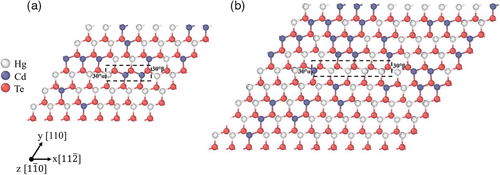
We have tested both of these boundary conditions, with an emphasis on full periodic boundary conditions using the quadrupole arrangement with two dislocations in an oblique supercell. Two oblique SQSs of different sizes were generated using the “mcsqs” code[30] in ATAT for Hg0.7Cd0.3Te, where the correlation functions include pair, triplet, and quadruplet correlation functions up to the third nearest neighbor. Further details regarding these SQSs can be found in Table S2 and S6, Supporting Information. HgTe and CdTe were easily obtained from these SQSs by replacing the appropriate atoms. The first SQS is shown in Figure 1a. For Hg0.7Cd0.3Te, there are 67 Hg atoms, 29 Cd atoms, and 96 Te atoms giving a total of 192 atoms. Two dislocations in a supercell of this size correspond to an areal dislocation density of ≈2.9 × 1013 cm−2. The length of the intrinsic stacking fault between the two partial dislocations in this supercell is ≈9 Å. The second SQS is a larger supercell as shown in Figure 1b. For Hg0.7Cd0.3Te, there are 151 Hg atoms, 65 Cd atoms, and 216 Te atoms leading to a total of 432 atoms. Two dislocations in a supercell of this size correspond to an areal dislocation density of ≈1.3 × 1013 cm−2. The length of the intrinsic stacking fault between the two partial dislocations in this supercell is ≈17 Å. The two partial dislocations in both supercells alternate between the α-core (Te) and the β-core (Hg or Cd). We have also tested the cluster method for only CdTe using an oblique-shaped cluster of atoms similar to that used for CdTe by Kweon et al.[15] The purpose of this was to compare results between the cluster method and the quadrupole arrangement of dislocations. More details regarding the cluster used in this study can be found in the Supporting Information.
The dislocations were introduced into these supercells using the displacement fields of isotropic elasticity theory.[39] For the cluster method, the displacement field for a single dislocation was used.[39] For periodic boundary conditions, the displacement fields for multiple dislocations in a supercell surrounded by periodic neighbor cells were used.[39, 43, 44]
The exchange-correlation functionals tested include the LDA + U, where a U value of 8.5 eV on the Hg d-orbital and 11 eV on the Cd d-orbital was used. An energy cutoff of 500 eV and a 1 × 1 × 3 Γ-centered k-mesh were used. The energy differences between different core reconstructions for the 30° and 90° partial dislocations were obtained to assess their relative stabilities. The DOS of these dislocations were also obtained to observe their impact on the optoelectronic properties of these materials.
3 Results and Discussion
3.1 Perfect Crystals of HgTe and CdTe
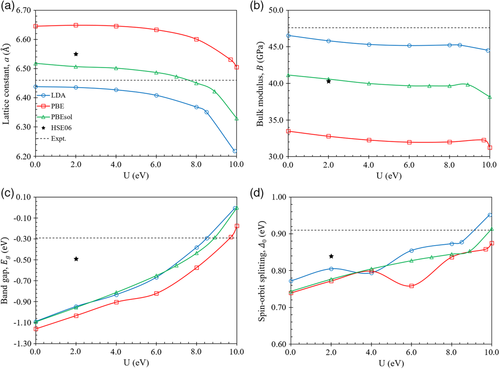
The influence of the U parameter on the lattice constant, bulk modulus, bandgap, and spin–orbit splitting energy of HgTe using the LDA, PBE, and PBEsol exchange-correlation functionals, as well as the HSE06 hybrid functional, is presented in Figure 2. The experimental values have also been included for reference. As shown in Figure 2a, at U = 0, compared to the experimental value of 6.46 Å,[45] LDA underestimates the lattice constant by about 0.3% whereas PBE and PBEsol overestimate the lattice constant by about 2.9% and 0.9%, respectively. The hybrid functional HSE06 overestimates the lattice constant by about 1.4%. As the value of U increases, the lattice constant decreases monotonically for LDA, PBE, and PBEsol. As shown in Figure 2b, at U = 0, compared to the experimental value of 47.6 GPa,[45] LDA underestimates the bulk modulus by about 2.2%. Much larger errors were found for PBE and PBEsol which underestimate the bulk modulus by about 29.7% and 13.6%, respectively. The hybrid functional HSE06 underestimates the bulk modulus by about 15.2%. As U increases, the bulk modulus generally only decreases slightly for LDA, PBE, and PBEsol. As shown in Figure 2c, at U = 0, compared to the experimental value of −0.29 eV,[46] LDA greatly underestimates the negative bandgap by 0.80 eV while PBE and PBEsol underestimate the bandgap by similar amounts of 0.87 and 0.80 eV, respectively. The hybrid functional HSE06 better matches the experimental value and underestimates the bandgap by 0.2 eV. As U increases, the bandgap increases monotonically for LDA, PBE, and PBEsol. An exact match to the experimental bandgap can be achieved by using U parameter values of 8.5, 9.7, and 8.9 for LDA, PBE, and PBEsol, respectively. As shown in Figure 2d, at U = 0, compared to the experimental value of 0.91 eV,[46] LDA underestimates the spin–orbit splitting energy by 0.14 eV. PBE and PBEsol both underestimate the spin–orbit splitting energy by 0.17 eV. The hybrid functional HSE06 better matches the experimental value and underestimates the spin–orbit splitting energy by 0.07 eV. As the value of U increases, the spin–orbit splitting energy generally increases for LDA, PBE, and PBEsol. Since this study is mostly concerned with obtaining accurate bandgaps to further observe the presence of dislocation-related states within the bandgap, we have chosen to use LDA + U (8.5 eV) which matches the experimental bandgap of −0.29 eV. This approach has been used for the perfect crystals and crystals with dislocations in Hg1−xCdxTe in the later sections. While the experimental bandgap can also be matched by using PBE + U (9.7 eV) and PBEsol + U (8.9 eV), the use of LDA + U (8.5 eV) results in lower errors for the bulk modulus (−5.0%) and spin–orbit splitting energy (−0.03 eV) as shown in Figure 2b,d, respectively. PBEsol + U (8.9 eV) does result in a better match to the experimental the lattice constant with an error of about −0.6% compared to LDA + U (8.5 eV), which has an error of about −1.7%. However, the difference between the two is only about 1.1% and not significant.
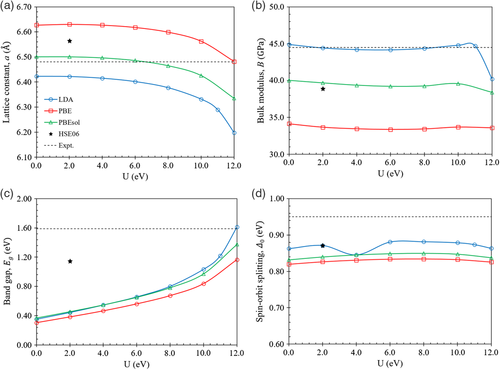
The influence of the U parameter on the properties of CdTe is shown in Figure 3, which were obtained using the LDA, PBE, and PBEsol exchange-correlation functionals, as well as the HSE06 hybrid functional. The experimental values have been included for reference. As shown in Figure 3a for U = 0, in comparison to the experimental value of 6.48 Å,[45] LDA underestimates the lattice constant by about 0.9% whereas PBE and PBEsol overestimate the lattice constant by about 2.3% and 0.3%, respectively. The hybrid functional HSE06 overestimates the lattice constant by about 1.3%. As the value for U increases, the lattice constant decreases monotonically for LDA, PBE, and PBEsol. As shown in Figure 3b, at U = 0, compared to the experimental value of 44.5 GPa,[45] LDA overestimates the bulk modulus slightly by about 0.9%. Much larger errors were found for PBE and PBEsol, which underestimate the bulk modulus by about 23.3% and 10.1%, respectively. The hybrid functional HSE06 underestimates the bulk modulus by about 12.5%. As U increases, the bulk modulus remains fairly constant for PBE and PBEsol. For LDA, the bulk modulus is fairly constant up to U = 11 eV, followed by a sharp drop at U = 12 eV. As shown in Figure 3c, at U = 0, compared to the experimental value of 1.59 eV,[47] LDA greatly underestimates the bandgap by 1.24 eV, while PBE and PBEsol underestimate the bandgap by similar amounts of 1.29 and 1.22 eV, respectively. The hybrid functional HSE06 better matches the experimental value and underestimates the bandgap by 0.44 eV. As U increases, the bandgap increases monotonically for LDA, PBE, and PBEsol. An almost exact match of the CdTe bandgap can be achieved with LDA + U (12 eV), which calculates the bandgap to be 1.61 eV, only 0.02 eV above the experimental value. For the range of U values tested here up to 12 eV, we were unable to obtain a close match to the experimental bandgap for PBE + U and PBEsol + U. Other authors have found that a larger value of U = 13.9 eV using PBE matches the experimental bandgap.[48] As shown in Figure 3d, at U = 0, compared to the experimental value of 0.95 eV,[49] LDA underestimates the spin–orbit splitting energy by just 0.09 eV, while PBE and PBEsol underestimate the spin–orbit splitting energy by 0.13 and 0.12 eV, respectively. The hybrid functional HSE06 has a slightly better match to the experimental value and underestimates the spin–orbit splitting energy by 0.08 eV. As the value of U increases, the spin–orbit splitting energy remains fairly constant for LDA, PBE, and PBEsol, only varying by at most 0.03 eV. While the experimental bandgap can be almost exactly matched using LDA + U (12 eV), we found that this U value introduces problems with the convergence of the electronic steps, especially in the later sections for supercells with dislocations present. Thus, we used LDA + U (11 eV) on the Cd d-orbital instead for simulating Hg1−xCdxTe in the later sections which result in a CdTe bandgap of 1.22 eV, an underestimation from the experimental value by 0.37 eV, which does not introduce any convergence issues. Using this U value for CdTe, the lattice constant is underestimated by 2.9%, the bulk modulus is only overestimated by 0.4% and the spin–orbit splitting energy is underestimated by 0.08 eV.
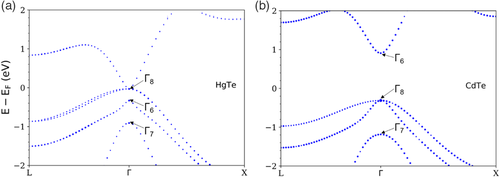
The corresponding band structures using LDA + U (8.5 eV) for HgTe and LDA + U (11 eV) for CdTe are shown in Figure 4. For HgTe in Figure 4a, LDA + U (8.5 eV) results in the correct ordering of the Γ8, Γ6, and Γ7 bands. Similarly, for CdTe in Figure 4b, LDA + U (11 eV) results in the correct ordering of the Γ6, Γ8, and Γ7 bands.
3.2 Perfect Crystals of Hg1−xCdxTe (x = 0.25, x = 0.30, x = 0.50, and x = 0.75)
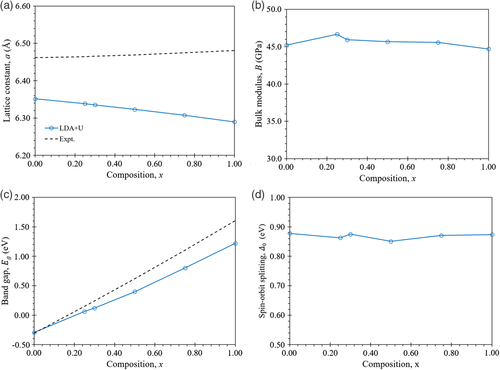
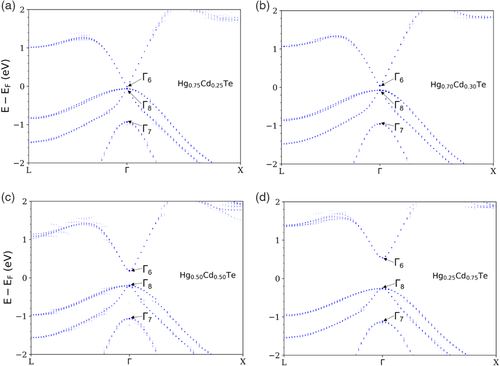
The lattice constant, bulk modulus, bandgap, and spin–orbit splitting energy as a function of the Cd content, x in Hg1−xCdxTe using LDA + U with a U value of 8.5 eV for the Hg d-orbital and a U value of 11 eV for the Cd d-orbital are shown in Figure 5. As shown in Figure 5a, the results indicate that the lattice constant decreases with increasing x, which differs from the experimental fit by Higgins et al.[50] in which the lattice constant increases with increasing x. The error compared to the experimental value increases with x from −1.7% at x = 0 to −3.0% at x = 1. The results in Figure 5b indicates that the bulk modulus remains fairly constant with an increase in x, varying by at most 2 GPa. As shown in Figure 5c, the bandgap is found to increase with increasing x, in agreement with the experimental fit of Laurenti et al.,[51] although at a lower rate. The error compared to the experimental value increases with x from a negligible error at x = 0 to −0.37 eV at x = 1. Regarding the results in Figure 5d, the spin–orbit splitting energy is found to remain fairly constant with increasing x, only varying by at most 0.03 eV. A summary of the properties obtained in this study for each of the x values using LDA + U with a U value of 8.5 eV for the Hg d-orbital and a U value of 11 eV for the Cd d-orbital is shown in Table 1. The EBSs obtained after band unfolding are shown in Figure 6. LDA + U gives results with the correct ordering of the Γ8, Γ6, and Γ7 bands for all the x values tested. Unlike the band structures for the binary compounds, HgTe and CdTe in Figure 4 which have zero broadening, the EBSs of Hg1−xCdxTe alloys in Figure 6 will have some finite level of broadening.[31, 52, 53] For the x values tested here, the band structure appears to be well-defined close to the Γ-point. However, the broadening of the bands is more apparent moving away from the Γ-point towards the L and X-points showing that the wave functions there vary on the atomic scale and are more affected by the distribution of constituent alloy atoms.[31, 52, 53]
| x | a [Å] | B [GPa] | E g [eV] | Δ0 [eV] | ||||
|---|---|---|---|---|---|---|---|---|
| Expt. | LDA + U | Expt. | LDA + U | Expt. | LDA + U | Expt. | LDA + U | |
| 0 | 6.46a),e) | 6.35 | 47.6a) | 45.2 | −0.29b),f) | −0.29 | 0.91b) | 0.88 |
| 0.25 | 6.46e) | 6.34 | – | 46.7 | 0.15f) | 0.06 | – | 0.86 |
| 0.3 | 6.47e) | 6.34 | – | 45.9 | 0.24f) | 0.12 | – | 0.88 |
| 0.5 | 6.47e) | 6.32 | – | 45.7 | 0.62f) | 0.40 | – | 0.85 |
| 0.75 | 6.47e) | 6.31 | – | 45.6 | 1.10f) | 0.80 | – | 0.87 |
| 1 | 6.48a),e) | 6.29 | 44.5a) | 44.7 | 1.59c),f) | 1.22 | 0.95d) | 0.87 |
3.3 Dislocations in HgTe and CdTe
The fully relaxed core structures of the 30° and 90° partial dislocations in HgTe are shown in Figure 7. Two stable 30° partial dislocation pairs in HgTe were found. In Figure 7a, the first configuration has an α-core dislocation and a β-core dislocation with both having an SP structure. Looking at the top view, the core atoms of these dislocations differ from the bulk coordination number of 4 and instead have a coordination number of 3. The atoms adjacent to these core atoms are similar to the bulk atoms and have a coordination number of 4. The cutoff radius used to determine the coordination number is 3 Å. In Figure 7b, the second configuration has an α-core dislocation with a DP structure and a β-core dislocation with an SP structure. Compared to the first configuration in Figure 7a, only the α-core dislocation has a different structure, where the core atoms now alternate between coordination numbers 3 and 4 along the dislocation line. The adjacent Hg atoms have a coordination number of 4 and the Te atoms adjacent to these also alternate between coordination numbers 3 and 4. Two stable 90° partial dislocation pairs in HgTe were found. Figure 7c shows the first configuration, which has a β-core dislocation and an α-core dislocation with both having a symmetric SP structure. The core atoms of these dislocations have a coordination number of 3 while the atoms adjacent to these have a coordination number of 4. Figure 7d shows the second configuration, which has a β-core dislocation with a DP structure and an α-core dislocation with a symmetric SP structure. Compared to the first configuration in Figure 7c, only the β-core dislocation has a different structure, where there is now a mixture of Hg core atoms with coordination numbers of 3 and 4. The Hg atoms to the left of these core atoms alternate between coordination numbers 4 and 3 along the dislocation line.
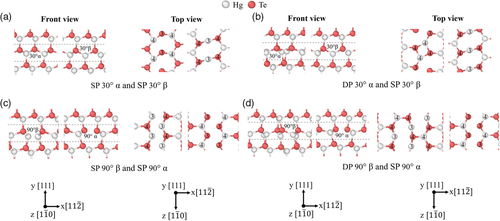
The fully relaxed core structures of the 30° and 90° partial dislocations in CdTe are shown in Figure 8. The types of stable dislocation pairs found are mostly the same as that of HgTe. The 30° partial dislocation pairs in Figure 8a,b, as well as the 90° partial dislocation pair in Figure 8c are identical in structure to their analogues in HgTe. There is a slight difference in structure between the 90° β dislocation in CdTe and HgTe as shown in Figure 8d, 7d, respectively. In CdTe, there is a mixture of Cd core atoms with coordination numbers of 4 and 5. The Cd atoms to the left of these core atoms alternate between coordination numbers 3 and 4 along the dislocation line. The cutoff radius used to determine the coordination number is 3.1 Å. For the sake of brevity, the dislocation structures in Figure 7a,b,d, 8a,b,d was taken from the 432-atom supercell. This is justified as the dislocation structures in Figure 7a,b, 8a,b from the 192 and 432-atom supercells are identical. There is however a slight variation in the coordination numbers of atoms between the DP 90° β dislocations from the 192 and 432-atom supercells in both HgTe and CdTe in Figure 7d, 8d, respectively. As the SP 90° β dislocation was not stable in the 432-atom supercell in HgTe and CdTe, the dislocation structures in Figure 7c, 8c was taken from the 192-atom supercell.
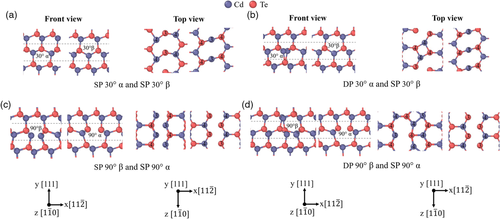
For the 30° partial dislocations in HgTe, the second configuration shown in Figure 7b is more stable than the first configuration shown in Figure 7a. This was found to be the case for the 192-atom supercell where it is more stable by −0.061 eV Å−1 and also for the 432-atom supercell where it was found to be more stable by −0.048 eV Å−1 as shown in Table 2. Similarly for CdTe, the second configuration is more stable for the 192-atom supercell by −0.060 eV Å−1, and for the 432-atom supercell by −0.044 eV Å−1. This indicates that the α-core dislocation with a DP structure is more stable than the α-core dislocation with an SP structure in both HgTe and CdTe. This DP structure for the α-core 30° partial dislocation is a new structure that has yet to be reported in the open literature for either of these materials.[15, 16] This result is in contrast to the results reported by Kweon et al.[15] for CdTe, where they used hydrogen-terminated clusters as boundary conditions and found a QP structure to be the most stable for both the α-core and β-core 30° partial dislocations. We have also tested QP structures similar to that used by Kweon et al.[15] in both HgTe and CdTe by doubling the supercell in the z-dimension but have found that they are always unstable under periodic boundary conditions and that they always relax to either the SP or DP structure. Similar results were found by Li et al.[16] using periodic boundary conditions who found that the core structures do not reconstruct into dimers, unlike the 30° partial dislocations in Si.[54] However, we also tested these QP structures using hydrogen-terminated clusters in CdTe and found that for the α-core, the QP structure is more stable than the SP structure by −0.042 eV Å−1, and for the β-core, the QP structure is more stable than the SP structure by −0.075 eV Å−1, similar to the results reported by Kweon et al.[15] This indicates that the most stable structure adopted by the core depends on the environment in which the dislocation is embedded.[35] We have chosen to primarily use periodic boundary conditions in this study to avoid artificial interactions between dislocations and pseudo-hydrogen atoms, as used in the cluster method.[38] However, this comes at the cost of having to construct a material with a resultant very high simulated dislocation density that is unrealistic for device-grade material.
| 30° partial dislocations | ||
|---|---|---|
| (b) DP 30° α and SP 30° β minus (a) SP 30° α and SP 30° β | ||
| 192-atom supercell | 432-atom supercell | |
| HgTe | −0.061 eV Å−1 | −0.048 eV Å−1 |
| CdTe | −0.060 eV Å−1 | −0.044 eV Å−1 |
| 90° partial dislocations | ||
| (d) DP 90° β and SP 90° α minus (c) SP 90° β and SP 90° α | ||
| 192-atom supercell | 432-atom supercell | |
| HgTe | 0.011 eV Å−1 | (c) relaxes to (d) |
| CdTe | 0.010 eV Å−1 | (c) relaxes to (d) |
For the 90° partial dislocations in HgTe, the first configuration in Figure 7c is more stable than the second configuration shown in Figure 7d for the 192-atom supercell by only 0.011 eV Å−1. However, for the 432-atom supercell, the first configuration in Figure 7c relaxes to the second configuration shown in Figure 7d. Similarly for CdTe, the first configuration in Figure 8c is more stable than the second configuration shown in Figure 8d for the 192-atom supercell by only 0.010 eV Å−1, but only the second configuration is stable for the 432-atom supercell. This again indicates that the most stable core structure adopted depends on the environment in which the dislocation is embedded.[35] In future studies, it would be useful to simulate larger supercells with a much larger number of atoms using periodic boundary conditions to confirm the most stable core structure for the 90° partial dislocation pairs in both HgTe and CdTe.
The study by Kweon et al.[15] using hydrogen-terminated clusters found that in CdTe, the DP structure for the β-core dislocation is the most stable, similar to our results using periodic boundary conditions in the 432-atom supercell. We have also confirmed that using hydrogen-terminated clusters for CdTe, the DP structure for the β-core dislocation is more stable than the SP structure by −0.057 eV Å−1. It is important to note that the DP structure found here is quite different when compared to the more commonly known DP structure for the 90° partial dislocation in Si.[55] We have tested the Si DP structure in HgTe and CdTe using periodic boundary conditions, as well as in CdTe using hydrogen-terminated clusters, but have always found that it relaxes to the DP structure shown in Figure 8d. Similar to Kweon et al.,[15] only the symmetric SP structure for the α-core was found using either full periodic boundary conditions or hydrogen-terminated clusters.
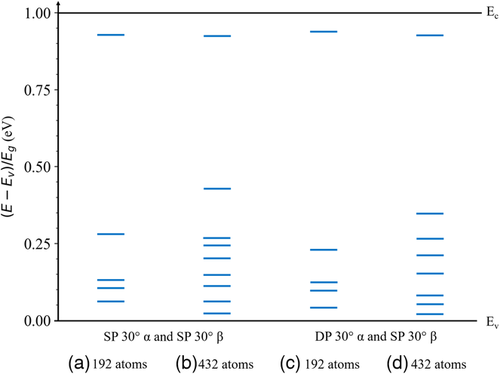
The dislocation-related states within the bandgap for the 30° partial dislocation core structures in CdTe are shown in Figure 9. These states were determined from the peaks of the corresponding total DOS shown in Figure S2, Supporting Information. Since the aim is to observe the dislocation-related states within the bandgap, an analogous study of the DOS for HgTe is not relevant since it has a negative bandgap. Note that the high density of dislocation-related states shown in Figure S2, Supporting Information is due to the high simulated dislocation areal density of ≈2.9 × 1013 cm−2 for the 192-atom supercell and ≈1.3 × 1013 cm−2 for the 432-atom supercell. This is in contrast to practical device-grade materials that have much lower dislocation densities ranging from ≈104 cm−2 for higher quality materials to ≈106 cm−2 for lower quality materials,[5] and thus have a much lower density of dislocation-related states within the energy bandgap. Nevertheless, these simulations allow us to observe the energy positions of the trap states that these dislocations introduce within the bandgap. As shown in Figure 9a, the SP 30° partial dislocation with an α-core and the SP 30° partial dislocation with a β-core in the 192-atom supercell introduce states ≈0.28 Eg above the valence band edge and ≈0.07 below the conduction band edge. These same dislocations in the 432-atom supercell as shown in Figure 9b shows similar behavior but with states ≈0.44 Eg above the valence band edge and ≈0.08 Eg below the conduction band edge. The more stable DP 30° dislocation with an α-core and SP 30° partial dislocation with a β-core in the 192-atom supercell as shown in Figure 9c introduces states ≈0.23 Eg above the valence band edge and states ≈0.06 Eg below the conduction band edge. These same dislocations in the 432-atom supercell as shown in Figure 9d demonstrate similar behavior but introduces states ≈0.35 Eg above the valence band edge and ≈0.07 below the conduction band edge.
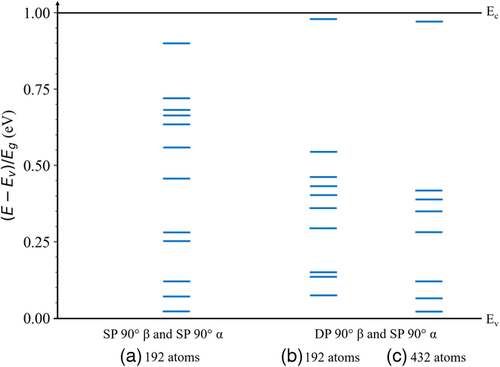
The dislocation-related states within the bandgap for the 90° dislocation core structures in CdTe are shown in Figure 10. The corresponding total DOS is shown in Figure S3, Supporting Information. As shown in Figure 10a, the SP 90° partial dislocation with a β-core and the SP 90° partial dislocation with an α-core in the 192-atom supercell introduce states throughout the bandgap including states close to the middle of the bandgap. The slightly less stable DP 90° partial dislocation with a β-core and the SP 90° partial dislocation with an α-core in the 192-atom supercell as shown in Figure 10b also introduces mid-gap states ≈0.55 Eg above the valence band edge and ≈0.03 Eg below the conduction band edge. The same dislocations in the 432-atom supercell, which are the only stable dislocations found for this supercell, show similar behavior and introduce close to mid-gap states ≈0.42 Eg above the valence band edge and ≈0.04 below the conduction band edge. Thus, on average the 90° partial dislocations tested here are more detrimental to important semiconductor material parameters than the 30° partial dislocations as they introduce more mid-gap states within the bandgap.
3.4 Dislocations in Hg0.7Cd0.3Te
The fully relaxed core structures of the 30° and 90° partial dislocations in Hg0.7Cd0.3Te are shown in Figure 11. Unlike the binary compounds HgTe and CdTe, the β-core dislocations in the alloy Hg0.7Cd0.3Te can have different distributions of Hg and Cd atoms at the core. Thus, different distributions of Hg and Cd atoms at the core of the β-core dislocations have been tested while maintaining the same overall x value of the supercell. The types of stable dislocation pairs found are mostly the same as that of HgTe and CdTe. For all compositions of β-core atoms tested, the 30° partial dislocation pairs in Figure 11a,b are identical in structure to their analogues in HgTe and CdTe. The 90° partial dislocation pair in Figure 11c is also identical to their HgTe and CdTe counterparts for β-core atoms that have either 4 Hg atoms or 4 Cd atoms. There is however a slight variation in coordination numbers for the β-core atoms that have either 1 Hg and 3 Cd atoms, 2 Hg and 2 Cd atoms, and 3 Hg and 1 Cd atoms. For those cases, there is a mixture of 90° β core Hg/Cd atoms with coordination numbers 3 and 4. For all compositions of β-core atoms tested, the 90° partial dislocation pair in Figure 11d mostly resembles the same dislocation pair in HgTe and CdTe. There is of course a slight variation in the coordination numbers between all of them. The cutoff radius used to determine the coordination number is 3.1 Å. Similar to Figure 7, 8, the dislocation structures in Figure 11a,b,d were taken from the 432-atom supercell while the dislocation structures in Figure 11c was taken from the 192-atom supercell. Moreover, for the β-core dislocations, only the most stable core structures containing only Hg atoms are shown for brevity. The dislocation structures in Figure 11a,b from the 192- and 432-atom supercells are identical. There is, however, a slight variation in the coordination numbers of atoms between the DP 90° β dislocations from the 192- and 432-atom supercells.
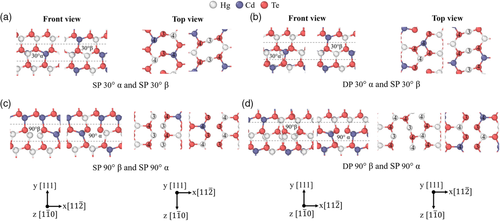
The relative energies between the different distribution of atoms for a particular core type and different core structure types for the 30° partial dislocations are summarized in Table 3. For the first configuration as shown in Figure 11a, the β-core with 2 Cd atoms is the least stable followed by the β-core with 1 Hg and 1 Cd atoms and the β-core with 2 Hg atoms in the 192-atom supercell. A similar trend was observed for the 432-atom supercell. The energies in Table 3 were given relative to the β-core with 2 Cd atoms for the first configuration. The β-core with 1 Hg and 1 Cd atom and the β-core with 2 Hg atoms are more stable by 0.020–0.024 and 0.039–0.048 eV Å−1, respectively. For the second configuration as shown in Figure 11b, the same trend was also observed in both the 192-atom and 432-atom supercells. Here, the relative energies are 0.040–0.059, 0.064–0.079, and 0.087–0.097 eV Å−1 for the β-core with 2 Cd atoms, 1 Hg and 1 Cd atom, and 2 Hg atoms, respectively. For both the 192-atom and 432-atom supercells, the second configuration is always more stable than the first configuration regardless of the type of atom distribution at the β-core. The relative energies are 0.040–0.059, 0.040–0.059, and 0.039–0.058 eV Å−1 for the β-core with 2 Cd atoms, 1 Hg and 1 Cd atoms, and 2 Hg atoms, respectively. Similar to HgTe and CdTe, this indicates that the α-core dislocation with a DP structure is more stable than the α-core dislocation with an SP structure. The lowest energy partial dislocation pair for both the 192-atom and 432-atom supercells was found to be the second configuration with the β-core with 2 Hg atoms.
| 30° partial dislocations | |||
|---|---|---|---|
| 192-atom supercell | |||
| β-core atoms | (a) SP 30° α and SP 30° β | (b) DP 30° α and SP 30° β | (b) minus (a) |
| 2 Cd | 0.000 eV Å−1 | −0.059 eV Å−1 | −0.059 eV Å−1 |
| 1 Hg 1 Cd | −0.020 eV Å−1 | −0.079 eV Å−1 | −0.059 eV Å−1 |
| 2 Hg | −0.039 eV Å−1 | −0.097 eV Å−1 | −0.058 eV Å−1 |
| 432-atom supercell | |||
| (a) SP 30° α and SP 30° β | (b) DP 30° α and SP 30° β | (b) minus (a) | |
| 2 Cd | 0.000 eV Å−1 | −0.040 eV Å−1 | −0.040 eV Å−1 |
| 1 Hg 1 Cd | −0.024 eV Å−1 | −0.064 eV Å−1 | −0.040 eV Å−1 |
| 2 Hg | −0.048 eV Å−1 | −0.087 eV Å−1 | −0.039 eV Å−1 |
The relative energies between the different distribution of atoms for a particular core type and different core structure types for the 90° partial dislocations are summarized in Table 4. For the first configuration, the β-core with 4 Cd atoms is the least stable followed by the β-core with 1 Hg and 3 Cd atoms, 2 Hg and 2 Cd atoms, 3 Hg and 1 Cd atoms, and 4 Hg atoms in the 192-atom supercell. For the 432-atom supercell, only the β-core with 4 Cd atoms was stable for the first configuration while the others relaxed to the second configuration, as shown in Figure 11d. The energies in Table 4 are given relative to the β-core with 4 Cd atoms for the first configuration. The β-core with 1 Hg and 3 Cd, 2 Hg and 2 Cd, 3 Hg and 1 Cd, and 4 Hg atoms in the 192-atom supercell is more stable by 0.013, 0.031, 0.043, and 0.049 eV Å−1, respectively.
| 90° partial dislocations | |||
|---|---|---|---|
| 192-atom supercell | |||
| β-core atoms | (c) SP 90° β and SP 90° α | (d) DP 90° β and SP 90° α | (d) minus (c) |
| 4 Cd | 0.000 eV Å−1 | 0.002 eV Å−1 | 0.002 eV Å−1 |
| 1 Hg 3 Cd | −0.013 eV Å−1 | −0.022 eV Å−1 | −0.009 eV Å−1 |
| 2 Hg 2 Cd | −0.031 eV Å−1 | −0.033 eV Å−1 | −0.002 eV Å−1 |
| 3 Hg 1 Cd | −0.043 eV Å−1 | −0.051 eV Å−1 | −0.008 eV Å−1 |
| 4 Hg | −0.049 eV Å−1 | −0.051 eV Å−1 | −0.001 eV Å−1 |
| 432-atom supercell | |||
| (c) SP 90° β and SP 90° α | (d) DP 90° β and SP 90° α | (d) minus (c) | |
| 4 Cd | 0.000 eV Å−1 | −0.008 eV Å−1 | −0.008 eV Å−1 |
| 1 Hg 3 Cd | (c) relaxes to (d) | −0.072 eV Å−1 | – |
| 2 Hg 2 Cd | (c) relaxes to (d) | −0.082 eV Å−1 | – |
| 3 Hg 1 Cd | (c) relaxes to (d) | −0.101 eV Å−1 | – |
| 4 Hg | (c) relaxes to (d) | −0.097 eV Å−1 | – |
For the second configuration, as shown in Figure 11b, a similar trend was also observed in both the 192-atom and 432-atom supercells. Here, the relative energies are 0.002–0.008, 0.022–0.072, 0.033–0.082, 0.051–0.101, and 0.051–0.097 eV Å−1 for the β-core with 4 Cd, 1 Hg and 3 Cd, 2 Hg and 2 Cd, 3 Hg and 1 Cd, and 4 Hg atoms, respectively. For the 192-atom supercell, the first configuration is more stable than the second configuration for the β-core with 4 Cd atoms, but only by 0.002 eV Å−1. The second configuration is more stable for the other core distributions by low energy values of 0.009, 0.002, 0.008, and 0.001 eV Å−1 for the β-core with 1 Hg and 3 Cd, 2 Hg and 2 Cd, 3 Hg and 1 Cd, and 4 Hg atoms, respectively. Similar to HgTe and CdTe for the 192-atom supercell, the energetics of the β-core dislocation with a DP structure is very similar to the β-core dislocation with an SP structure. This is also the case for the β-core dislocation with 4 Cd atoms in the 432-atom supercell, whereas for the other β-core dislocations only the second configuration is stable. The lowest energy partial dislocation pair for both the first and second configuration in the 192-atom supercell was found to be the β-core with either 3 Hg and 1 Cd atoms or 4 Hg atoms. Likewise, the lowest energy partial dislocation pair for the second configuration in the 432-atom supercell was found to be the β-core with 3 Hg and 1 Cd atoms. The reduction in energy for both the 30° and 90° partial dislocations with an increase in Hg core atoms for the same x value implies that it is energetically favorable for Hg atoms to segregate to these dislocation cores. This may be a possible explanation for the enhanced interdiffusion of HgTe/CdTe superlattices in regions around dislocations.[5]
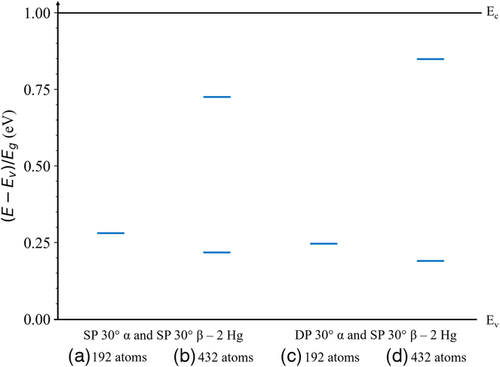
The dislocation-related states within the bandgap for the 30° partial dislocation core structures in Hg0.7Cd0.3Te are shown in Figure 12. The corresponding total DOS is shown in Figure S4, Supporting Information. These states correspond to the most stable partial dislocation pairs in which the β-core dislocations contain only Hg atoms. The results corresponding to other core atom distributions are presented in Figure S6, Supporting Information. As shown in Figure 12a, the SP 30° partial dislocation with an α-core and the SP 30° partial dislocation with a β-core in the 192-atom supercell introduce states ≈0.27 Eg above the valence band edge. These same dislocations in the 432-atom supercell as shown in Figure 12b introduces similar states ≈0.22 Eg above the valence band edge and ≈0.28 Eg below the conduction band edge. The more stable DP 30° dislocation with an α-core and SP 30° partial dislocation with a β-core in the 192-atom supercell as shown in Figure 12c introduces states ≈0.24 Eg above the valence band edge. These same dislocations in the 432-atom supercell as shown in Figure 12d has similar behavior and introduces states ≈0.19 Eg above the valence band edge and ≈0.16 Eg below the conduction band edge.
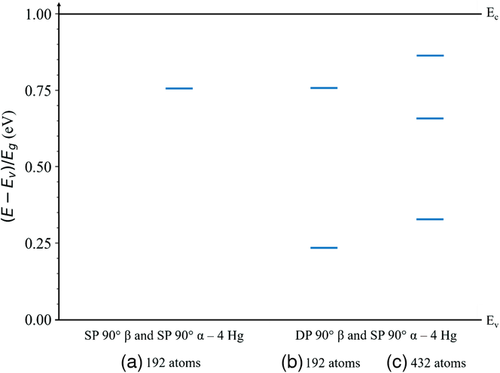
The dislocation-related states within the bandgap for the 90° dislocation core structures in Hg0.7Cd0.3Te are shown in Figure 13. The corresponding total DOS is shown in Figure S5, Supporting Information. These states correspond to the most stable partial dislocation pairs with β-core dislocations containing only Hg atoms. The results corresponding to other core atom distributions are presented in Figure S7 and S8, Supporting Information. As shown in Figure 13a, the SP 90° partial dislocation with a β-core and the SP 90° partial dislocation with an α-core in the 192-atom supercell introduces states ≈0.25 Eg below the conduction band edge. The DP 90° partial dislocation with a β-core and the SP 90° partial dislocation with an α-core in the 192-atom supercell as shown in Figure 13b introduces states ≈0.23 Eg above the valence band edge and ≈0.24 Eg below the conduction band edge. The same dislocations in the 432-atom supercell in Figure 13c, which are the only stable dislocations found for this supercell, introduce states ≈0.34 Eg above the valence band edge and ≈0.34 Eg below the conduction band edge. Thus, similar to CdTe, on average the 90° partial dislocations tested here appear to be more detrimental than the 30° partial dislocations since they introduce more states closer to the middle of the bandgap, though the difference is not as pronounced as compared to CdTe. For the two simulation sizes tested with different areal dislocation densities in both CdTe and Hg0.7Cd0.3Te, the dislocation-related states generally lie between 30 and 40 states eV−1. It is necessary to undertake simulation studies with much larger simulation cells containing many more atoms and thus lower areal dislocation densities to assess whether there is a correlation between areal dislocation density and the density of dislocation-related states. Assessing the net atomic charges on the dislocation core atoms would also need to be determined to provide information on whether these dislocation-related states are donors or acceptors.
4 Summary and Conclusions
In summary, we have used DFT simulations to obtain certain properties of the 30° and 90° partial dislocations in HgTe, CdTe, and Hg0.7Cd0.3Te using full periodic boundary conditions. For the 30° partial dislocations, two stable pair dislocation pairs were found in all three of these materials: a) an α-core dislocation with an SP structure and a β-core dislocation with an SP structure and b) an α-core dislocation with a DP structure and a β-core dislocation with an SP structure. For both the 192 and 432-atom supercells, (b) was found to be more stable, indicating that the 30° partial α-core dislocation with the DP structure is more stable than the SP structure. This DP structure is a new structure that has yet to be reported in the open literature. For the 90° partial dislocations, two stable pair dislocation pairs were also found in HgTe, CdTe and Hg1−xCdxTe: c) a β-core dislocation with a symmetric SP structure and an α-core dislocation with a symmetric SP structure and d) a β-core dislocation with a DP structure and an α-core dislocation with a symmetric SP structure. For the 192-atom supercell, the energetics for (c) and (d) were found to be very similar, while for the 432-atom supercell, (d) was found to be the most stable. To confirm the most stable structure, it is necessary to undertake simulation studies with much larger simulation cells containing many more atoms.
For both the 30° and 90° partial dislocations in Hg0.7Cd0.3Te, the lowest energy dislocation pairs are the ones in which the β-cores have either 3 Hg and 1 Cd atom, or 4 Hg atoms. This implies that Hg atoms prefer to segregate to these dislocation cores. Finally, for both CdTe and Hg0.7Cd0.3Te, the 90° partial dislocations are more detrimental to optoelectronic material properties than the 30° partial dislocations since they introduce more deep states within the bandgap that is close to mid-gap. This difference is more pronounced in CdTe compared to Hg0.7Cd0.3Te. For the two simulation sizes tested with different areal dislocation densities, the density of the dislocation-related states is approximately the same. Larger simulation cells containing many more atoms and thus lower areal dislocation densities would need to be undertaken to assess whether there is a correlation between areal dislocation density and the density of dislocation-related states. To determine whether these dislocation-related states are donors or acceptors, the net atomic charges on the dislocation core atoms would also need to be assessed. It is also the objective of future studies to study dislocations for different compositions, x such as Hg0.6Cd0.4Te used for short-wave infrared (SWIR) applications and Hg0.8Cd0.2Te used for LWIR applications.
Acknowledgements
This work was supported by computing resources provided by the Pawsey Supercomputing Centre located in Kensington, Western Australia. The authors also wish to acknowledge the Australian Research Council (LP170100088, DP170104555, DP200103188, and CE200100010) and the WA Node of the Australian National Fabrication Facility (ANFF) for financial support of this project.
Open access publishing facilitated by The University of Western Australia, as part of the Wiley - The University of Western Australia agreement via the Council of Australian University Librarians.
Conflict of Interest
The authors declare no conflict of interest.
Open Research
Data Availability Statement
The data that support the findings of this study are available from the corresponding author upon reasonable request.


