Structural insights into peptidoglycan glycosidase EtgA binding to the inner rod protein EscI of the type III secretion system via a designed EscI-EtgA fusion protein
Reviewing Editor: Zengyi Chang
Abstract
Bacteria express lytic enzymes such as glycosidases, which have potentially self-destructive peptidoglycan (PG)-degrading activity and, therefore, require careful regulation in bacteria. The PG glycosidase EtgA is regulated by localization to the assembling type III secretion system (T3SS), generating a hole in the PG layer for the T3SS to reach the outer membrane. The EtgA localization was found to be mediated via EtgA interacting with the T3SS inner rod protein EscI. To gain structural insights into the EtgA recognition of EscI, we determined the 2.01 Å resolution structure of an EscI (51–87)-linker-EtgA fusion protein designed based on AlphaFold2 predictions. The structure revealed EscI residues 72–87 forming an α-helix interacting with the backside of EtgA, distant from the active site. EscI residues 56–71 also were found to interact with EtgA, with these residues stretching across the EtgA surface. The ability of the EscI to interact with EtgA was also probed using an EscI peptide. The EscI peptide comprising residues 66–87, slightly larger than the observed EscI α-helix, was shown to bind to EtgA using microscale thermophoresis and thermal shift differential scanning fluorimetry. The EscI peptide also had a two-fold activity-enhancing effect on EtgA, whereas the EscI-EtgA fusion protein enhanced activity over four-fold compared to EtgA. Our studies suggest that EtgA regulation by EscI could be trifold involving protein localization, protein activation, and protein stabilization components. Analysis of the sequence conservation of the EscI EtgA interface residues suggested a possible conservation of such regulation for related proteins from different bacteria.
1 INTRODUCTION
Bacteria express lytic enzymes that can degrade part of the bacterial peptidoglycan (PG) cell wall. A subset of lytic enzymes is PG glycosidases, which cleave the saccharide bonds in PG strands. Such glycosidases are needed for nascent PG release from the attached membrane-embedded lipid II, daughter cell separation, debris digestion, and remodeling for trans-envelope machinery such as flagella and secretion systems (Weaver et al., 2023). There are three types of PG glycosidases: muramidases, lytic transglycosylases (LTs), and N-acetylglucosaminidases (Do et al., 2020). Glycosylases have a potentially self-destructive PG-degrading activity if it is not controlled well, as the PG layer is vital for bacteria by providing it strength and shape. One of the modes of regulation of glycosylases is via protein–protein interactions to localize and thus restrict activity to only where it is needed (Do et al., 2020).
The type III secretion system (T3SS) of enteropathogenic Escherichia coli uses the glycosidase EtgA to locally degrade PG to allow the secretion system to function efficiently (Garcia-Gomez et al., 2011). To direct EtgA where its activity is needed to form a hole in the PG layer for the T3SS, EtgA was found to interact with the inner rod subunit EscI of the T3SS (Burkinshaw et al., 2015; Creasey et al., 2003). EtgA shares active site similarities with lysozyme, suggesting that it has muramidase activity but also shares structural similarities with LTs (Burkinshaw et al., 2015). Muramidases and LTs carry out the same reaction by cleaving PG between MurNAc and GlcNAc saccharides, yet muramidases are hydrolytic, thus involving a water molecule in the reaction. In contrast, LTs are not hydrolytic as they catalyze an additional step, forming an internal bond in the terminal saccharide, thereby generating a 1,6-anhydro MurNAc termini (Thunnissen et al., 1995).
How EtgA structurally binds to EscI to facilitate its localization near the PG layer is not known and is the focus of our studies. Previously, part of the EtgA structure (residues 18–105) was determined by protein crystallography, revealing structural similarities to Slt70, a donut-shaped soluble LT from E. coli, and lysozyme, a muramidase present in, for example, human tears and hen egg-white (Burkinshaw et al., 2015). The same group also found that EscI residues 24–137 bind EtgA, leading to a modest 7.5-fold increase in EtgA activity and an 8°C increase in EtgA protein aggregation stability; however, since these studies were carried out by co-expression without analysis of the final complex, it is possible that the EscI fragment influenced EtgA biogenesis or prevented EtgA destabilization (Burkinshaw et al., 2015). The genes encoding EtgA and EscI, together with other T3SS genes, are within the Lee pathogenicity island locus and are subjected to complex regulation for E. coli pathogenesis (Furniss & Clements, 2018; Serapio-Palacios & Finlay, 2020).
EtgA is a well-conserved protein/fold in different bacterial pathogens, including the T3SS homologs Salmonella enterica IagB, Shigella flexneri IpgF, Yersinia enterocolitica YsaH, the T2SS Burkholderia pseudomallei OrfC, bundle-forming pilus E. coli BfpH, and type IVB pilus S. enterica serovar Typhi, Q9ZIU8, PilT (Burkinshaw et al., 2015). Understanding EtgA regulation could thus also yield important insights regarding the regulation of these homologs. The importance of this knowledge is underscored by the fact that this class of proteins is commonly involved in aiding nanomachines, such as secretion systems, which are critical for pathogenesis (Ruano-Gallego et al., 2021).
To investigate how EtgA recognizes the T3SS inner rod subunit EscI, we carried out crystallographic, biophysical, and enzymatic studies guided by AlphaFold2 predictions of the interaction between these two proteins. The insights of EtgA EscI recognition are crucial for understanding its role in T3SS biogenesis and how EtgA activity is controlled to prevent it from harming the cell. Our studies could also contribute to an enhanced understanding of related enzymes and related inner rod subunits in other bacteria.
2 RESULTS
2.1 Fusion protein design based on AlphaFold2 predictions of EscI EtgA interactions
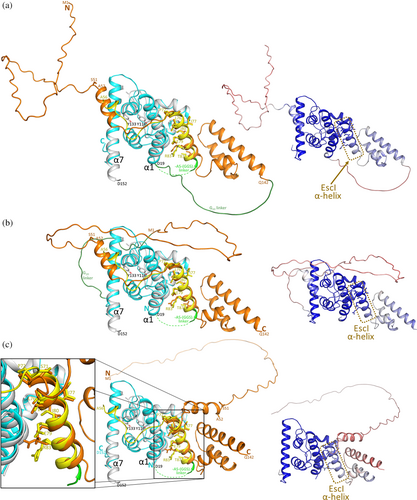
To gain preliminary insights into how EtgA and EscI interact, we used AlphaFold2 (Jumper et al., 2021) to predict their interaction. We anticipated that such a prediction could be used to design a fusion protein construct that would allow experimental characterization of this EtgA EscI interaction. We carried out the AlphaFold2 prediction in triplicate to increase the rigor of such a prediction by predicting the structures of the fusion protein EscI-G20-EtgA (Figure 1a), the fusion protein EtgA-G20-EscI (Figure 1b), and EscI and EtgA as individual proteins (Figure 1c). For each of the predictions, the leader sequence of EtgA was removed so only residues 18–152 were included plus an additional buffer residue, A17. AlphaFold2's estimated confidence level of each of these three predictions is shown by a color-ramped molecular figure to the right of the predictions. The first two predictions are fusion proteins with a 20-residue glycine linker between the two protein partners to allow a sufficiently large flexible linker between their linked termini if they are not close in the predicted structure (i.e., maximally 20 × 4 = 80 Å, assuming an average Cα-Cα distance of 4.0 Å). The three predictions showed agreement in the helical region of EscI residues P72-T87 interacting with EtgA (Figure 1). The two fusion protein structure predictions suggested that EscI makes additional interactions with EtgA via its residues N-terminal to the EscI helix 72–87 up to the helical region that starts at EscI residue A52 (Figure 1a,b); the third AlphaFold2 prediction did not show this (Figure 1c). The other regions of EscI did not seem to be predicted to significantly interact with EtgA (Figure 1). Therefore, for our fusion protein design we limited out EscI region of interest to residues 52–87 yet extended it by one residue on each end as a safety buffer such that it encompasses residues S51-M88. However, upon inspection of the hydrophobic EscI residue M88, which is predicted to point to the solvent, we changed that residue to an Ala. This change to Ala is aimed at maintaining its propensity to form an α-helical region (Pace & Scholtz, 1998) at the C-terminus of this helix yet avoid having an exposed hydrophobic residue that could cause aggregation issues. To design the fusion protein linker and at which position to insert it, we inspected the positions of the N- and C-termini of the protein partners EtgA and EscI in the fusion protein predictions and observed that residues EscI 88 (now an Ala) and EtgA S18 were situated at a relatively short ~22 Å distance. Such a separation would require a minimum linker length of six residues to span this distance, considering the average Cα-Cα distance of 4.0 Å; an additional four residues were added to the linker to allow some slack to yield a linker length of 10 residues. Common linkers used in fusion protein designs are Gly/Ser linkers (Chen et al., 2013); we therefore used a 10-residue Gly/Ser-containing linker (S-(GGS)3) to connect the C-terminus of EscI residues 51–88 (with 88 changed to an Ala) and the N-terminus of EtgA residues 18–152. This EscI-EtgA fusion protein could be crystallized for structure determination purposes, and its structure will be described next.
2.2 Analysis of the EscI-EtgA fusion protein crystal structure
The 2.01 Å resolution crystal structure of the EscI-EtgA fusion protein is comprised of EtgA residues 19–152 residues, with the following residues being too disordered to be modeled: 18, 42–52, and 119–124 (Figures 1-3 with EtgA colored gray, residues corresponding to EscI in yellow, and linker residues in green). Regarding the EscI portion of the fusion protein, clear unbiased omit electron density was present for EscI residues 56–87 (Figure 3d). Also visible in the electron density are three of the subsequent linker residues ASG; these residues are also included in the refinement. The active site of EtgA contains the residues often conserved in related muramidases and/or LTs: D60, Q65, Y116, N117, and Y133 (Figures 2 and 3).
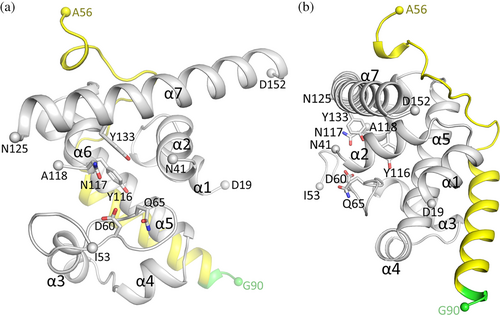
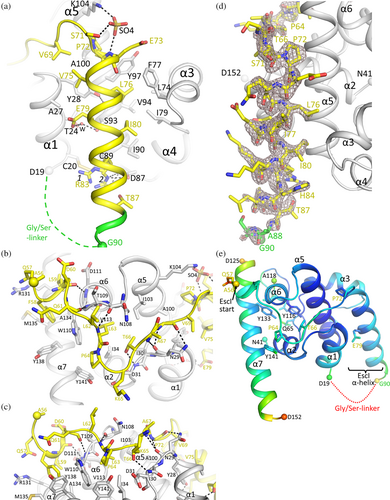
EscI residues 56–87 interact with EtgA on the backside of the enzyme, distant from the active site (Figures 2 and 3). A significant portion of the included EscI segment adopts a helical conformation (i.e., residues 72–87) interacting with a groove formed by EtgA helices α1, α3, and α5 (Figure 3a,d). The section of EscI preceding this α-helix wraps around part of the surface EtgA in a direction roughly perpendicular to the following EscI helix (Figure 3b,c). The EscI density of the fusion protein indicates that the EscI section of the fusion protein is well-defined (Figure 3d). This is also evident from EscI's refined temperature factors, which are comparable to those of EtgA (Figure 3e), suggesting EscI is well ordered and therefore behaves as if it is part of the architecture of the EtgA enzyme. The α-helix of EscI interacting with EtgA involves mostly hydrophobic interactions made by EscI residues P72, V75, L76, I80, and hydrophobic atoms of E73, E79, and R83 (Figure 3a). In addition, one of the conformations of EscI R83 makes a salt-bridge interaction with EtgA D87 whereas EscI E79 makes a water-mediated interaction with EtgA residues T24 and S93 (Figure 3a). EscI residues 56–71 also contribute to the EtgA EscI interface making several hydrogen bonds and many van der Waals/hydrophobic interactions with EtgA (Figure 3b,c).
In addition to the number of interactions, the overall buried surface of EscI binding to EtgA is significant. EscI 56–87 interacting with EtgA buries 2685 Å2 of solvent-accessible surface (as calculated using CCP4 AreaIMol; Agirre et al., 2023); the EscI α-helix 72–87 or the slightly larger section 66–87 bury only 1203 and 1692 Å2 solvent accessible surface, respectively, when interacting with EtgA.
The position of the crystallographically observed EscI α-helix bound to EtgA closely matches the predictions made by AlphaFold2 (Figure 1). These predictions included virtual fusion proteins of EscI-G20-EtgA (Figure 1a; contains a linker with 20 glycine residues), EtgA-G20-EscI (Figure 1b), and EscI and EtgA as individual proteins (Figure 1c). AlphaFold2's assessments of confidence in predicting that local EscI EtgA protein–protein interaction region was also relatively high as shown by the color ramping in Figure 1. Note that the prediction of the EscI region N-terminal to the α-helix 72–87 in both virtual fusion proteins (Figure 1a,b) also roughly matches that of the crystal structure with EscI residue V69 at an identical position and similar positions for residues L63, P64, and T66.
2.3 Comparison with EtgA D60N structure
The structure of the EscI-EtgA fusion protein allows comparison to the previously determined EtgA D60N structure (Protein Data Bank [PDB] ID 4XP8 (Burkinshaw et al., 2015); Figure 4a). The latter structure was obtained via crystallization of EtgA (19–152) D60N in the presence of EscI (24–137), to stabilize EtgA, and chymotrypsin to facilitate limited proteolysis that can sometimes aid in crystallization (Burkinshaw et al., 2015). The resulting structure revealed only EtgA residues 19–105 (Figure 4b); no part of EscI was observed and was likely absent in the crystal. Superimposition of the EscI-EtgA fusion protein with EtgA D60N yielded a root-mean-square-deviation (r.m.s.d.) of 0.69 Å for 71 aligned residues, indicating the structures are very similar (Figure 4a).
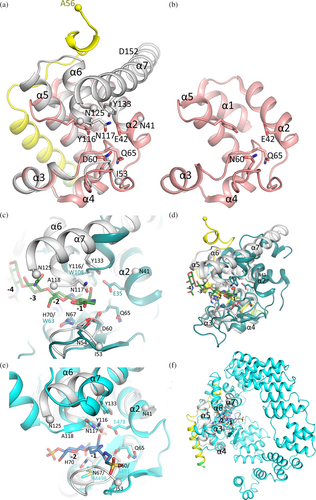
Notable differences between the EscI-EtgA fusion protein and the EtgA D60N structures are that the latter does not contain helices α6 and α7 (Figure 4a,b). Also, the C-terminal end of helix α5 adopts a different conformation in EtgA D60N positioning a Y105 (which in the wt sequence is S105) roughly where Y116 is in the fusion protein structure. These differences could be due to the limited proteolysis step, which might have cleaved off a C-terminal portion of EtgA D60N. Alternatively, the presence of the fusion partner EscI could have stabilized EtgA helices α5, α6, and α7 as these helices interact with EscI residues 56–71 via numerous hydrogen-bonding and hydrophobic interactions (Figure 3b,c). Another difference is that the EscI-EtgA fusion protein structure does not include residues 42–52, which includes the conserved catalytic residues E42; this region is present in the EtgA D60N structure (Figure 4a,b). This structural variance could perhaps be due to differences in pH of the crystallization condition affecting the protonation state of E42 and thus its interactions (pH of 4.5 and 7.3–7.5 for the EscI-EtgA fusion protein and EtgA D60N (Burkinshaw et al., 2015), respectively). Alternatively, these above-mentioned structural differences could represent the allosteric effects of EscI modulating the activity of EtgA.
Overall, the structural analysis suggests that the presence of EscI in the EscI-EtgA fusion protein structure yielded a larger portion of EtgA being ordered and refined compared to the EtgA D60N structure. The extensive interactions that EscI makes with EtgA, involving both the EscI α-helix and preceding region, could explain why previously EscI was needed to stabilize EtgA to protect it from precipitating (Burkinshaw et al., 2015).
2.4 Comparison with muramidases and LTs
As noted previously, the EtgA structure bears a strong resemblance to lysozyme (Burkinshaw et al., 2015). Residue D60 is a catalytically important residue as the D60N change in EtgA was previously shown to decrease EtgA activity and decrease T3SS-mediated secretion of proteins (Burkinshaw et al., 2015). This D60 residue is equivalent to lysozyme catalytic residue D52 (Figure 4c). The superimposition of the EscI-EtgA fusion protein and lysozyme complexed with 4-O-β-tri-N-acetylchitotriosyl moranoline (PDB ID 4HP0; Ogata et al., 2013) shows substantial structural similarity (Figure 4c,d). The superposition yielded a r.m.s.d. of 1.5 Å for 43 Cα atoms (EtgA residues 21–22, 53–69, 70, 73–74, 79–86, and 88–100 were superimposed onto lysozyme residues 12–13, 45–61, 63, 75–76, 78–85, and 88–100, respectively, as calculated using CCP4 Superpose; Agirre et al., 2023). The bottom part of the active site (i.e., the region containing conserved residues N54, D60, Q65, and N67) superimposes well; the α2 helix of EtgA that includes the catalytic glutamate E42 (E35 in lysozyme) also superimposes well (Figure 4c). The PG mimicking saccharide complexed to lysozyme fits well in the EtgA active site based on the superimposition (Figure 4c).
The EscI-EtgA fusion protein is also similar to E. coli soluble LT Slt70, as previously noted (Burkinshaw et al., 2015). Superimposition of the EscI-EtgA fusion protein with Slt70 complexed to the inhibitor bulgecin A (PDB ID 1SLY; Thunnissen et al., 1995) yielded a r.m.s.d. of 1.6 Å for 93 Cα atoms (EtgA residues 19–41, 59–71, 80–85, 87–109, 111–118, and 129–148 were superimposed onto Slt70 residues 455–477, 490–502, 516–521, 522–544, 547–554, and 583–602, respectively). This superimposition shows that the structural similarity is now more substantial in the upper part of the active site (Figure 4e,f). This region includes the α2 helix of EtgA and the α6 and α7 helices, which all superimpose well. EtgA active site residues N117 and Y133 and the catalytic glutamate (E478 in Slt70) are conserved. The bottom part of the active site is less conserved, with only Q65 conserved, whereas D60 and N67 are an A and M residue, respectively, in Slt70 (Figure 4e).
These structural comparisons facilitate a structure-based sequence alignment of EtgA, lysozyme, Slt70 and two LTs for which structures have also been determined: E. coli MltC (PDB ID 4CHX; Artola-Recolons et al., 2014) and Pseudomonas aeruginosa MltF (PDB ID 4OXV) (Figure 5a). As evident from the superimpositions, the sequence alignment shows that EtgA is a “hybrid” enzyme as it shares some conservation of catalytic residues of the muramidase lysozyme and also with the three aligned LTs (Figure 5a). One catalytic residue that is fully conserved is EtgA E42.
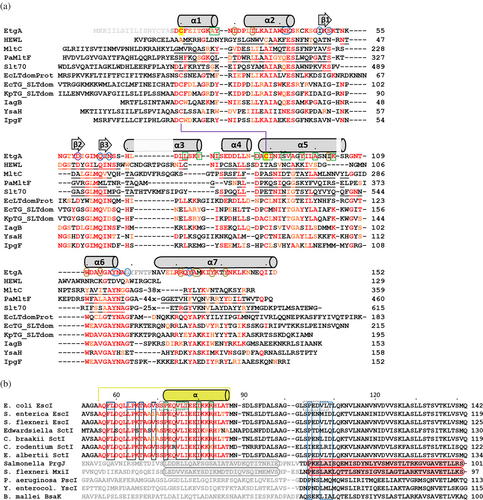
To probe the sequence conservation of more closely related EtgA homologs, we extended the sequence alignment to include AlphaFold2-predicted structures that have higher structural similarity to EtgA than the more distantly related protein mentioned above; this search was carried out using Distance matrix alignment (DALI) (Holm, 2022). Such an analysis could yield insights into the conservation of EtgA active site residues and EtgA residues found interacting with EscI and thus whether our structural findings could extend beyond EtgA. These additional sequences include the E. coli LT domain protein, E. coli transglycosylase (TG) SLT domain-containing protein, and Klebsiella pneumoniae TG SLT domain-containing protein (Figure 5a). Furthermore, we also included sequences of previously noted homologs of EtgA, (Burkinshaw et al., 2015; Lerminiaux et al., 2020) which include Salmonella enterica IagB, Y. enterocolitica YsaH, and S. flexneri IpgF (Figure 5a). The sequence identity with EtgA for these latter six proteins is 34%, 38%, 42%, 41%, 34%, and 34%, respectively. The alignment of these six EtgA-related sequences shows that the active site residues E42, Q65, and Y116 are fully conserved (Figure 5a). Almost fully conserved are active site residues N54, D60, N67, N117, and G119. The sequence conservation at the EtgA interface with EscI will be discussed next.
2.5 Probing the conservation of the EscI EtgA interface residues
The EtgA interactions with the EscI α-helix are mostly hydrophobic (Figure 3a). EtgA interface residues L74 and C89 are fully conserved in the set of six homologs (Figure 5a; bottom six sequences); the latter is part of the also conserved C20-C89 disulfide bond. Residues at equivalent positions of EtgA I79, I90, and V94 are moderately conserved and would be able to make identical or similar hydrophobic interactions (with the aliphatic parts of their side chains). Also, the aromatic nature of EtgA Y28 is conserved. Regarding the EtgA interactions with the EscI residues 56–71, residues W110 and A134 are fully conserved (Figures 3b and 5a). Residues I30, I34, and V113 are relatively conserved and only vary as the similar L or V. The hydrophobic nature of I103 and Y138 are also conserved. The relative conservation of the hydrophobic nature of many EtgA residues found interacting with EscI suggests the possibility that the related six proteins might interact with their respective T3SS inner rod protein partners similarly.
The EscI residues interacting with EtgA are fully conserved in the EscI and SctI family members except for V69, substituted twice by an I residue, and R83, substituted once by a K residue, both minor differences (Figure 5b). The sequence similarity of EscI with the more distant homologs PrgJ, MxiI, PscI, YscI, and BsaK is very weak in the region where EscI was observed to interact with EtgA (Figure 5b). Nevertheless, in the cryo-EM structures of PrgJ and MxiI as part of T3SS complexes, this region also adopts a helix (Figure 5b). There is some conservation of hydrophobicity for EtgA-interacting EscI residues V69, P72, I76, and I80 (Figure 5b) suggesting this region could similarly interact with their corresponding EtgA-like partner. We did observe that EscI sequence motif SPEQVL found to interact with EtgA is almost identically present a second time in the EtgA sequence (i.e., SPEDVL) located more toward the C-terminus (Figure 5b). Sequence conservation in this region of among all 12 EscI-related sequences in Figure 5b is much stronger, but it is too speculative to suggest that EtgA could also interact with this region.
2.6 Probing EscI binding to EtgA using differential scanning fluorimetry and microscale thermophoresis
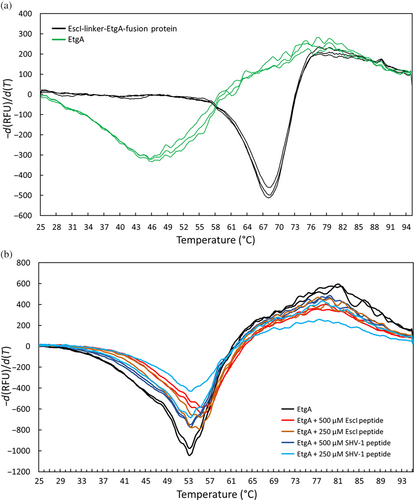
The midpoint unfolding temperatures (Tm) of 8 μM EtgA and the EscI-EtgA fusion protein were determined using differential scanning fluorimetry (DSF) and found to be 46 ± 0 and 68 ± 0°C, respectively (Figure 6a). This difference corresponds to a 22°C increase in Tm of EtgA when part of EscI is present as a fusion protein. The EtgA DSF curves also displayed much lower signal-to-noise compared to the EscI-EtgA fusion protein, which is likely a result of poor stability and a tendency of EtgA to aggregate by itself, as also noted previously (Burkinshaw et al., 2015). Higher EtgA concentrations (20 μM) were used to increase the DSF signal to probe the effect of EscI (66–87) peptide and control peptide on the Tm of EtgA. The Tm of EtgA increased from 53 ± 0 to 55 ± 0 and 55 ± 0°C in the presence of 250 and 500 μM EscI peptide, respectively. The EtgA Tm thus increased 2°C in both instances when in the presence of EscI peptide at these concentrations, suggesting the peptide is binding to EtgA. The control peptide at 250 and 500 μM yielded Tm values of 53 ± 0 and 53 ± 0°C, respectively, showing no increase in Tm compared to EtgA by itself, indicating no binding event. Note that the increase in EtgA protein concentration from 8 to 20 μM by itself also increased the Tm (Figure 6a,b), which could be due to the unstable nature of EtgA; a higher protein concentration might lead to, percentage-wise, more protein being intact during the DSF experiment instead of being aggregated. Alternatively, the altered ratio of protein to SYPRO orange dye could also affect the Tm.
The microscale thermophoresis (MST) measurements yielded a Kd of 385 ± 35 μM for EscI peptide binding to EtgA; the control peptide did not yield a Kd, indicating the latter peptide had, as expected, little or no affinity for EtgA (Figure 7). The MST experiments agree with the DSF data showing that the EscI (66–87) peptide binds to EtgA.

2.7 Activity measurements of EtgA in the presence or absence of parts of EscI
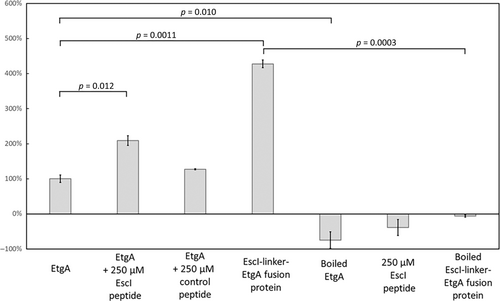
The addition of 250 μM EscI peptide increased the EnzCheck activity to 209 ± 14% of wt EtgA activity, a 2.1-fold increase (Figure 8). In contrast, the presence of the 250 μM control peptide only increased the activity to 127 ± 2% (a slight 27% increase probably a result of a-specific aggregation prevention). When a longer section of EscI was included as part of a fusion protein with EtgA, the measured activity was 427 ± 11% of apo wt EtgA activity, a 4.3-fold increase. The negative control experiments of inactivating the protein samples by boiling or leaving out the protein and just having only 250 μM EscI peptide present yielded no significant activity (Figure 8). These latter control experiments indicate that only correctly folded EtgA yields activity in this assay and that EtgA once is denatured, cannot refold readily to yield active protein.
3 DISCUSSION
Our investigation into EtgA recognition of the T3SS inner rod subunit EscI to localize EtgA's lytic activity has yielded key insights. The crystal structure of the EscI-linker-EtgA fusion protein (Figures 2 and 3), designed guided by AlphaFold2 predictions (Figure 1), revealed EscI residues 72–87 forming a long α-helix interacting with the backside of EtgA distant from the active site via mostly hydrophobic interactions (involving EtgA helices α1, α3, and α5). The EscI residues preceding this α-helix, residues 56–71, also form mostly hydrophobic interactions with EtgA (involving EtgA helices α1, α2, α5, α6, and α7). The experimentally observed interactions of EtgA with EscI residues 72–87 agree with all three AlphaFold2 predictions (Figure 1). There are also some similarities in the EscI region 56–71 interactions between the virtual EtgA-EscI fusion protein structure predictions and the experimentally determined structure (Figures 1 and 3a–c). This suggests that some interactions involving EscI region 56–71 could also occur when EtgA is recruited to the T3SS. The possible importance of these latter interactions is also strengthened by the amount of buried surface that this EscI region 56–71 adds to the overall buried interface of the EtgA EscI interaction.
Probing that a subsection of EscI can also interact with EtgA outside of the context of a fusion protein was carried out by MST and DSF experiments. The EscI (66–87) peptide, which extends slightly beyond the α-helix that starts at residue 72, was found to have an affinity of 385 ± 35 μM for EtgA (Figure 7). EscI also increases the Tm of EtgA with the stabilizing effects ranging from +2.2°C, for 500 μM EscI (66–87) peptide, to +22.4°C for the EscI (51–87)-EtgA fusion protein (Figure 6); the previously reported increase in aggregation temperature of EtgA by EscI (24–137) of +8°C (Burkinshaw et al., 2015) falls roughly in the middle of this range. The extensive interactions in the EscI-linker-EtgA fusion protein agree with and could explain the observed stabilizing effects of EscI on EtgA protein stability (Figures 3 and 6).
The presented data also yielded new insights into EtgA regulation. First, the presence of EscI modestly increased the activity of EtgA. The EscI (66–87) peptide at 250 μM, which is just below the Kd of 385 μM as determined by MST (Figure 7), enhanced EtgA activity about two-fold (Figure 8). The enzyme activity of the EscI(51–87)-EtgA fusion protein was slightly more than four-fold as active as EtgA by itself (Figure 8). Whether this EtgA-mediated increase in activity is due to an allosteric effect or whether the presence of EscI merely stabilized the relatively thermolabile EtgA cannot be deduced. An EscI-mediated increase in EtgA activity (about an eight-fold increase) was also previously observed for apo EtgA (residues 19–152; just one residue shorter at the N-terminus than our construct) and EtgA co-expressed with EscI (24–137); both samples were purified separately, which could yield different amounts of correctly folded protein as EtgA by itself was reported to be highly unstable and prone to precipitation (Burkinshaw et al., 2015) making comparing activity differences difficult. The observed Tm for 8 μM EtgA was 45.7°C, which is close to the 40°C aggregation temperature Tagg previously observed for EtgA (Burkinshaw et al., 2015). Both temperatures are relatively low and close to the 37°C optimal growth temperature for E. coli, suggesting that at that temperature, a significant population of unbound EtgA starts to unfold and/or aggregates. It is thus a possibility that in addition to EtgA regulation by EscI-mediated localization and possibly enhancing EtgA activity, EtgA is also regulated by using thermal lability as an off-switch if not bound to EscI (as denaturation, via boiling, caused inactivation). Regarding the possible EscI-mediated regulation of EtgA via increasing activity, the putative EtgA-enhancing activity could be related to EscI structurally ordering a section of the EtgA active site (Figure 4a,b). However, that the EscI-EtgA fusion protein structure revealed a more complete EtgA structure compared to apo EtgA D60N structure, which misses helices α6 and α7 (Figure 4a,b), cannot be conclusively attributed to the presence of part of EscI in the former; the partial apo EtgA D60N structure could also have been due to the limited proteolysis step that aided crystallization (Burkinshaw et al., 2015).
The sequence and structural comparison of EtgA and related proteins indicate that EtgA is a hybrid protein sharing features of both muramidases and LTs (Figures 4 and 5). The only residue that is fully conserved in all aligned protein sequences is E42 (Figure 5a). In the set of six related proteins that also share the conserved disulfide bond with EtgA (bottom six in Figure 5a), the postulated catalytic residue D60 is not fully conserved (Malcolm et al., 1989). D60 was previously shown to be important for EtgA activity (Burkinshaw et al., 2015) and is also conserved in the muramidase lysozyme (i.e., D52). When comparing both lysozyme's catalytic E53 (corresponding to EtgA E42) and D52, E53 is the catalytically more important residue as E53Q showed no measurable activity, whereas D52N yielded 5% of wt lysozyme activity (Malcolm et al., 1989). Overall, our analysis cannot conclusively tell whether EtgA is a muramidase or an LT; in-depth analysis of EtgA-generated products by mass spectrometry is needed to determine this distinction.
The observation that a key part of EtgA recognition of EscI involves an EscI α-helix makes sense as the inner rod subunits of secretion systems are mostly α-helical including the EscI homolog PrgJ for which structures were determined as part of a T3SS (Hu et al., 2019; Miletic et al., 2021; Worrall et al., 2023). PrgJ has very weak homology to EscI, in particular in the region EscI was found to interact with EtgA (Figure 5b). Five of the six copies of PrgJ adopted structures comprised of two long antiparallel helices (Hu et al., 2019; Miletic et al., 2021); however, one copy of PrgJ had either its N-terminal section disordered with only the C-terminal helix being resolved (Hu et al., 2019), or adopted a more extended conformation positioning its residues closer to the growing end of the assembling T3SS (Miletic et al., 2021). The fact that one of the PrgJ copies adopts a different conformation is likely due to their different environments as a result of the helical rise of the inner rod (Hu et al., 2019). To gain insights into roughly where EtgA would be situated in an assembling T3SS, we used the cryo-EM structure of the Salmonella T3SS (PDB ID 7AH9; Miletic et al., 2021). We removed the filament and InvG proteins to model an assembling T3SS (Figure 9). A key assumption for our EtgA modeling is that the region more N-terminal to the C-terminal helix in at least one molecule of EscI is not folded back onto itself via an antiparallel helix but is free to move (Hu et al., 2019). This would allow the non-covalently bound EtgA to be tethered near the PG to create a local hole in the PG layer. The resulting localized EtgA activity would allow the assembling T3SS to penetrate the PG layer and reach the outer membrane (Figure 9).

Our structure-guided sequence analysis of EtgA homologs and the residues at equivalent positions found to interact with EscI suggest the possibility that such homologs could be interacting with their partner inner rod protein similarly (Figure 5). Despite very limited sequence similarity within the EscI region found to interact with EtgA, structures of EscI, PrgJ, and MxiI do show a helical region starting roughly in the same position (corresponding to EscI P72; Figure 5b). Furthermore, within this helical region, the hydrophobicity of EscI residues P72, L76, and I80 are conserved (Figure 5b). Our structural insights into the EscI EtgA interaction could thus have a broader impact also providing possible insights into related proteins.
4 MATERIALS AND METHODS
4.1 Protein–protein interaction predictions using AlphaFold2
To predict how EtgA and EscI interact, we used AlphaFold2 (Jumper et al., 2021) and used as input a single polypeptide chain sequence comprising both EtgA (without N-terminal leader sequence) and EscI separated by a 20 residue glycine linker. Both EtgA-EscI and EscI-EtgA containing fusion protein sequences were used for the predictions. To additionally predict how EtgA and EscI interact with each other as separate proteins, we used AlphaFold-multimer (Evans et al., 2021).
4.2 Protein expression and purification
EtgA residues 18–152 (i.e., full-length EtgA with removal of its N-terminal signal peptide as predicted using SignalP 6.0; Teufel et al., 2022) followed by a C-terminal 6xHis-tag was subcloned into pET24a using the NdeI/XhoI cloning sites (by GenScript). Two stop codons (i.e., TAATAA) were added after the protein coding DNA sequence of the His-tag and before the XhoI cleavage site. The EscI EtgA fusion construct was designed as follows: EscI residues 51–87, a linker region comprised of an Ala followed by a 10-residue Gly/Ser-containing region (S-(GGS)3), EtgA residues 18–152 (thus leaving out the EtgA signal peptide), concluded by a C-terminal 6xHis-tag. Two stop codons (i.e., TAATGA) were added to the DNA sequence after the codons corresponding to the His-tag. This fusion construct was also subcloned into pET24a using the same restriction sites (by GenScript).
The expression and purification protocols for both pET24a expression constructs were the same and involved inoculating Terrific Broth media with overnight transformations of BL21-CodonPlus (DE3) cells (Fisher Scientific). Once the culture at 37°C had reached an OD600 of 0.5, protein expression was induced with 0.5 mM Isopropyl β-D-1-thiogalactopyranoside (IPTG) for overnight expression at 18°C. Overnight-induced cultures were harvested via centrifugation and resuspended in a lysis buffer containing 20 mM 4-(2-hydroxyethyl)-1-piperazineethanesulfonic acid (HEPES) pH 7.5, 500 mM NaCl, 25 mM imidazole, and benzonase (Sigma Millipore). The cells were lysed using an EmulsiFlex-B15 microfluidizer with 5 mM MgCl2 added to the lysate. After centrifugation, pre-equilibrated HisPur Cobalt beads (Thermofisher) were added to the supernatant and rocked at 4°C. Following rocking, the beads with bound proteins were washed with the lysis buffer and eluted with 20 mM HEPES pH 7.5, 500 mM NaCl, and 300 mM imidazole. Glycerol was added to the eluate (final concentration 10%), which was flash-frozen and stored in liquid nitrogen until further use. The proteins were further purified using size-exclusion chromatography using a Superdex 75 10/300 GL Increase column (Cytiva) pre-equilibrated with 25 mM citrate (pH 6.0) running buffer.
4.3 Crystallization and crystallographic structure determination
The EscI-EtgA fusion protein was concentrated to 12 mg/mL and crystallized using the sitting drop vapor diffusion method in a 96-well low-profile Intelli-plate (Hampton Research). The reservoir solution consisted of 0.1 M sodium acetate with pH 4.5 and 2 M ammonium sulfate. The crystallization drops were comprised of 1.0 μL of protein and 1.0 μL of reservoir. Crystals were observed after 5 days. Crystals were flash-frozen with perfluoropolyether as a cryoprotection agent and used for data collection at the AMX beamline at the NSLS2 synchrotron facility. EscI-EtgA fusion protein crystals diffracted to 2.01 Å resolution, and the data were processed using XDS (Kabsch, 2010). The structure was solved via molecular replacement with the PHASER software (McCoy et al., 2007) using the EtgA D60N structure (PDB ID 4XP8; Burkinshaw et al., 2015) as the search model. Crystallographic refinement and model building were done using Refmac5 (Murshudov et al., 2011) and COOT (Emsley & Cowtan, 2004), respectively. After several rounds of refinement, clear density for the EscI portion of the fusion protein was evident in the electron density maps and was subsequently included in the refinement. The final model is comprised of EscI residues 56–87, linker residues -ASG-, EtgA residues 19–41, 53–118, and 125–152 (electron density for residues 42–52 and 119–124 was too poor to model these regions and are thus not included in the model). Data collection and refinement statistics are shown in Table 1. Molecular figures were generated using Pymol 2.5.4 (www.pymol.com). Coordinates and structure factors have been deposited with the PDB (PDB ID 8URN).
| EscI-linker-EtgA | |
|---|---|
| Wavelength (Å) | 0.92010 |
| Resolution (Å) | 27.62–2.01 (2.082–2.01) |
| Space group | C2 |
| Unit cell (Å, °) | 107.63 29.89 74.56 90118.19 90 |
| Unique reflections | 14,194 (905) |
| Multiplicity | 6.7 (6.5) |
| Completeness (%) | 99.0 (88.0) |
| Mean I/sigma I | 11.8 (2.1) |
| Rmerge | 0.094 (0.757) |
| CC1/2 | 0.998 (0.709) |
| Refinement | |
| R-work | 0.189 |
| Rfree | 0.245 |
| No. of ligand atoms | 5 (Sulfate ion) |
| No. of water molecules | 55 |
| No. of protein residues | 152 |
| RMSD bond lengths (Å) | 0.007 |
| RMSD bond angles (°) | 1.46 |
| Ramachandran plot favored (%) | 99.3 |
| Ramachandran plot allowed (%) | 0.7 |
| Ramachandran plot outliers (%) | 0.0 |
4.4 Differential scanning fluorimetry
DSF experiments were carried out to determine the midpoint unfolding temperature of EtgA in the absence and presence of part of EscI as either an EscI-derived peptide or part of EscI fused to EtgA. The EscI-derived peptide concentration was either 8 or 20 μM EtgA with 10× SYPRO orange fluorescent dye in 100 mM Tris pH 7.5 and 100 mM NaCl, similar as done previously (Kumar et al., 2021). An EscI-derived peptide and control peptide (from SHV-1 β-lactamase) were included at 250 and 500 μM concentrations: the EscI peptide TAGVSSPEQVLIEEIKKRHLAT (comprising EscI residues 66–87) was synthesized by GenScript (>80% purity as determined by High-performance liquid chromatography (HPLC)). The negative control peptide contains part of the SHV-1 β-lactamase amino acid sequence (FIADKTGAGE) and was synthesized by GenScript (purity >90%). The peptides were resuspended in water. Experiments were performed in duplicate or triplicate, and the fluorescence signal was read out on a CFX96 Touch ThermoCycler (Bio-Rad). The DSF data were analyzed using GraphPad Prism (GraphPad Software, La Jolla, CA).
4.5 Microscale thermophoresis
MST experiments were carried out using a Monolith NT115 instrument using premium capillaries (Nanotemper). Measurements were performed at 5% excitation power and 40% MST power at 25°C. EtgA 6xHis-tag protein was labeled using Monolith His-Tag RED-tris-NTA 2nd generation fluorescent dye (Nanotemper) and kept in phosphate-buffered saline-Tween (PBS-T) buffer. The EtgA protein concentration was kept constant at 37.5 nM in each reaction; the peptide ligand concentration ranged from 10 mM to 0.3 nM with 1× PBS-T used as the buffer (both the EscI and control peptide [from SHV-1] were tested). The signal was recorded using the Pico-RED detector (excitation/emission 600–650 nm wavelength) and the MO.Affinity analysis software was used to calculate the Kd of the peptides binding to EtgA.
4.6 Activity assay
Activity assays probing the EscI's effect on EtgA activity as a separate EscI peptide and part of the fusion protein were performed using the lysozyme EnzChek assay kit (Thermo Fisher Scientific) as done previously (Kumar et al., 2023). Black 96-well (polystyrene half area, medium binding) were used for the assay with a final reaction volume of 100 μL per well. Each well contained 50 μL of buffer (100 mM Tris pH 7.5, 100 mM NaCl) and 5 μM protein (final concentration), with/without peptide EscI or control peptide (250 μM final concentration). The reaction was started by adding 50 μL of fluorescent PG (1 mg/mL in MilliQ) to each well to start the reaction at 25°C, similar as done previously (Kumar et al., 2023). The activity measurements were done in duplicate, and the results were analyzed using GraphPad software. Data were plotted as the percentage of wt EtgA activity. Controls included boiling both EtgA and EscI-linker-EtgA fusion proteins to inactivate these proteins; an additional control was leaving out the EtgA protein with just the EscI peptide present in the assay. These three controls should yield little to no activity.
AUTHOR CONTRIBUTIONS
J. Boorman: Investigation; validation; writing – review and editing. X. Zeng: Writing – review and editing. J. Lin: Writing – review and editing. F. van den Akker: Conceptualization; investigation; visualization; validation; supervision; resources; writing – original draft; writing – review and editing; funding acquisition; formal analysis; project administration.
ACKNOWLEDGMENTS
We thank beamline personnel at the AMX beamline of NSLS for help with data collection. We thank Dr. Arne Rietsch for his helpful comments. We acknowledge funding from the NIH (1R21AI148875). We thank the High-Performance Computing cluster at Case Western Reserve University (CWRU) for help with the AlphaFold2 calculations.


