TEPCAM: Prediction of T-cell receptor–epitope binding specificity via interpretable deep learning
Review Editor: Nir Ben-Tal
Abstract
The recognition of T-cell receptor (TCR) on the surface of T cell to specific epitope presented by the major histocompatibility complex is the key to trigger the immune response. Identifying the binding rules of TCR–epitope pair is crucial for developing immunotherapies, including neoantigen vaccine and drugs. Accurate prediction of TCR–epitope binding specificity via deep learning remains challenging, especially in test cases which are unseen in the training set. Here, we propose TEPCAM (TCR–EPitope identification based on Cross-Attention and Multi-channel convolution), a deep learning model that incorporates self-attention, cross-attention mechanism, and multi-channel convolution to improve the generalizability and enhance the model interpretability. Experimental results demonstrate that our model outperformed several state-of-the-art models on two challenging tasks including a strictly split dataset and an external dataset. Furthermore, the model can learn some interaction patterns between TCR and epitope by extracting the interpretable matrix from cross-attention layer and mapping them to the three-dimensional structures. The source code and data are freely available at https://github.com/Chenjw99/TEPCAM.
1 INTRODUCTION
T cell plays a critical role in human's immune system (Germain, 2002; Waldman et al., 2020; Wen et al., 2011). In the process of adaptive immune response occurred during virus infection or abnormal proliferation, T cell recognizes the specific antigen and triggers a series of downstream events to eliminate infected or cancerous cells (Paucek et al., 2019). Peptides are the most frequently observed among diverse types of antigens that are often presented by major histocompatibility complex (MHC) molecules, and then are recognized by T-cell receptor (TCR) located in the T-cell surface (Rossjohn et al., 2015; Yin et al., 2012). The key for ensuring a robust and specific immune response is the diversity of TCR which is made by VDJ gene recombination (Arstila et al., 1999; Bassing et al., 2002; Roth, 2014). This diversity allows for recognition of a vast library of antigens (Chronister et al., 2021; Gielis et al., 2019; Huang et al., 2020).
Determine the binding specificity of TCR–epitope lights the way for designing neoantigen vaccine and drugs, which is crucial for developing new therapies that target the immune system (Linnemann et al., 2015). Several experimental methods such as pMHC multimers, yeast display-based libraries and single-cell sequencing have been utilized to identify specific TCR–epitope pairs (Altman et al., 1996; Birnbaum et al., 2012; Ng et al., 2019; Wen et al., 2011). However, the barrier of high cost and low discovery frequency hinders the investigation of general binding rules. Therefore, computational methods were developed to model or predict the binding pairs based on the limited hand-crafted data (Dash et al., 2017; De Neuter et al., 2018). Machine learning-based models were found helpful among those methods. Recently, various deep-learning architectures had been employed in the task of predicting whether a given TCR could bind to a given antigen. For example, convolutional neural network (CNN) was implemented in NetTCR and ImRex (Jurtz et al., 2018; Moris et al., 2021), ERGO used both long short-term memory (LSTM) and Autoencoder to build models (Louzoun, 2020), and attention mechanisms were applied in TITAN and ATM-TCR (Cai et al., 2022; Weber et al., 2021). Several methods applied pretrained encoder as embedding, such as PMTNet, TEINet, and TCR-BERT (Wu et al., 2021; Jiang, Huo, & Cheng Li, 2023; Lu et al., 2021). In addition, techniques include meta-learning, contrastive learning, and ensemble learning were also employed to predict binding specificity (Fang et al., 2022; Gao, 2023; Xu et al., 2021). Although most of these models performed impressive in their settings, the challenges remain in this filed. First, the performance of models drops when they are generalized to novel sequences that are unseen in the training data (Deng et al., 2023). Second, the imbalance of data often results in sequence memorization, or generally called shortcut learning in the machine learning field (Geirhos et al., 2020). That is to say, model tends to memorize majority of sequences rather than learning the internal binding pattern between TCR and epitope.
To overcome these challenges, we proposed a deep learning framework named TEPCAM (TCR–EPitope identification based on Cross-Attention and Multi-channel convolution), for prediction of binding specificity between TCR and epitope. By incorporating multiple attention mechanisms including self-attention and cross-attention, our model enables to learn more specific features that govern recognition between TCR and epitope to increase generalizability on unseen data. The better interpretability of model roots from the extracted attention map, which is helpful for explaining the pattern learned during training stage. In this study, we compare TEPCAM with several state-of-the-art models on two strictly designed test tasks and observed the superior performance of our model. The ablation experiments demonstrate that each module in our model contributes to the predictive power of the whole model. Then we investigate the learned binding pattern via attention matrix and prove that our model could focus on the important region that determines binding between TCR and epitope. Furthermore, we conduct case studies on a high-quality dataset to elucidate the model's interpretability by successfully mapping the model attribution with the ground truth structure.
2 RESULTS
2.1 Problem definition and model overview
In TCR–epitope binding identification task, the aim is to predict whether the given TCR and epitope bind to each other. The epitope information is given as a short peptide sequence which consists of several amino acid residues. For TCRs which compose of α and β chains as well as other extra information (e.g., V, D, and J genes), the complementarity-determining region 3 (CDR3) region of β chain is the most representative element for TCR since this region typically locates most closely to corresponding epitope. One of 21 letters is used to represent each amino acid residue of both types of sequences. Given TCR and epitope sequence as input, the model output a continuous value between 0 and 1 that indicates the probability of binding.
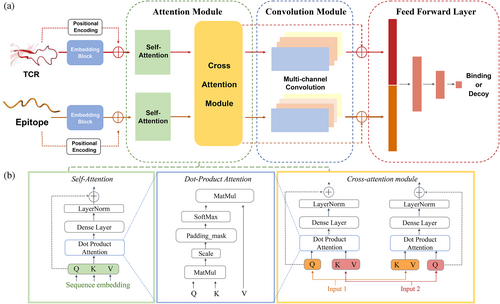
The proposed framework called TEPCAM is an end-to-end model (Figure 1). The raw epitope sequence and aligned TCR sequence are encoded by an embedding block with additional positional encoding strategy. Then the encoded sequences go through the attention module which contains a self-attention layer and a cross-attention layer, in which the multihead attention mechanism is often used to process contexture information. While self-attention layer obtains the query, key, and value from single sequence, cross-attention transforms one input sequence as query and another sequence as key and value respectively, which is a better way to capture more specific interactions between two parts of input by allowing model to attend to both of sequences simultaneously, leading to better generalizability. The output of attention module matrix goes through a multi-channel convolutional layer in order to further process features, which are entered into final feed-forward layer consisting of three fully connected layers with batch normalization and GeLU activation function to output a final value.
2.2 TEPCAM achieves better generalizability than several state-of-the-art models
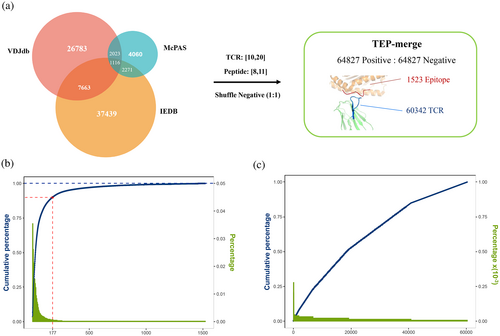
The experimental validated datasets were used to train and test models. In general, we trained TEPCAM using TEP-merge dataset which were merged from three public databases, including VDJdb (Goncharov et al., 2022), McPAS and IEDB (Tickotsky et al., 2017; Vita et al., 2019; Figure 2A). To avoid external bias from the negative sample generation strategy (Moris et al., 2021), we did not use a background TCR dataset such as data from 10× Genomics assay or TCRdb but applied the strategy of randomly shuffle positive pairs to generate negative pairs (Chen et al., 2021; Montemurro et al., 2021). Finally, TEP-merge consists of 129,654 TCR–epitope pairs with a positive: negative ratio as 1:1, involving 1523 unique epitopes and 60,342 unique TCR. The imbalance and longtail of dataset were observed on the epitope side (Figures 2B,C, S1, and S2), in which the top 117 epitopes accounted for 90% of the dataset, while the remaining 1406 epitopes contributed to only 10% of the data. As for TCR, the longtail distribution is relatively less pronounced. Instead of random split dataset in which most of TCRs and epitopes in the test set are likely to be appeared in the training set, we strictly split the dataset to construct a zero-shot TCR prediction task to test model performance when generalized to novel TCR sequence which demands high generalizability. In this setting, the TCR sequences of test set were unseen in the training set.
To verify our model's generalizability, we first compare TEPCAM against other four TCR–epitope binding specificity prediction models on the strictly split TEP-merged dataset. Four baselines are all deep learning-based models, which were established in a supervised way, including TITAN, ERGO-AE, ERGO-LSTM, and ATM-TCR. The dataset was split into a ratio of 4:1 for training data and test data. The split was repeated by 10 times in order to minimize the impact of randomness.
In this TCR zero-shot setting, TEPCAM showed better performance than other four state-of-the-art methods (Figure 3A and Table S5). The higher values in terms of Accuracy, AUC, AUPRC, and F1 were observed. Moreover, we implemented the test for 25 times by splitting dataset using 5 different random seeds. For each random seeds, we applied five-fold cross-validation (CV) that every fold contained unique TCR, and then we calculated the mean value and variation for each metric. Our model also showed low variation values among the metrics of Accuracy, AUROC, and AUPRC. The results indicated that TEPCAM could successfully generalize to the unseen TCR sequences.

Then we applied TEPCAM to an external dataset named ImmuneCODE in order to test the performance when transferring to another dataset with potentially different distribution. After the same filtering, the final ImmuneCODE dataset contained 28,303 TCR–epitope pairs assigned to ~1000 Coronavirus disease 2019 (COVID-19)-related individuals (Nolan et al., 2020), in which the pairs with TCR appeared in merged dataset were removed. All the models were trained using the entire TEP-merge dataset, and then tested in ImmuneCODE. As shown in Figure 3B and Table S6, TEPCAM outperforms other models in terms of all the metrics on this external dataset. Notably, in comparison to the training and test data sourced from one dataset, the external test is of more challenging, since the distribution of external dataset may be more distinct, and the significant distribution shift can make it more difficult to generalize the model on unseen data. In sum, experimental results demonstrated that our model exhibits superior generalizability compared to other recently published frameworks.
2.3 Detail analysis of predictive power of individual components in the model
In this subsection, we further assessed the predictive power of individual module of the whole model. The advantages of TEPCAM can be summarized as two parts. First, in a known binding epitope–TCR pair, the TCR recognizes epitope by only using several key residues, and similarly, the epitope also interacts with TCR by using only a few specific residues. The cross-attention module of our model is capable of capturing the specific residue-wise interaction between two input sequences. Second, the output of cross-attention encoded the interaction map of TCR and epitope sequences and such matrix is suitable to be further processed by convolution neural network for feature extraction and learning local pattern. The CNN layer we used did not modify the matrix shape but increased the channel number, enabling the model to enrich more knowledge. We conducted a series of ablation analysis on the ImmuneCODE dataset. First, a drop of performance was observed when either the self-attention module, cross-attention module, or convolution module was removed (Table 1), but the metrics are still higher than that of the baseline models. This result may be attributed to the fact that the attention layer after embedding module can extract useful features for prediction, although one of them was removed. Then we performed a module swap by repositioning the cross-attention module after the convolution module. As a result of this rearrangement, we observed a decrease in the model's performance.
| Model | ACC | AUC | AUPRC | F1 |
|---|---|---|---|---|
| TEPCAM | 0.622 ± 0.0010 | 0.677 ± 0.0012 | 0.722 ± 0.0012 | 0.633 ± 0.0029 |
| Cross-attention final | 0.618 ± 0.0020 | 0.672 ± 0.0019 | 0.718 ± 0.0019 | 0.630 ± 0.0030 |
| Remove cross-attention | 0.611 ± 0.0023 | 0.660 ± 0.0026 | 0.712 ± 0.0013 | 0.619 ± 0.0026 |
| Remove self-attention | 0.617 ± 0.0008 | 0.669 ± 0.0014 | 0.716 ± 0.0004 | 0.624 ± 0.0007 |
| Remove convolution | 0.598 ± 0.00122 | 0.640 ± 0.0018 | 0.701 ± 0.0010 | 0.605 ± 0.0017 |
- Note: The best values were shown in bold.
Before going through the attention module, the features were initiated originally from an embedding block. We also tested the different strategies to get sequence embeddings, including BLOSUM62 matrix and two pretrained embedding models. BLOSUM62 matrix naturally contained the relationship between one residue to another by mapping one amino acid to a 24-dimensional space (Henikoff & Henikoff, 1992). In our settings, a lower AUROC value of 0.666 was observed for BLOSUM 62 matrix in comparison with 0.679 for encoding sequence by our embedding layer (e.g., random initialization). Then, we employed pretrain model originally such as TCR-BERT and TCR2Vec, which are two pretrained frameworks published recently, training on a large TCR sequence pool. TCR-BERT embedded the sequence into a 768-dimensional vector and TCR2Vec set the hidden size as 120 (Wu et al., 2021; Jiang, Huo, Zhang, et al., 2023). Both TCR-BERT and TCR2Vec encoded the sequence to a fixed length, and the output was presented as a high-dimension vector that contained enriched evolutionary information, and improved performances were observed on TCR–epitope binding classification tasks comparing to general protein language models such as TAPE and ESM series. We tried to apply these two models in the embedding module. However, the implementation of TCR-BERT and TCR2Vec even decreased the model performance (Figure 4A).
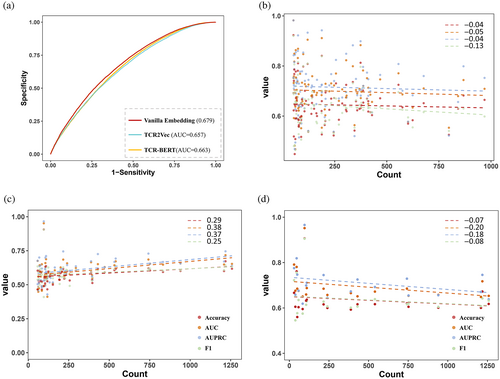
Deep models sometimes tend to get better performance on majority samples. For TCR–epitope-related dataset, the diversity of TCRs is far more than that of epitopes, and the distribution of epitopes is severely imbalanced. We investigated the performance of per epitope in both of two tasks after removing the epitopes that are assigned by <20 TCRs to avoid extreme values that skew the model performance. For task1, the epitope counts and metrics were shown in very weak negative correlations, suggesting that our model is not sensitive to epitope distribution on this dataset (Figures 4B and S3–S5). On the ImmuneCODE test set, positive correlations were observed. However, when we further searched the top 20 epitopes in terms of AUC which had the best prediction performance (Table 2), the epitope counts and metrics had negative correlations, which indicated that the counts for those epitopes identified accurately did not affect model performance. (Figure 4C,D). These findings supported that our model was not affected too much by the inner bias of training data, suggesting that the TEPCAM model could learned some binding pattern that determines the binding of two sequences.
| Epitope | Count | AUC | Accuracy | AUPRC | Recall | F1 |
|---|---|---|---|---|---|---|
| TLDSKTQSL | 96 | 0.952 | 0.906 | 0.966 | 0.896 | 0.905 |
| RLYYDSMSY | 30 | 0.791 | 0.667 | 0.775 | 0.867 | 0.722 |
| NQKLIANQF | 46 | 0.781 | 0.761 | 0.819 | 0.739 | 0.756 |
| VLWAHGFEL | 1218 | 0.717 | 0.672 | 0.746 | 0.588 | 0.642 |
| NLNESLIDL | 110 | 0.688 | 0.636 | 0.711 | 0.618 | 0.630 |
| KLPDDFTGCV | 742 | 0.685 | 0.620 | 0.729 | 0.612 | 0.617 |
| LLSAGIFGA | 50 | 0.685 | 0.560 | 0.747 | 0.600 | 0.577 |
| YIFFASFYY | 216 | 0.685 | 0.616 | 0.745 | 0.648 | 0.628 |
| KEIDRLNEV | 38 | 0.676 | 0.605 | 0.658 | 0.474 | 0.545 |
| ALLADKFPV | 58 | 0.675 | 0.603 | 0.676 | 0.690 | 0.635 |
| TLIGDCATV | 540 | 0.672 | 0.617 | 0.692 | 0.678 | 0.639 |
| KLNVGDYFV | 388 | 0.665 | 0.593 | 0.673 | 0.613 | 0.601 |
| FLLNKEMYL | 106 | 0.659 | 0.632 | 0.699 | 0.585 | 0.614 |
| RQLLFVVEV | 940 | 0.658 | 0.601 | 0.656 | 0.611 | 0.605 |
| LEPLVDLPI | 240 | 0.657 | 0.600 | 0.644 | 0.617 | 0.607 |
| YLNTLTLAV | 752 | 0.654 | 0.605 | 0.655 | 0.641 | 0.619 |
| FLPRVFSAV | 1258 | 0.653 | 0.618 | 0.638 | 0.658 | 0.633 |
| ILGLPTQTV | 430 | 0.651 | 0.616 | 0.725 | 0.591 | 0.606 |
| EEHVQIHTI | 84 | 0.650 | 0.595 | 0.619 | 0.548 | 0.575 |
| KAYNVTQAF | 1209 | 0.649 | 0.600 | 0.671 | 0.617 | 0.608 |
- Note: Epitope sequence and count in the training set, as well as six metrics are shown.
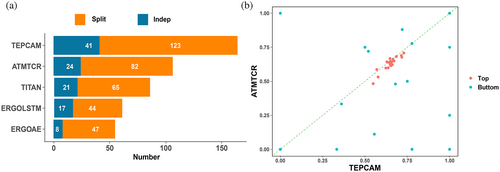
To further illustrate the advantages of our model, we then evaluated the model performance on the level of specific epitope. First, we benchmarked TEPCAM against other four baselines. The performance on individual epitope was evaluated using AUROC as metric, and then the number of epitopes that obtain Top 1 AUROC for each model is counted. We found that TEPCAM achieved the highest Top 1 AUROC on both Task 1 (CV on merged dataset) and Task2 (benchmarks on external dataset ImmuneCODE; Figure 5A). Second, we ranked epitopes by their counts on training set. Then the most abundant 20 and fewest 20 were selected. We found ATM-TCR performed best among four baseline models, so we focus on the comparison between TEPCAM and ATM-TCR. TEPCAM performed better in most epitopes, especially a few bottom epitopes which TEPCAM obtained acceptable AUROC when ATM-TCR almost failed to determine (Figure 5B).
2.4 Attention map provides the clue for the learned binding patterns of TCR–epitopes
TEPCAM has an advantage on model interpretability that enables a closer look at the interaction patterns at residue level, which is critical for detecting specific biological rules. Basically, the interaction strength could be represented by attention score, which is calculated by the scaled dot-product of Key and Query. We extract the attention map in self-attention layer and cross-attention layer from ImmuneCODE test dataset to validate whether our model learned salient binding pattern. For both TCR and epitope, the self-attention maps were condensed to a one-dimensional vector by taking the mean across other dimensions (Figure 6A). The results depicted a higher attention score for the middle part of TCR sequence, and the scores on epitope side are close to uniform distribution except for beginning and final positions, suggesting that the self-attention layer mainly focuses on the middle part for input data, especially for TCR. Two-dimensional attention maps extracted from cross-attention reveal more detailed information about interaction patterns between TCRs and epitopes after averaging over all samples (Figure 6B). The matrix shows a higher score in the middle part of TCR toward epitopes, and the fine-gained interaction map could provide more biological insights on the specific cases.

2.5 Application of TEPCAM on the TCRs with 3D structures
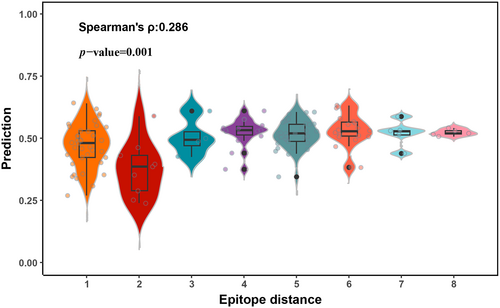
We finally applied TEPCAM to a high-quality dataset from STCRdab (Leem et al., 2018), which records the curated TCRs with three-dimensional crystal structure data stored in Protein Data Bank (PDB). We selected TCR structures with assigned peptide epitope presented by MHC Class I molecule. Moreover, we performed epitope zero-shot task by removing overlapped epitopes in training data. In the scenario of unseen epitope task, the epitope zero-shot task refers to the recognition of TCR–epitope pair in the scenario that epitopes in test are unseen in the training set. Most of models failed to predict correctly and the accuracy drops to the random guess level. This task is particularly challenging, partly due to the very limited epitope diversity. We obtained 128 high-quality items with three-dimensional structure and extracted the corresponding epitope and CDR3 sequences for model test after removing overlap items. Since this test dataset only contains positive samples, we evaluated the performance of our model using the accuracy metric. TEPCAM shows a recall rate of 0.57, suggesting that more than half of the binding samples were successfully predicted. We also evaluated the model's performance in this scenario by generating negative samples using a random shuffle strategy. In this benchmark, TEPCAM achieved the highest F1 value of 0.587 (Table S4). To prove our model not just successfully predict items with epitope close to training set, we explored the relationship between binding probability and epitope distance. Here, smallest levenshtein distance acted as distance for one epitope on high-quality dataset. Unexpectedly, the spearman correlation between levenshtein distance and probability was 0.286 with a p-value 0.001, indicating that the predicted probability of increases as epitope's levenshtein distance increases (Figure 7). These interesting results prove that our model could successfully retrieve a part of unseen epitopes, without relying on the presence of similar epitopes on the training set.
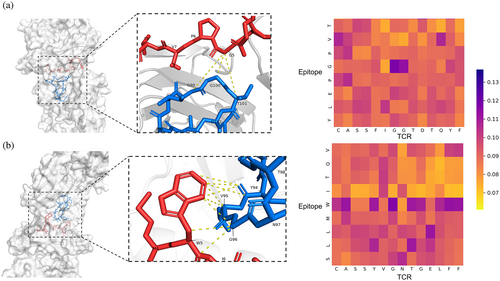
Using interaction map extracted from cross-attention layer enables us to easily investigate the region on which our model focuses. We picked TCR–epitope complexes that are recorded with PDB ID 2BNQ and 5EU6 as examples (Figure 8). As shown in Figure 8A, the glycine residue (G*5) on the epitope located in the binding surface located close to G*99-T*101 of TCR CDR3 region. The corresponding attention scores of G*5 to G*99 and G*5 and G*100 were observed highest in the cross-attention matrix, suggesting that our model had caught these pairs that have potential to determine the binding between TCR and epitope. The second case came from protein complex with PDB ID 5EU6 (Figure 8B). The tryptophan residue (W*5) located at the fifth position of the epitope exhibits a greater degree of attention compared with other positions. As shown in the crystal structure, this tryptophan residue has an aromatic ring toward the central of CDR3 loop region, resulting in a closer distance for tryptophan residue to several residues in TCR sequence. The distance between the aromatic ring to tyrosine (Y94), valine (V95), and glycine (G96) were among 5 Å. TEPCAM had captured two of three interaction pairs. These insights suggested that TEPCAM had learned some knowledge about the underlying binding mechanism.
3 DISCUSSION
Computational methods are of great importance in identifying interaction between TCRs and epitopes. In recent years, more and more predictive models based on deep learning were proposed with the purpose of accurately predicting binding of TCR–epitope (Hudson et al., 2023). The task is not very challenging when data are not strictly divided. Most of frameworks could achieve an AUC value more than 0.8 in the strategy of random split. However, this good performance cannot be observed when these models were extrapolated to unseen data. The generalizability of a model is more significant in real-world application scenario where novel and unseen sequences are likely to be encountered (Deng et al., 2023; Grazioli et al., 2022). Therefore, we proposed TEPCAM as a deep learning framework with better generalizability in the settings of unseen TCRs prediction on both a strictly split dataset and an external dataset.
TEPCAM adopted attention mechanism which was originally applied in the field of Nature Language Process since its power focuses on important part of the sequence information. Given that TCR and epitope are both sequences consisting of amino acid residues which can be represented by letters and the hierarchical structure between nature language in sentences and protein sequences are similar (Ferruz & Höcker, 2022), the application is reasonable and effective. The architecture of a self-attention layer followed by a cross-attention layer enables the model to capture inter-sequence dependency for both TCR and epitope sequences, as well as relationship between them. Cross-attention layer models interaction at the residue level by incorporating two sequences during the calculation of scaled attention score. This fine-grained modeling is particularly useful for identifying binding that is determined by only specific residues of two sequences. Another advantage of cross-attention module is its interpretability, in which the attention weight scores between residue pairs from the TCR and corresponding epitope, and serves as the representation of the interaction strength, thereby making the result interpretable. The correspondence between knowledge our model learned and real distance of three-dimension was observed when checking the matrix for specific TCR–epitope pair. Inspired by the image processing techniques in the field of computer vision, multi-channel convolutional neural network was applied in order to further expand the generalizability of the model. The multi-channel convolution layers are capable of extracting diverse and useful local features in the interaction map output from cross-attention module, since the map is akin to pixels of image data. Together, the novel architecture makes our model superior when it is generalized to unseen sequences.
The public datasets in this community are imbalance especially on the epitope side, so that the limited diversity increases the difficulty for extrapolation. The negative data generation strategy is worth noting. The utilization of a background TCR pool might lead to bias and overestimation of model performance (Dens et al., 2023; Moris et al., 2021), so we used random shuffle strategy to obtain our negative pairs. This strategy might bring false negative samples although the possibility is relatively low. To improve benchmarking and provide more valuable data in this field, there is an urgent need to develop high-quality negative data validated by experiments.
An interesting result from our assessment of employing pretrained model revealed that it did not appear to bring any improvement at least in our model and dataset. This result may be attributed to the complexity of our model, as the pretrained encoder typically follows a simple downstream module such as fully connected layers. Nonetheless, the models trained on larger sequence dataset still offer greater potential, and further research is needed to understand a better way to integrate pretrained model to achieve optimal performance.
A potential direction for further extending our model is to involve more information. Apart from TCR beta chain, the alpha chain, and V, D, J genes are also informative for recognition, but this information are very limited. Some work such as VDJminer used V(D)J gene segments as input feature (Zhao, He, Xu, Zhang, et al., 2023). MHC molecule type can serve as additional input because epitopes associated to MHC also follow certain rules and show preference (Bharadwaj et al., 2012; Chu et al., 2022; Lu et al., 2021; Robinson et al., 2015; Unanue, 2006). In addition, the high-quality data with three-dimensional structure information is valuable for our model, so that integrating these data might be able to further enhance the model performance, especially the generalizability. From a broader perspective, deep learning models for identifying widely receptor-antigen recognition might be more favorable in practical use. For example, DeepAIR used structural information and sequence information simultaneously that extended the application scope to both TCR and BCR (Zhao, He, Xu, Li, et al., 2023). With more high-quality immune-specific data available, the prediction tools will be more prominent in the future.
4 CONCLUSION
In this study, we proposed TEPCAM which is based on cross-attention and multi-channel convolutional neural network, for prediction of TCR–epitope binding specificity. Our model has demonstrated superior performance in predicting TCR–epitope binding on the unseen TCR task. By leveraging cross-attention and multi-channel convolution, TEPCAM was able to learn more specific features that govern recognition between TCRs and epitopes. Moreover, the attention matrix extracted from cross-attention layer increases the model interpretability and proves the effectiveness of our model in identifying key binding regions between TCRs and epitopes.
5 MATERIALS AND METHODS
5.1 Data curation
We collected TCR–epitope pairs from three databases as original source: VDJdb (Goncharov et al., 2022), McPAS (Tickotsky et al., 2017), and IEDB (Vita et al., 2019). For each database, we only selected the epitopes presented by human MHC I molecules. We only kept CDR3 region of β-chain in TCR sequence since this region contains most valuable information for recognizing epitope and the databases mainly record sequence information of β chain with very limited information about other chains (e.g., TCR alpha chain, V, D, and J genes). Length of sequences was filtered between 10 and 20 for TCR sequences and 8–11 for epitope sequences. In order to obtain a larger diversity of sequences, especially for epitopes, we merged three datasets and removed duplicated pairs. Finally, the merged dataset contains 64,827 positive pairs. To generate negative samples, we randomly selected a TCR sequence from our dataset except the paired one for an epitope, and obtained a mismatched TCR–epitope pair. To achieve a balance between the recall rate and precision, we constructed a balanced dataset with an equal ratio of positive to negative samples. This strategy is the same as related works such as TITAN, ATM-TCR, and ImRex. Following this way, we construct negative data with the same number as positive data. We finally got a dataset with 129,654 pairs, named TEP-merge.
To validate our model's generalizability, the data from ImmuneCODE was collected as a held-out dataset (Nolan et al., 2020). The quality control filters were the same as TEP-merge. Moreover, we removed pairs whose TCR presented in the TEP-merged dataset. The high-quality dataset was constructed from STCRDab (Leem et al., 2018), in which we attained 128 TCR–epitope pairs with three-dimensional structural information stored in PDB database.
5.2 Details of the model architecture
The concatenated matrix output of cross-attention layer is finally sent to convolution module, which composes of three layers of convolutional neural networks. Convolution neural network is widely applied in computer vision, which is also suitable for this task since the attention matrix can be regarded as a picture with pixels. We used a single convolution kernel with size = 3 and stride = 1. The padding number was also set to 1 in order to maintain the output size. The number of channels was increased gradually from 1 to 4, 16, and 32 for output, and the batch normalization was applied after convolution operation, following the activation function GeLU (Hendrycks & Gimpel, 2016). The features passed through CNN are averaged in the channel dimension and concatenated. A residue connection was applied for the flatten output of cross-attention. Finally, the concatenated features are sent into feed-forward layer with three fully connected layers. The perceptron has 1024, 128, 16, 2 neurons for each linear layer and the output also activated with GeLU. Finally, the Softmax was used to dense the output into a range from 0 and 1. By sequentially stacking these four core modules, the input sequences are processed from multiple perspectives and information is sufficiently exchanged to yield relatively reliable predictions. We use the cross-entropy loss as loss function.
5.3 Implementation and hyperparameter tuning
The data process was conducted by using Biopython 1.78, Numpy 1.23.5, and Pandas 1.5.2. We used PyMol version 2.5.5 to visualize protein three-dimensional structure. The visualization of results mainly used ggplot2 package in R. TEPCAM was trained on two GeForce RTX 3080 GPUs with 16G memory under the PyTorch 2.0.1 framework with Python 3.8.16. The model weights were updated using AdamW optimizer with 1e−4 weight decay.
We conducted hyperparameter tuning using random-split strategy (Note S1), and the optimal hyperparameters are: Number of headself-attention = 3, Number of headcross-attention = 6, dimensions of embedding and attention layer = 32, learning rate = 5e−4 (Table 3). We found that TEPCAM was relatively robust across different hyperparameter values. The results of hyperparameter tuning are given in Table S1–S3.
| Hyperparameter | Values | Optimal value |
|---|---|---|
| Number of headself-attention | {1, 3, 5, 6, 9} | 3 |
| Number of headcross-attention | {2, 6, 10, 12, 18} | 6 |
| dmodel | {16,32,64,128} | 32 |
| Learning rate | {5e−3, 1e−3, 5e−4, 1e−4, 5e−5, 1e−5} | 5e−4 |
5.4 Evaluation metrics
5.5 Baseline models
To compare the generalizability of our model, four supervised model are selected as baselines, which are published recently and showed state-of-the-art performance on the public datasets. ERGO-LSTM and ERGO-AE are based on LSTM and Autoencoder (Louzoun, 2020). Since we only use CDR3-beta as TCR input, the next generation of ERGO that contains more knowledge was not considered. TITAN used bimodal attention mechanism and pretrained on a CPI task (Weber et al., 2021), and ATM-TCR applied multihead attention network to capture contexture information (Cai et al., 2022). We obtained the baseline models from their GitHub repositories and trained on our dataset for fair comparison. TCR2Vec and TCR-BERT are two pretrained models, and we used the weights of the existing model they released for comparison with our embedding strategy.
AUTHOR CONTRIBUTIONS
Junwei Chen: Investigation; writing—original draft; methodology; validation; visualization; formal analysis; data curation; writing—review and editing. Bowen Zhao: Methodology; writing—review and editing. Shenggeng Lin: Methodology; writing—review and editing. Heqi Sun: Methodology. Xueying Mao: Methodology. Meng Wang: Writing—review and editing. Yanyi Chu: Methodology. Liang Hong: Writing—review and editing. Dong-Qing Wei: Writing—review and editing. Min Li: Funding acquisition; conceptualization; writing—review and editing. Yi Xiong: Conceptualization; supervision; writing—review and editing.
ACKNOWLEDGMENTS
This work was supported by the National Natural Science Foundation of China (61832019).
CONFLICT OF INTEREST STATEMENT
The authors declare that they have no competing interests.
Open Research
DATA AVAILABILITY STATEMENT
The codes and datasets are open-source and available at https://github.com/Chenjw99/TEPCAM.


