Beyond basins: φ,ψ preferences of a residue depend heavily on the φ,ψ values of its neighbors
Abstract
The Ramachandran plot distributions of nonglycine residues from experimentally determined structures are routinely described as grouping into one of six major basins: β, PII, α, αL, ξ and γ'. Recent work describing the most common conformations adopted by pairs of residues in folded proteins [i.e., (φ,ψ)2-motifs] showed that commonly described major basins are not true single thermodynamic basins, but are composed of distinct subregions that are associated with various conformations of either the preceding or following neighbor residue. Here, as documentation of the extent to which the conformational preferences of a central residue are influenced by the conformations of its two neighbors, we present a set of φ,ψ-plots that are delimited simultaneously by the φ,ψ-angles of its neighboring residues on both sides. The level of influence seen here is typically greater than the influence associated with considering the identities of neighboring residues, implying that the use of this heretofore untapped information can improve the accuracy of structure prediction algorithms and low resolution protein structure refinement.
Introduction
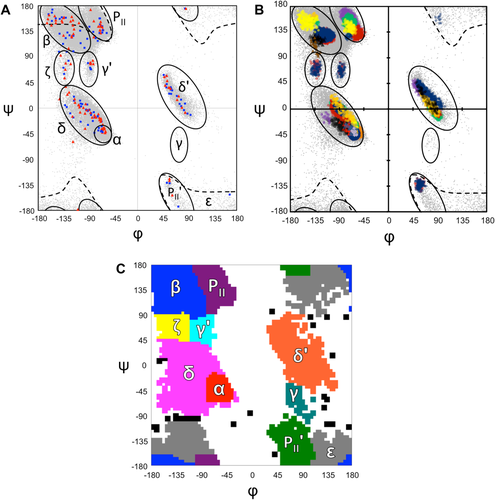
Proteins can be described as a series of local conformations or motifs that are strung together to make the 3-dimensional structure.1 Assuming trans peptide bonds, the local protein conformations themselves can be largely described by two torsion angles, φ and ψ, adopted by each residue. Plotting these two variables against each other leads to the well-known Ramachandran plot, which has served as a basis of understanding protein conformation for 50 years (Fig. 1).2-7 Over the decades, various nomenclatures have been used for the populated regions within the plot [e.g., Ref. 8] with recent systems being more closely based on the natural groupings of residues so that each of these apparent “thermodynamic basins”9 is given a name [Fig. 1(A)].

Variations in Ramachandran plot distributions. (A) Ramachandran region nomenclature based on natural distributions of residues in proteins [Refs.: e.g. 8, 30] overlaid on 76,533 well-ordered residues from high resolution structures19 (gray dots), and markers denoting the peak positions seen for the i + 1 (blue squares) and i + 2 (red triangles) residues in the 101 most common (φ,ψ)2-motifs.19 For further details of the (φ,ψ)2-motifs see Hollingsworth et al.19 (B) The natural distributions of residues occurring in select (φ,ψ)2-motif contexts (colored dots) are displayed with that full dataset as a background (gray) and the relevant basins from A outlined for reference. The colored distributions correspond to residues from some of the most prominent (φ,ψ)2-motifs19 with the extent of the distributions limited to the most densely populated parts that are fully distinct from other motifs [see Fig. 6 of Ref. 19]. The display mode (as circles unless otherwise noted) of (φ,ψ)2-motif distributions grouped by basin are: α/δ basin [αα.1 both residues (dark purple); αδ.1 first residue (blue); αδ.1 second residue (green); Pα.1 (light green), βα.1 (orange); ζα.1 (light yellow); δβ.1 (black); αζ.1 (red triangles); δ'α.1 (blue triangles); εδ.1 (purple diamonds); δP.1 (red); δδ'.1 (green triangles); Pδ.1 (purple); P'δ.1 (orange triangles)]; δ' basin [Pδ'.1 (green); δδ'.1 (blue); δ'P.1 (red); δ'δ'.1 first residue (purple); δ'δ'.1 second residue (orange); δ'α.1 (black)]; β basin [ββ.1 first residue (blue); ββ.1 second residue (red); βP.1 (green); Pβ.1 (purple triangles); βα.1 (orange); δβ.1 (yellow); βδ'.1 (black triangles); βP.1 (brown triangles)]; PII basin [Pα.1 (green); PP.1 both residues (purple); Pδ'.1 (red); δP.1 (yellow); Pβ.1 (blue); δ'P.1 (orange)]; PII' basin [P'δ.1 (blue); βP'.1 (red)]; γ' basin: [γ'δ.1 (blue); δγ'.1 (red)]; ζ basin [ζα.1 (blue); αζ.1 (red)]; ε basin [εδ.1, blue]. C) Exact boundaries used for mapping the observations in this data set into the 10 defined regions as labeled; observations not categorized are in black.
In the 1960s, in support of calculations related to understanding polypeptide conformations, the Flory Isolated-Pair Hypothesis posited the simplifying assumption that the conformation of a given residue does not affect the conformation of its neighbors.10 This hypothesis still guides much thinking about protein conformation, even though studies have shown that it does not actually hold for polypeptides.11-13 Notably, Pappu et al.11 used a dataset of Monte Carlo generated Ala-polypeptides to show that simple steric considerations cause the Isolated-Pair Hypothesis to break down quickly with chain length.
While much work has been done on the relationships between amino acid sequence and conformation,13-16 less has been done to explore the details of how the conformation of a residue depends on the conformation of its neighboring residues, irrespective of amino acid type.13, 17, 18 Recently, we published a study of local protein conformations that focused on what we called (φ,ψ)2-motifs; each such motif corresponds to a particular path of four sequential Cα-atoms—named residues i to i + 3 – that is defined by the conformations of the two central residues: φi + 1, ψi + 1, φi + 2, ψi + 2.19 In that study, we developed a list of the 101 most common (φ,ψ)2-motifs that occur in proteins.19 Interestingly, an unexpected observation was that the φ,ψ values corresponding to the most densely populated centers of each motif were not highly clustered at the centers of the well-defined basins, but were rather broadly scattered throughout them [Fig. 1(A)]. This observation implies that the thermodynamic basins are not homogeneous populations, but are an aggregate of many discrete subpopulations that depend on the φ,ψ-values adopted by the neighbors of the residue in question.
Illustrating this point further, we plot in Figure 1(B) selected populations from the (φ,ψ)2-motif analysis that show the extent to which some of the more prominent natural distributions, especially in the broader β, PII, δ, and δ' regions, populate distinct subregions depending on the φ,ψ-values of the preceding or following residue. Striking examples among these are the yellow vs. blue populations in the β-basin, the purple vs. red populations in the PII-basin, and the purple vs. green populations in the δ' basin. If the Flory isolated-pair hypothesis were true, each of these distributions would overlap perfectly. These results imply there is a level of complexity to the Ramachandran basins than has not been explored and that depends simultaneously on the conformations of both of its neighbors. Here, we provide an initial exploration of this complexity by providing a first simple and direct documentation of the extent to which the conformations adopted by a central residue are impacted by the conformations of both of its neighbors.
Results and Discussion
The dataset
The dataset for our (φ,ψ)2-motif study which led the the results summarized in Figure 1, was generated using the Protein Geometry Database20 (PGD) as described previously.19 It was a set of 76,533 four-residue segments from crystal structures of diverse proteins (having less than 25% sequence identity to any other structure in the dataset based on the PISCES list) that had been determined at ≤1.2 Å resolution with R ≤ 20% and Rfree ≤ 20%. Furthermore, the omega torsion angles for the first three residues were required to be within ±40° of 180°. B-factor cutoffs of ≤20 Å2 for the main chain and ≤25 Å2 for the γ-atom were used, with no cutoff based on side-chain B-factors. Other parameters were left as PGD default values. For the work here analyzing three-residue segments, we sought a larger data set because three residue segments represent a 6-dimensional space (φ and ψ for each of three residues) that will be more sparsely populated than the 4-dimensional space described in the (φ,ψ)2-motif study. We generated a larger set by relaxing the resolution cutoff to 1.5 Å while retaining all other filters used in the generation of the previous dataset; this resolution should still provide sufficiently accurate torsion angles for the purposes of this study. Residue 2 of each quartet constituted the central residue with residues 1 and 3 providing the neighboring (φ,ψ)2-contexts. The search resulted in 234,982 observations after discarding any quartets that did not have complete φ,ψ-values for residues 1, 2, and 3. This complete data set is provided as Supporting material. For segments of protein structures with alternate conformations, the Protein Geometry Database stores only the “A”-conformation, and any such qualifying segments will be included in the data set.
The influence of conformational context
To test how the conformational properties of a central residue depend on the conformation of its two neighbors, the new dataset was divided into populations defined by the conformations of the i − 1 (i.e., preceding) and i + 1 (i.e., following) neighbors. We assigned the i − 1 and i + 1 residues to conformational regions by discretizing ϕ,ψ-space into 5° × 5° bins and grouping sets of bins to create ten regions that represent the commonly defined populations (1C). These conformations are referred to using the shorthand designators α, δ, β, PII, γ', ζ, ε, PII', δ', and γ. An eleventh designator ‘X’ was used to imply a wild card, meaning the conformation of the residue could be any one of the 10 regions. In all, 99.9% of the residues in the data set (or 234,715 residues), had both residue i − 1 and i + 1 in one of the ten categories and contributed to our analyses. With each of the neighbors having 10 possible categories, the central residues included in the analysis could be in one of 100 (i.e. 102) conformational contexts. The contexts are described by a shorthand such as δ-X-α indicating the central residue can adopt any conformation (‘X’), while the residue before and after are limited to a particular conformation, in this case δ and α, respectively. The populations of residues in each of the 100 contexts are provided in Supporting Information Table S1, and images of the ϕ,ψ-distributions of all 100 populations are in Supporting Information Figure S1.
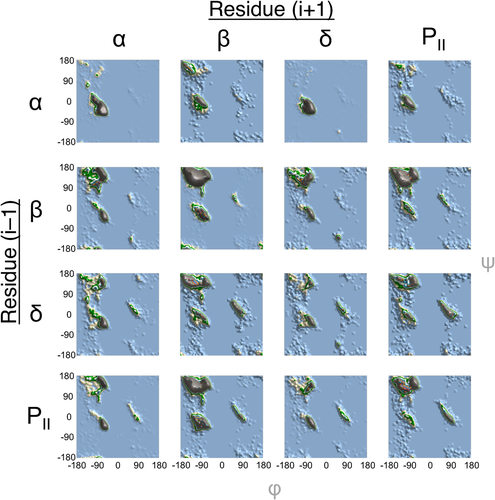
Because of the dominance of the α, β, δ, and PII regions, over 82% of the data are accounted for by the 16 conformational contexts in which a residue has neighbors in just these four regions. Again, if the Flory isolated pair hypothesis were true, then each of the 16 distributions in Figure 2 would be identical. However, many substantial differences are observed. For example, focusing on the PII region, some contexts, like β-X-α, roughly match the conventional PII distribution, but other contexts do not. The PII-X-δ residues prefer larger ϕ and smaller ψ values, δ-X-α residues mostly occupy the central part of the region, and the α-X-α and α-X-δ residues only minimally occupy the PII region but show an even lower preference for other major regions such as β or δ'. The origins of these preferences can also be studied by comparing the conformational preferences displayed in Figure 2 with the 101 common motifs that were identified in our original study.19 In that study, some two residue motifs starting or ending in the PII region were what we called conformational caps, that is a PII residue at the beginning or end of an alpha helix or beta strand. In the present distributions, such conformational caps can be observed to heavily bias the preferred conformation in the PII-X-α context so that the central residue is most commonly either a second PII residue or an α conformation meaning either the first or second residue serves as the conformational cap. Similar patterns can be observed after a residue in the α-X-PII or β-X-PII contexts, reinforcing the importance of the conformational cap motifs that were identified previously.

Dependence of a residue's conformation on those of its two neighbors. Conformations adopted by a central residue (residue i) in the context of neighboring residues on either side (i − 1 and i + 1) that are in one of the top four most populated regions. This subset of 16 tripeptide groups accounts for 82.8% of the full dataset. The populations of each group are as follows: αXα—59,596; αXβ—7,951; αXδ—6,160; αXPII—7,073; βXα—3,601; βXβ—34,525; βXδ—8,480; βXPII—12,846; δXα—11,253; δXβ—6,203; δXδ—3,933; δXPII—4,552; PIIXα—3,897; PIIXβ—11,877; PIIXδ—6,659; PIIXPII—7,198. Low contour levels in the observed distributions are colored blue (0–10), light brown (11–20), green (21–30), and white (31–40). Higher contours then use a repeated pattern of teal, orange, blue, red, green, and purple for every additional 10 observations.
Similarly, features in other broad regions throughout the plots can be related to insights from previous studies. For instance, in the β-region some contexts, such as β-X-α, show a preference for a small subregion with lower ϕ and higher ψ values while PII-X-β tripeptides occupy the full β-region (with the two distinct peaks corresponding to the lower and upper beta regions noted previously to exist as linear groups21). Similarly, the δ' region shows distinct subregions dependent on neighboring conformations, with the β-X-β and β-X-PII contexts strongly preferring the upper (high ψ) portion [i.e., the mirror image of the α region; Fig. 1(C)] and others mostly populating the lower portion or tail of the δ' region. The increased preference for the upper δ'-subregion in these contexts corresponds well with the conformational preferences of β-bulge motifs.19, 22
Smaller regions in conformational space also show some dependence on context, though the differences cannot be as striking as those in broadly populated regions. Both the α and δ regions are highly dependent on local hydrogen bonding patterns which can highly restrict the available conformations as seen in the α-X-α tripeptide which is dominated by helical structures such as the α- and 310-helix. Interestingly, in the same context, the ζ or pre-Pro region is a strong feature even though it is not highly populated on a global scale. This shift in distribution is due to the presence of proline-based helix caps in such helical contexts such as the L-shaped αα turn23 and proline α-C-Cap24 as identified in previous work.19 In a similar fashion, the relatively minor γ' region is more heavily pronounced in the β-X-β context than in any other distributions (Fig. 2). This makes clear that γ' turns are largely found not so much as a turn, but as a tight pleat in a β-strand.19
The potential value of accounting for conformational context in modeling
That the populations of conformations filling the major basins of the Ramachandran plot are a composite of many subpopulations with distinct behavior that depends on the conformations of neighboring residues is a new concept. And now, with large numbers of high accuracy protein structures available, it will be increasingly possible to define the discrete subpopulations (such as those in Fig. 2), to understand their origins, and to convert them to pseudopotentials that can aid protein modeling by replacing generic basin potentials with those that capture appropriate sub-basin details. Two examples of potential application areas are protein structure prediction/modeling and protein structure refinement programs.
With regard to predictive modeling of loop regions and complete protein domains, Rosetta has emerged as one of the most powerful tools available.25-27 During the model building process, successive fragments of protein structure from a local library are added to the growing polypeptide and further refinement of these structure includes an empirical ϕ,ψ-potential function that pushes residues to populate the global basins.27 Recently, Ting and coworkers13 showed that the ϕ,ψ-potential function could be improved using a context-based approach by separately analyzing Ramachandran distributions of a central residue in loop regions of proteins based on the residue types (i.e., amino acid identities) of its neighbors. Incorporation of these neighbor-delimited ϕ,ψ-potentials significantly improved the prediction of protein loop conformations.13 Notably, the conformation-dependent differences in Ramachandran distributions that we have documented here tend to be more substantial than the impact of neighboring residue types. This implies that by taking the conformational context of a residue's neighbors into account, the increase of accuracy of structure prediction programs will be larger than that observed by Ting et al.13
With regard to crystallographic refinement of lower resolution protein models, the PHENIX package28 initially used a single global Ramachandran potential that was applied to all residues regardless of identity or neighbor context.28 This approach was then improved by using distinct ϕ,ψ-potential functions based on four types of residue identity: general, proline, pre-proline and glycine.29 By further enhancing the information content of the ϕ,ψ-potential functions by accounting for neighboring residue conformations, the accuracy of this kind of refinement should increase still further. Such information could be incorporated during the later stages of refinement once the conformation of each residue has been fairly well determined. As suggested by a reviewer, it may also be that at such lower resolutions the application of this information to could be enhanced by formulating the relationships using virtual torsions based on the C-alpha positions that are better definable at low resolutions. As the number of available high-resolution structures continues to grow, it should be possible to more and more accurately define such information-rich potential functions that take into account both the identities and the conformations of a residue's neighbors.
ACKNOWLEDGMENTS
The authors thank Tom Poulos for critical feedback on the manuscript and the Poulos Group and Dale Tronrud for thoughtful discussions. We also thank all the crystallographers who have deposited their coordinates in the PDB and made studies like this possible.


