Shedding light on AT1G29480 of Arabidopsis thaliana—An enigmatic locus restricted to Brassicacean genomes
Funding information: This work was funded by the Deutsche Forschungsgemeinschaft (DFG, German Research Foundation) under Germany's Excellence Strategy—EXC-2048/1—project ID390686111 to PW, by a grant from the Australian Research Council (DP180102747) to ML, and by grants from the Canadian Natural Science and Engineering Research Council (RGPIN-04878-2015) and the Bill & Melinda Gates Foundation (C4 Rice) to TLS.
Abstract
A key feature of C4 Kranz anatomy is the presence of an enlarged, photosynthetically highly active bundle sheath whose cells contain large numbers of chloroplasts. With the aim to identify novel candidate regulators of C4 bundle sheath development, we performed an activation tagging screen with Arabidopsis thaliana. The reporter gene used encoded a chloroplast-targeted GFP protein preferentially expressed in the bundle sheath, and the promoter of the C4 phosphoenolpyruvate carboxylase gene from Flaveria trinervia served as activation tag because of its activity in all chlorenchymatous tissues of A. thaliana. Primary mutants were selected based on their GFP signal intensity, and one stable mutant named kb-1 with a significant increase in GFP fluorescence intensity was obtained. Despite the increased GFP signal, kb-1 showed no alterations to bundle sheath anatomy. The causal locus, AT1G29480, is specific to the Brassicaceae with its second exon being conserved. Overexpression and reconstitution studies confirmed that AT1G29480, and specifically its second exon, were sufficient for the enhanced GFP phenotype, which was not dependent on translation of the locus or its parts into protein. We conclude, therefore, that the AT1G29480 locus enhances the GFP reporter gene activity via an RNA-based mechanism.
1 INTRODUCTION
The formation of a photosynthetically active and prominent bundle sheath is the hallmark in the evolution of two-celled C4 species (Sage, 2004). Analyses of bundle sheath specific/preferential promoters of the dicotyledonous C4 species Flaveria trinervia, a member of the Asteraceae, had shown that these promoters maintain their expression preference even when introduced into the heterologous C3 Brassicaceae species Arabidopsis thaliana (Emmerling, 2018; Engelmann et al., 2008; Wiludda et al., 2012). These findings indicated that the gene regulatory systems of the bundle sheath are of an ancient evolutionary origin, suggesting that this C3 model species could be used for the identification of genes that are involved in general bundle sheath ontogeny and/or function. Therefore, we designed a genetic screen for the identification of genes affecting bundle sheath ontogeny or function based on a reporter gene that encoded a chloroplast-targeted GFP driven by the promoter of the GLDPA gene of F. trinervia; pGLDPAFt::TPRbcS-sGFP (Döring et al., 2019). The GLDPA gene of F. trinervia encodes the P subunit of the glycine decarboxylase, and in all C4 species analyzed so far, the expression of this photorespiratory gene is restricted to the bundle sheath (Bauwe, 2011; Sage et al., 2012). In Flaveria, it has been shown that this compartmentalized expression is a key factor in initiating the early steps in C4 evolution prior to the establishment of a functional C4 cycle (Schulze et al., 2013, 2016).
Using this reporter gene-based screening strategy and ethyl methanesulfonate as a mutagen, we have identified mutants with increased bundle sheath cell numbers (Döring et al., 2019). In the investigation reported here, we pursued an activation tagging approach to identify bundle sheath anatomy mutants based on deviation in reporter gene expression. Since we did not know whether the sizes and numbers of bundle sheath cells and/or their chloroplast numbers were determined cell-autonomously or by signaling from neighboring mesophyll cells, we used the promoter of the C4 phosphoenolpyruvate carboxylase gene of F. trinervia (p-ppcAFt) as an activation tag, which, in A. thaliana, is active in both mesophyll and bundle sheath tissues (Akyildiz et al., 2007).
The sole locus identified in this study, AT1G29480, had been catalogued as a putative gene consisting of two exons specific to the Brassicaceae but no function had been assigned. While no deviations in bundle sheath anatomy nor in other, non-bundle-sheath-related anatomical or morphological features could be observed in the mutant plants, further experiments indicated that overexpression of this locus affects the expression of the GFP reporter gene not by acting via protein, but rather at the RNA level.
2 MATERIALS AND METHODS
2.1 Plant transformations and growth conditions
All constructs were verified using restriction digestion and Sanger sequencing (LGC Genomics, Berlin, Germany). Constructs were introduced into Agrobacterium tumefaciens GV3101 strain by electroporation (Mersereau et al., 1990), and the A. thaliana reference line (Döring et al., 2019) was transformed following the floral dip method (Logemann et al., 2006). Plants were grown either at greenhouse conditions of 14 h light/day at a photon flux density (PFD) of ~300 μmol m−2 s−1 and at 21–22°C or in growth chambers operating at 16 h light/day (PFD: ~70 to 100 μmol m−2 s−1) and at a constant temperature of 21–22°C.
2.2 Activation tagging and selection of transgenic plants
To generate the activation tagging construct pMDC123-p-ppcAFt, the ppcAFt promoter region (Akyildiz et al., 2007; Stockhaus et al., 1997) comprising 2.181 kb of 5′-flanking region of the phosphoenolpyruvate carboxylase A gene from F. trinervia (p-ppcAFt), was synthesized with SacI and PmeI restriction sites added to the respective 5′- and 3′-ends of the p-ppcAFt sequence and then inserted into pUC57 (Biomatik, https://www.biomatik.com). The ppcAFt promoter fragment was isolated from the pUC57-p-ppcAFt plasmid by SacI/PmeI double digestion, and the fragment then inserted into SacI/PmeI-digested pMDC123 plasmid (Curtis & Grossniklaus, 2003), thereby replacing the gateway cassette with the ppcAFt promoter region. The resulting activation-tagging construct pMDC123-p-ppcAFt was then used to transform the reference line of A. thaliana that expresses the p- GLDPAFt::TPRbcS-sGFP chimeric reporter gene (Döring et al., 2019). T1 seeds were harvested, bulked, sown on soil, and watered with Basta® solution (Bayer Agrar, Germany) containing 80–100 mg/l Basta® and .1% (v/v) Tween 20. A single first leaf from each T1 plant (around 2 weeks old) was dissected and examined using a microscope fitted with a GFP filter (Axio Imager M2m, Zeiss, Oberkochen, Germany) for a deviation in GFP signal intensity with respect to GFP intensity in the first leaves of reference line plants.
2.3 Isolation of T-DNA flanking sequences
T-DNA flanking sequences of the kb-1 line were isolated by inverse PCR (iPCR). For this purpose, genomic DNA (gDNA) was extracted from T2 generation plants as described by Edwards et al. (1991), and the template for the iPCR was prepared by a modification of the method of Earp et al. (1990). In the modified protocol, 2.5 μg of gDNA were digested with HphI enzyme (cuts in the T-DNA) in a final reaction volume of 30 μl. The digested DNA fragments were then allowed to self-ligate by adding 10 U of T4 ligase, 25 μl 10× T4 ligase buffer and adjusting the final reaction volume to 250 μl with deionized water. The ligated products were precipitated by adding three volumes of 100% cold ethanol and .1 volume of 3-M sodium acetate (pH 5.6) and incubation at −80°C for 30 min. The precipitated DNA was recovered by centrifugation, washed once with chilled 70% ethanol, and dried. The DNA pellet was resuspended in 20-μl double deionized water and used as a template for iPCR. Nested PCR was performed using P1/P2 and P3/P4 primer pairs, which bind at the 3′-end of the ppcAFt promoter sequence (Table S1). The resulting PCR product was inserted into the pJET1.2 vector (Thermo Scientific, Germany) and its sequence determined at LGC Genomics (Berlin, Germany). The T-DNA integration site was identified following a BLAST search against the A. thaliana genome (TAIR10).
2.4 Overexpression constructs
All DNA fragments used in overexpression constructs were ultimately inserted into the modified pAUL1 destination vector (Lyska et al., 2013) downstream of either the ppcAFt or the GLDTFt promoters by following a standard Gateway protocol (Thermo Scientific, Germany). In brief, DNA fragments were first inserted into the Gateway donor vector pDONR207 in a BP reaction, and in a subsequent LR reaction between the entry clone and the destination vector pAUL1-p-ppcAFt or pAUL1-p-GLDTFt, the DNA fragments were fused to either the ppcAFt or the GLDTFt promoters.
2.4.1 Generating the ppcAFt and GLDTFt promoter pAUL1 plasmids
The p-ppcAFt promoter region was amplified from the pUC57-p-ppcAFt plasmid (see above) using the P5/P6 primer pair (Table S1) with 5′-HindIII and 3′-AscI restriction sites added and inserted into the HindIII/AscI digested pAUL1, which resulted in pAUL1-p-ppcAFt. Similarly, the 3.2 kb upstream sequence of the gene encoding the T-subunit of glycine decarboxylase (GLDT) of F. trinervia (Emmerling, 2018) was inserted into pAUL1 using 5′-HindIII and 3′-AscI restriction sites giving rise to pAUL1-p-GLDTFt.
2.4.2 Cloning of the AT1G29480 coding region and generating AT1G29480 variants
The predicted complete coding sequence (CDS) of the AT1G29480 gene model was amplified from the mutant kb-1 by reverse transcription-PCR (RT-PCR) using the specific primers P7 and P8 (Table S1) harboring 5′-attB1 and 3′-attB2 Gateway cloning sites. The 15 bp (with respect to ATG+1) before the T-DNA integration site were added to the forward primer. cDNA was synthesized using total RNA from leaves following the manufacturer's instructions (QuantiTect®Reverse Transcription Kit; Qiagen, Hilden, Germany) and the amplified AT1G29480 CDS was inserted downstream of both the ppcAFt and p-GLDTFt promoters generating p-ppcAFt::AT1G29480 and p-GLDTFt::AT1G29480. In the same manner, the truncated version of AT1G29480 (AT1G29480Δ15) was amplified (P9/P8 primer pair; Table S1) and fused to both p-ppcAFt and p-GLDTFt (p-ppcAFt::AT1G29480Δ15 and p-GLDTFt::AT1G29480Δ15).
To generate the AT1G29480 deletion constructs (p-GLDTFt::AT1G29480Δ90, p-GLDTFt::AT1G29480Δ144, p-GLDTFt::AT1G29480ΔE1, p-GLDTFt::AT1G29480Δ270, p-GLDTFt::AT1G29480Δ417, and p-GLDTFt::AT1G29480:16-417) AT1G29480Δ90, AT1G29480Δ144, AT1G29480ΔE1, AT1G29480Δ270, AT1G29480Δ417, and AT1G29480:16-417 sequences were PCR amplified using the primer pairs P10/P11, P12/P11, P13/P11, P14/P11, P15/P11, and P9/P12 (Table S1), respectively, and fused to p-GLDTFt.
For the construction of p-GLDTFt::AT1G29480* and p-GLDTFt::AT1G29480ΔE1*, all in-frame ATGs (at positions +1, +418, +466, +517, and +589) of the predicted AT1G29480 coding sequence (p-GLDTFt::AT1G29480*) and exon 2 sequence (at +418, +466, +517, and +589; p-GLDTFt::AT1G29480ΔE1*) were mutated by replacing every guanine residue with an adenine nucleotide (ATG/ATA) (synthesized by Biomatik). p-GLDTFt::AT1G29480** and p- GLDTFt::AT1G29480ΔE1** were generated by inserting a single thymine nucleotide between +55 and +56 bp of AT1G29480 CDS (p-GLDTFt::AT1G29480**) or between +31 and +33 bp of exon 2 (p- GLDTFt::AT1G29480ΔE1**) (synthesized by Biomatik).
2.4.3 AT1G29480 homologues
The predicted CDS of Aly-LOC9329632, Csa-LOC104743603, and Bra-LOC103828966 from Arabidopsis lyrata, Camelina sativa, and Brassica rapa, respectively, were extracted from the National Center for Biotechnology Information (NCBI) database and synthesized by Biomatik.
2.4.4 SAUR68 overexpression constructs
The coding sequence of SAUR68 was amplified from total leaf cDNA of the reference line (see above) with the primer pair P30/P31 (Table S1) and inserted downstream of the ppcAFt and GLDTFt promoters.
2.5 Generation of the Cab1 promoter-driven GFP reference line
The Cab1 promoter sequence of A. thaliana was isolated by PCR amplification of 2177 bp of the 5′-flanking region of AT1G29930 (Mitra et al., 2009) using the P32/P33 primer pair (Table S1) with 5′-HindIII and 3′-BamHI restriction sites added. The PCR product was double digested with HindIII/BamHI and ligated with an equally digested pBI121-p-GLDPAFt::TPRbcS-sGFP plasmid (Döring et al., 2019), thus replacing the p-GLDPAFt with the pCab1At promoter sequence. The resulting p-Cab1At::TPRbcS-sGFP reporter construct was transferred into wild type Col-0 by the floral dip method (Logemann et al., 2006) and homozygous p-Cab1At::TPRbcS-sGFP reporter lines were recovered. A homozygous p-Cab1At::TPRbcS-sGFP line was transformed with the p-GLDTFt::AT1G29480::E2 construct.
2.6 Sequence comparisons, alignments, and syntenic arrangements
Gene sequences and genomic contigs that shared homology with AT1G29480 based on BLASTN searches were obtained from NCBI and Phytozome 12 databases.
Pairwise comparisons were performed using the local alignment tool DiAlign (https://www.genomatix.de). To graphically visualize sequence conservation with the identified homologues, the predicted coding sequences of the respective genes and the genomic contigs (A. alpina) were submitted to the mVISTA web tool (http://genome.lbl.gov/vista). Sequences were aligned using the AVID global pairwise alignment program with 70% identity over 100 bp as a threshold parameter (Bray et al., 2003; Frazer et al., 2004).
To determine the conserved syntenic arrangement of AT1G29480 and its flanking sequences, the genomic segment of chromosome 1 of A. thaliana (10,302,650–10,330,800 bp), that is, ~15 kb upstream and ~13 kb downstream of the AT1G29480 locus, was compared with other Brassicaceae genomes. Arabidopsis halleri, A. lyrata, Capsella rubella, Capsella grandiflora, Boecheria stricta, Brassica oleracea, and B. rapa genomes were directly compared with the genomic segment of chromosome 1 of A. thaliana (10,302,650–10,330,800 bp) using JBrowse on the Phytozome12 platform. Sequence conservation was then visualized in VISTA-Point (http://genome.lbl.gov/vista) with 70% identity over a 100 bp window as a threshold parameter and syntenic blocks were identified (http://pipeline.lbl.gov/blockview/blockview/StartView.html). As C. sativa and A. alpina whole genome sequences are not available in Phytozome, the C. sativa NC_025689.1 RefSeq (chromosome 5) and A. alpina (chromosome 1 and 7) sequences showing homology to the AT1G29480 sequences were retrieved from the NCBI genome database. These sequences were submitted to mVISTA and later visualized for sequence conservation and syntenic arrangement as described above.
2.7 RNA isolation, semi-quantitative and quantitative RT-PCR
Total RNA from rosette leaves of 4-week-old plants grown in growth chambers was isolated using the RNeasy Plant Mini Kit (Qiagen, Hilden, Germany) according to the recommendations of the manufacturer. From the homozygous pGLDPAFt::TPRbcS-sGFP, kb-1, p-ppcAFt-AT1G29480-3-5, p-ppcAFt-AT1G29480-5-3, p-GLDTFt-AT1G29480-6-1, and p-GLDTFt-AT1G29480-8-1 lines, leaves from five seedlings were pooled. RNA quality was verified by agarose gel electrophoresis, and single-stranded cDNA was synthesized using 1-μg total RNA and the QuantiTectReverse Transcription Kit (Qiagen, Hilden, Germany).
To measure transcript abundance of AT1G29480 with ACTIN-7 as an endogenous control semi-quantitative reverse transcription PCR (RT-PCR) was performed (30 cycles) using 1 μl of 1:25 diluted cDNA and 1.0 units of Phusion polymerase (New England BioLabs) in 50 μl reaction volume. We did not perform quantitative PCR (qPCR) as we could not amplify AT1G29480 transcripts from the reference line.
To quantify GFP, SAUR68, SAUR67, and SAUR66 transcripts in the reference, kb-1, p-ppcAFt-AT1G29480-3-5, p-ppcAFt-AT1G29480-5-3, p-GLDTFt-AT1G29480-6-1, and p-GLDTFt-AT1G29480-8-1 lines, quantitative PCR (qPCR) was performed using a Kapa Biosystem PCR Kit (Merck, Darmstadt), 25-fold diluted cDNA as a template, and ACTIN-1 as an endogenous control. The 2−ΔΔCt method (Kubista et al., 2006) was used to calculate relative transcript levels and an unpaired parametric t test was performed on ΔCt values.
AT1G29480, ACTIN-7, GFP, SAUR68, SAUR66, SAUR67, and ACTIN-1 transcripts were measured using P16/P17, P18/P19, P22/P23, P24/P25, P26/P27, P28/P29, and P20/P21 primer pairs, respectively (Table S1).
2.8 Quantification of GFP signal intensity
GFP fluorescence images were captured by using the Axio Imager M2m microscope (Zeiss, Oberkochen, Germany). In all experiments, GFP fluorescence leaf images of reference and respective AT1G29480 overexpression lines were captured applying the same exposure settings. The microscope was equipped with two cameras. Pictures for quantification were taken with the black and white camera AxioCam MRm for all analyzed constructs. In addition for all constructs in the p-GLDPAFt::TPRbcS-sGFP line pictures for GFP visualization were taken with the color camera AxioCam ICc 5. For the analysis in the p-Cab1At::TPRbcS-sGFP line only black and white pictures were taken. Every time reference and kb-1 plants were grown along with overexpression lines. For each line or T1 family, the first leaves of 10–20 plants were analyzed. GFP fluorescence images were quantified by using ImageJ software (Schneider et al., 2012). GFP signal intensities were then normalized to 100-μm2 leaf area and statistical tests were performed on normalized values. Prism 9 software was used to perform pairwise comparisons using unpaired nonparametric t test (Mann–Whitney test). To calculate the fold difference in signal intensity, reference line signal intensity was set to one.
2.9 Light microscopy of reference and kb-1 lines
For the microscopical analysis of leaf anatomy, the middle part of the second leaf from around 4 weeks old plants was cut into 1- to 2-mm2 pieces and prepared as described by Khoshravesh et al., 2017. A Zeiss Axiophot light microscope equipped with a DP71 Olympus camera and Olympus CellSens imaging software (Advanced Microscopy Techniques, MA, USA) was used to capture images.
2.10 Scanning electron microscopy of reference and kb-1 lines
Leaf samples (~2 mm2) were harvested from 4-week-old plants around 4 h into the photoperiod and immediately fixed in 2% (v/v) glutaraldehyde and 2% (w/v) formaldehyde in .05 M (NaCac) buffer (pH 7.4) containing 2-mM calcium chloride. Mature leaves of equivalent age were selected for all plants and samples were taken approximately halfway along the leaf. Samples were vacuum infiltrated overnight, washed five times in ddH2O, and osmicated in 1% (v/v) osmium tetroxide, 1.5% (w/v) potassium ferricyanide in .05 M NaCac buffer for 3 days at 4°C. Samples were washed five times in ddH2O and post-fixed in .1% (w/v) thiocarbohydrazide in .05 M NaCac buffer for 20 min at room temperature in the dark. The samples were washed five times in ddH2O and osmicated for a second time for 1 h in 2% (v/v) osmium tetroxide in .05-M NaCac buffer at room temperature. Samples were washed five times in ddH2O and subsequently stained in 2% (w/v) uranyl acetate in .05-M maleate buffer (pH 5.5) for 3 days at 4°C and washed five times afterwards in ddH2O. Samples were dehydrated in an ethanol series, transferred to acetone, and last to acetonitrile. Leaf samples were embedded in Quetol 651 resin mix (TAAB Laboratories Equipment Ltd). For scanning electron microscopy, ultrathin-sections were placed on plastic coverslips, which were mounted on aluminum SEM stubs, sputter-coated with a thin layer of iridium and imaged in a Verios 460 scanning electron microscope (FEI).
3 RESULTS
3.1 Activation tagging screen identified one novel gene AT1G29480
Chloroplasts in bundle sheath cells of A. thaliana were labeled with GFP using the pGLDPAFt::TPRbcS-sGFP construct (Döring et al., 2019). In the reference line used throughout the experiments the pGLDPAFt::TPRbcS-sGFP chimeric gene is inserted in the middle of the gene AT2G29200.1 on chromosome 2 as revealed during the SHORE mapping experiments described in Döring et al. (2019) and depicted in Figure S1. Plants of the homozygous reference line were then subjected to an activation tagging screen. This design was adopted as we reasoned that the chloroplast-localized GFP fluorescence intensity should correlate with chloroplast number and/or volume. The p-ppcAFt was used as an activation tag (Akyildiz et al., 2007; Stockhaus et al., 1997) and candidate mutant plants with an altered GFP fluorescence selected (Döring et al., 2019). Approximately 800 A. thaliana reference plants were transformed with this activation-tagging construct. In the T1 generation, about 8600 transgenic plants were screened for altered GFP signal intensity, and 165 primary mutants with either enhanced or reduced signal intensity selected. In the T2 generation, of the 165 primary mutant plants only one mutant (kumari billakurthi-1 [kb-1]) with a stable phenotype and a 3:1 segregation ratio was recovered.
The kb-1 mutant line showed increased GFP signal intensity in the bundle sheath strands of A. thaliana leaves (Figure 1a), with approximately a 1.7-fold enhancement compared with the reference line (Figure 1b). Consistent with the increased GFP signal intensity, GFP transcript levels were also increased in the mutant line (Figure 1c). To locate the T-DNA integration site of kb-1, inverse PCR was carried out. Upon mapping the sequence of the PCR product to the A. thaliana whole genome database (TAIR10), the T-DNA region was found to be located inside the coding region of an unannotated gene AT1G29480. Specifically, the T-DNA had inserted 15 bp downstream of the predicted translational ATG start codon in the 5′ to 3′ direction of the gene (Figure 1d). According to TAIR10, AT1G29480 consists of two exons of 174 and 504 bp in length, respectively, separated by a 98-bp intronic region (Figure 1d). The genomic context of AT1G29480 on chromosome 1 is presented in Figure 1e. To our knowledge, expression of this gene in leaves of A. thaliana has not been reported (TAIR10).
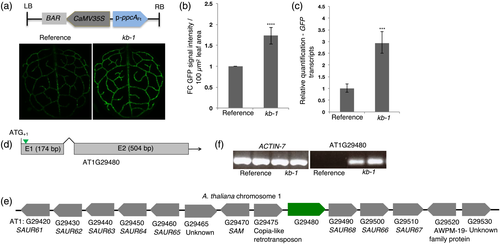
To understand the effect of the ppcAFt promoter insertion on AT1G29480 expression, semi-quantitative reverse transcription PCR (RT-PCR) was conducted using total RNA from leaves of both reference and mutant lines. While a robust PCR product was detected from the mutant kb-1, the amplicon was undetectable in the reference line (Figure 1f). Thus, insertion of p-ppcAFt in AT1G29480 resulted in its activation. Relative to the reference line, transcript levels of SMALL AUXIN UPREGULATED 68 (SAUR68), which is immediately downstream of AT1G29480 were increased about 60 times in the kb-1 mutant line, but transcript levels of the following two downstream genes, SAUR66 and SAUR67, were only slightly enhanced (Figure S2a).
To verify whether the insertion of the ppcAFt promoter into AT1G29480 and its resulting overexpression was the causative event for the kb-1 phenotype, the complete coding sequence and a truncated version of AT1G29480 lacking the first 15 bp (AT1G29480Δ15) of the predicted coding sequence were fused to the ppcAFt promoter (p-ppcAFt::AT1G29480 and p-ppcAFt::AT1G29480Δ15) and used to transform the reference line. Additionally, the respective sequences were specifically expressed in bundle sheath strands using a promoter from the gene encoding the T-subunit of glycine decarboxylase of F. trinervia (p-GLDTFt::AT1G29480 and p-GLDTFt::AT1G29480Δ15; Figure 2a). The promoter of GLDTFt is a bundle sheath preferential promoter both in the C4 species Flaveria bidentis and in the C3 plant A. thaliana and is also, to varying degrees, active in the vascular tissue (Emmerling, 2018). For each of the p-ppcAFt::AT1G29480, p-ppcAFt::AT1G29480Δ15, p-GLDTFt::AT1G29480, and p-GLDTFt::AT1G29480Δ15 overexpressing lines at least 30 T1 transgenics were analyzed, and in all cases a strong GFP signal in the bundle sheath strands was found, thus recapitulating the kb-1 mutant phenotype (Figure 2b,c). Moreover, GFP transcripts were more abundant in both the p-ppcAFt::AT1G29480 and p-GLDTFt::AT1G29480 overexpression lines (Figure 2d). An enhanced GFP signal intensity of the reference line was also achieved when AT1G29480 and AT1G29480Δ15 were constitutively expressed using the CaMV35S promoter (Figure S3).
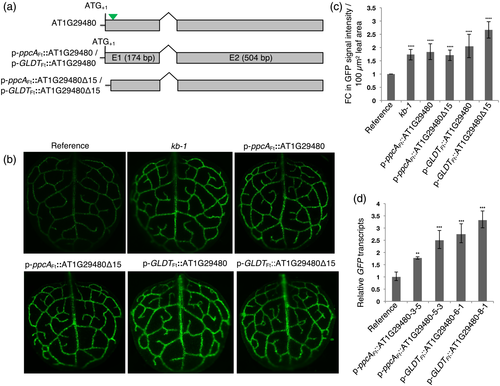
As transcript levels of the downstream SAUR68, SAUR66, and SAUR67 genes were increased in the kb-1 mutant relative to the reference line (Figure S2a), the transcript abundance of these genes was measured in the leaves of two independent homozygous p-ppcAFt::AT1G29480 overexpression lines. However, the transcript amounts of SAUR68, SAUR66, and SAUR67 did not differ significantly from those of the reference line (Figure S2a). In addition, overexpression of SAUR68 (p-ppcAFt::SAUR68 and p-GLDTFt::SAUR68) in the reference line did not lead to an increase in GFP signal intensity (Figure S2b).
We conclude from the above results that the kb-1 phenotype can be reproduced by either overexpression of the entire predicted coding sequence (AT1G29480) or a truncated version (AT1G29480Δ15). This implies that the predicted translational start codon of AT1G29480 is not necessary for the enhanced expression of the GFP reporter gene in the p-GLDPAFt::TPRbcS-sGFP reference line. Moreover, expression of AT1G29480 or AT1G29480Δ15 in the bundle sheath and vascular cells of A. thaliana is also sufficient to reconstitute the GFP fluorescence phenotype of the original kb-1 mutant. Therefore, in subsequent experiments the GLDTFt promoter was used instead of the ppcAFt promoter.
No phenotypic perturbations to plant growth or appearance were observed in kb-1 (Figure S4a). To assess whether anatomical deviations were associated with the kb-1 mutant, leaves were examined by light and electron microscopy. Qualitative observations indicated the leaf anatomy of the kb-1 and the reference line were similar and in addition, no distinguishable differences were observed in the chloroplasts of bundle sheath and mesophyll cells (Figure S4b–d).
3.2 AT1G29480 nucleotide sequence and functional conservation
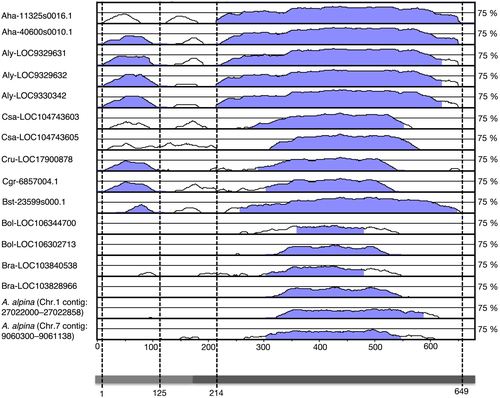
BLASTN searches (National Center for Biotechnology Information (NCBI) and Phytozome) were performed to identify sequences homologous to AT1G29480. These searches revealed that AT1G29480 homologues are restricted to the Brassicaceae and were found in A. halleri (Aha-11325s0016.1 and Araha-40600s0010.1), A. lyrata (Aly-LOC9329631, Aly-LOC9329632 and Aly-LOC9330342), C. sativa (Csa-LOC104743603 and Csa-LOC104743605), C. rubella (Cru-LOC17900878), C. grandiflora (Cgr-6857s0004.1), Boechera stricta (Bst23599s0001.1), B. oleracea (Bol-LOC106344700 and Bol-LOC106302713), B. rapa (Bra-LOC103840538 and Bra-LOC103828966), and Arabis alpina (sequence contigs on chromosome 1 (2,702,200–27,022,858 bp) and 7 (9,060,300–9,061,138 bp)). The predicted gene models of the identified AT1G29480 homologues and their sequence similarities to AT1G29480 (based on local pairwise alignment using DiAlign; https://www.genomatix.de/cgi-bin/dialign/dialign.pl) are shown in Figure S5. Additionally, homology was found to an intergenic sequence on chromosome 4 of A. thaliana between nucleotides 7,822,800 and 7,821,800 bp (nucleotide numbers as per TAIR10) and between AT4G13455 and AT4G13460.
To better visualize sequence conservation, an mVISTA plot (Bray et al., 2003; Frazer et al., 2004) was generated using the predicted coding regions of the AT1G29480 homologues and the sequence contigs that were identified in A. alpina. AT1G29480 coding sequence was used as a reference. Two conserved peaks were found (Figure 3), one in exon 1 (1–125 bp, with respect to ATG+1) and a second in exon 2 (214–657 bp). Exon 2 shows higher sequence conservation than exon 1 across the examined Brassicaceae species (Figure 3). Moreover, in Brassicacean homologues containing more than two exons (Aha-11325s0016.1, Araha-40600s0010.1, Aly-LOC9329631, Aly-LOC9329632, Aly-LOC9330342, Csa-LOC104743603, Csa-LOC104743605, Cru-LOC17900878, Cgr-6857s0004.1, and Bst-23599s0001.1; Figure S6) the exon 2 sequence of AT1G29480 is shared between two exons, suggesting that exon 2 of the AT1G29480 locus of A. thaliana is a fusion of the two exons found in the homologues of the other Brassicacean species. Despite this conservation in sequence, a search for conserved functional domains (NCBI-CD, Prosite, Pfam) did not result in any matches.
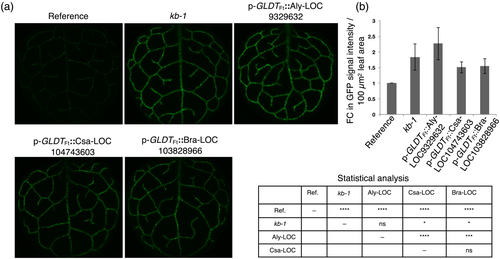
To understand this sequence conservation at a functional level, AT1G29480 homologues from the closely related species A. lyrata (Aly-LOC9329632) and C. sativa (Csa-LOC104743603) as well as from the distantly related B. rapa (Bra-LOC103828966) were expressed in the reference line under the control of the GLDTFt promoter (p-GLDTFt::Aly-LOC9329632, p-GLDTFt::Csa-LOC104743603 and p-GLDTFt::Bra-LOC103828966). From each construct, at least 30 T1 transgenic plants were analyzed. The overexpression of p-GLDTFt::Aly-LOC9329632 mimicked the kb-1 phenotype completely (Figure 4a), and its GFP signal intensity was indistinguishable from that of kb-1 (Figure 4b). Overexpression of p-GLDTFt::Csa-LOC104743603 and p-GLDTFt::Bra-LOC103828966 also resulted in an increase of GFP signal intensity but only to about 50% when compared to the reference line (Figure 4a,b); that is, in this case the kb-1 phenotype was partially mimicked. These data indicate that depending on the phylogenetic divergence from AT1G29480 its Brassicacean homologues can produce a similar GFP fluorescence phenotype.
3.3 Is an AT1G29480-derived RNA responsible for enhancing reporter gene expression?
The T-DNA integration between nucleotides +15 and +16 of AT1G29480 in kb-1 destroyed the translation of the gene product from the predicted first ATG (ATG+1). Moreover, 5′-rapid amplification of cDNA ends (RACE) (data not shown) results using total leaf RNA from the kb-1 line were consistent with what has been reported previously for transcription initiation of the C4 isoform gene of phosphoenolpyruvate carboxylase (ppcAFt) in the C4 species F. trinervia (Ernst & Westhoff, 1997; Hermans & Westhoff, 1992). As a consequence, there is no upstream ATG that could act as a translational start codon for the downstream sequence of AT1G29480. As an increased GFP signal intensity was obtained either by overexpression of a complete (AT1G29480) or a truncated (AT1G29480Δ15) coding sequence (Figure 2), it follows that the predicted ATG+1 is not necessary for AT1G29480 function.
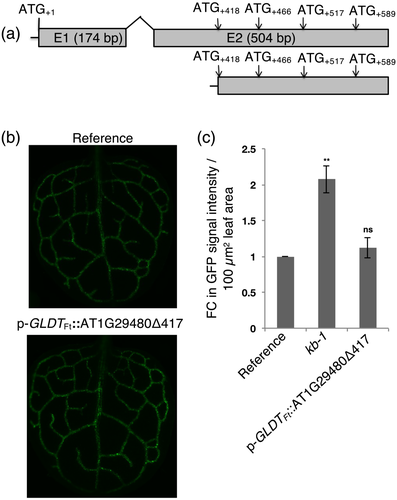
Sequence alignments indicated that a second in-frame ATG, located in exon 2 of AT1G29480 (ATG+418; with respect to ATG+1) is highly conserved among the Brassicaceae homologues (Figure S6). We therefore hypothesized that the predicted AT1G29480 gene model is not correct and that the second ATG (ATG+418) might act as a translational start site. To test this hypothesis, the second predicted open reading frame (ORF) of the AT1G29480 (+418 to +678 bp; Figure 5a) was expressed under the control of p-GLDTFt (p-GLDTFt::AT1G29480Δ417) in the reference line. About 30 T1 transgenics were analyzed, and their GFP signal intensities were found to be indistinguishable from the reference line (Figure 5b,c). Thus, the mutant GFP fluorescence phenotype could not be recapitulated by overexpression of the second predicted ORF alone. This finding suggested that the translation of AT1G29480 into a protein might not be required for the enhancement of GFP expression.
To confirm this notion, the necessity of ATG codons present in AT1G29480 for generating the GFP fluorescence phenotype was scrutinized. The constructs p-GLDTFt::AT1G29480* and p-GLDTFt::AT1G29480** were prepared and used to transform the reference line. In the p-GLDTFt::AT1G29480* construct all in-frame ATGs of AT1G29480 were made functionless as start codons by replacing guanines with adenines (ATG/ATA; methionine/isoleucine; Figure 6a). In the p-GLDTFt::AT1G29480** construct, the AT1G29480 reading-frame was shifted by the insertion of a thymine between +55 and +56 base pairs with respect to ATG+1 (Figure 6a).
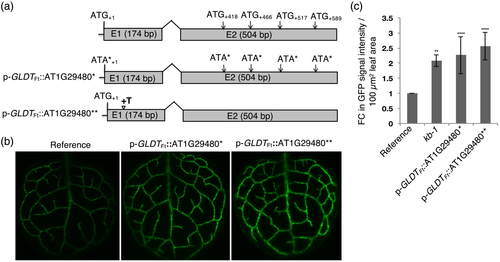
About 30 T1 transgenic plants for each construct were analyzed for their GFP signal intensities. Both the p-GLDTFt::AT1G29480* and the p-GLDTFt::AT1G29480** overexpression lines showed enhanced GFP signal intensity (Figure 6b,c), thus recapitulating the kb-1 mutant phenotype. We conclude from these results that the enhancement of GFP expression is not dependent on the translation of the predicted AT1G29480 ORFs into a protein.
3.4 AT1G29480 exon 2 is responsible for reporter gene activity
We next investigated which region of AT1G29480, when overexpressed, is important for increasing the GFP reporter gene output. Several deletion constructs were generated (Figure 7a) and expressed in the reference line under the control of p-GLDTFt. The p-GLDTFt::AT1G29480Δ90, p-GLDTFt::AT1G29480Δ144, and p-GLDTFt::AT1G29480ΔE1 overexpression lines mimicked the kb-1 mutant phenotype, whereas further deletion of 95 bp from the 5′-end of exon 2 (p-GLDTFt::AT1G29480Δ270 overexpression line) resulted in ~50% reduction of the GFP signal intensity compared with the mutant line (Figure 7b,c). The strong GFP phenotype was not recapitulated by overexpression of the p-GLDTFt::AT1G29480:16-417 nucleotide region alone (Figure 7b,c).
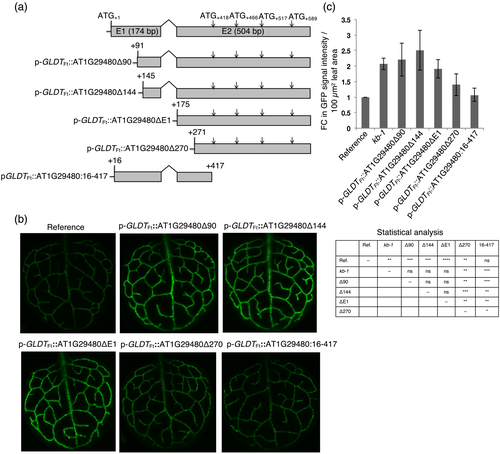
These results suggested that regions of AT1G29480 exon 1 are not necessary for the high GFP signal phenotype but that the complete exon 2 region is required. We therefore designed an overexpression construct that contained the exon 2 sequence alone but with all ATGs replaced by ATAs (p-GLDTFt::AT1G29480ΔE1*). In another construct the reading frame was shifted by inserting a thymine residue between nucleotides +32 and +33 of the exon 2 sequence (p-GLDTFt::AT1G29480ΔE1**). In both cases, the GFP signal intensity of the reference line was enhanced in a similar manner to that found in kb-1 (Figure S7). The most parsimonious explanation for these results is that (1) the observed GFP expression phenotype is due to an RNA derived from the AT1G29480 locus and that (2) the overexpression of exon 2 is sufficient.
3.5 AT1G29480 overexpression enhances expression of a Cab1At promoter-driven GFP reporter gene
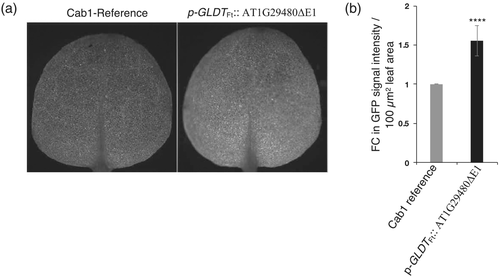
To address the question whether the GLDPAFt promoter is the putative target of AT1G29480 action, another reporter line was constructed in which the GLDPAFt promotor was replaced by the Cab1 promoter of A. thaliana (p-Cab1At::TPRbcS-sGFP). The Cab1 gene encodes the chlorophyll a/b binding protein 1 (Cab1, AT1G29930) of A. thaliana, and its promoter is active in all photosynthetic cells of the leaf (Mitra et al., 2009).
A homozygous reporter line containing the p-Cab1At::TPRbcS-sGFP chimeric gene construct was transformed with the p-GLDTFt::AT1G29480ΔE1 construct and about 30 T1 plants were analyzed for GFP fluorescence. It was found that AT1G29480 overexpression also increased the activity of this reporter gene by about 1.5-fold (Figure 8a,b) suggesting that the GFP fluorescence enhancing properties of AT1G29480 overexpression are not restricted to the GLDPAFt promoter.
4 DISCUSSION
In the course of an analysis that initially aimed to identify novel regulators of bundle sheath ontogeny, we identified a single exon of a previously uncharacterized Arabidopsis gene model from Arabidopsis that affects the signal from the widely used reporter gene encoding GFP. Our approach was based on activation tagging using a reporter line in which bundle sheath chloroplasts had been labeled by GFP (Döring et al., 2019). We mutagenized about 800 plants, screened 8600 T1 plants and obtained 165 primary mutant candidates. One mutant named kb-1 was retained that showed a robustly enhanced expression of the GFP reporter gene in bundle sheath strands. The relatively low yield of stable mutants obtained in the screen is comparable to another activation tagging screen in which the bundle sheath preferential GLDT promoter was used as an activation-tag (Döring, 2017). In contrast to the latter screen (Döring, 2017), the mutant obtained in this study, kb-1, did not show any deviations in bundle sheath ontogeny or structure. However, the locus that was targeted in kb-1 by the p-ppcAFt activation tag, AT1G29480, had not yet been studied and its function was unknown.
AT1G29480 exhibits an exon-intron-like structure and therefore has been assigned by the TAIR10 database to represent a putative protein-coding gene. According to the organ and developmental stage specific transcriptome datasets of Arabidopsis, AT1G29480 transcripts are confined to anthers but are present in only minor amounts (Kawakatsu et al., 2016; Klepikova et al., 2016). AT1G29480 transcripts were also undetectable in single cell RNA sequencing data sets of Arabidopsis leaf and root (Kim et al., 2021; Ma et al., 2020). Our own RT-PCR analyses with RNA from leaves of the reference line confirm these observations (Figure 1f), reinforcing the notion that the AT1G29480 locus is largely transcriptionally silent (except in anthers).
Insertion of the ppcA promoter of the C4 Asteracean species F. trinervia (ppcAFt) which in A. thaliana is active in both mesophyll and bundle sheath cells (Akyildiz et al., 2007) into the 5′-part of exon 1 of AT1G29480 activated its transcription in the chlorenchymatous tissues of A. thaliana leaves. This transcriptional activation was associated with an enhanced activity of the GFP reporter gene whose transcription was driven by the bundle sheath preferential GLDPA promoter of F. trinervia (Engelmann et al., 2008; Wiludda et al., 2012). Overexpression of the complete coding region of AT1G29480 by either the ppcAFt promoter or the bundle sheath preferential GLDT promoter of F. trinervia (Emmerling, 2018) similarly increased the GFP signal intensity in the reference line. Transcript levels of SAUR68, which is located downstream from AT1G29480, were about the same in the overexpression and reference lines but were increased by about 60 times in kb-1 as compared to the reference line (Figure S2a). However, overexpression of SAUR68 did not affect the GFP signal intensity of the p-GLDPAFt::TPRbcS-sGFP reference line (Figure S2b) demonstrating that SAUR68 does not contribute to the GFP fluorescence phenotype. In summary, once the AT1G29480 locus of A. thaliana becomes transcriptionally upregulated, both in its entirety as defined by the gene model of TAIR10 or partially as in kb-1, the activity of the GLDPA promoter driven GFP reporter gene is increased.
AT1G29480-homologous sequences were found only in Brassicaceae genomes including those of A. halleri, A. lyrata, C. sativa, C. rubella, C. grandiflora, B. stricta, B. oleracea, B. rapa, and A. alpina (Figure S5). As in A. thaliana, transcription of the AT1G29480 homologues of A. lyrata (Aly-LOC9329631, Aly-LOC9329632, and Aly-LOC9330342) appears to be restricted to inflorescences (Rawat et al., 2015). By contrast, no reads from organ specific transcriptome datasets of C. sativa, C. rubella, B. oleracea, and B. rapa were mapped to the AT1G29480 locus. In A. thaliana, the AT1G29480 locus is embedded in an array of SAUR genes (Figure 1f). This arrangement is also found in the genomes of A. halleri, A. lyrata, C. sativa, C. rubella, and C. grandiflora, which are all clustered in lineage 1 of the Brassicaceae molecular phylogeny, and in the genome of A. alpina (lineage IV). This synteny is not maintained in B. stricta (lineage I) and the two Brassica species B. oleracea and B. rapa (lineage II) (Figure S8; Nikolov et al., 2019).
Exon 2 sequences of AT1G29480 and its homologues are highly conserved, whereas the exon 1 region diverges rapidly outside of the Arabidopsis genus (Figure 3). The degree of sequence conservation of the exon 2 region in the Brassicaceae species is reflected in its capability to enhance the GFP reporter gene signal intensity when overexpressed in the p-GLDPAFt::TPRbcS-sGFP reference line. Overexpression of the AT1G29480 homologue of A. lyrata resulted in a similar enhancement of reporter gene activation as that found for AT1G29480 from A. thaliana, whereas the AT1G29480 homologues of C. sativa and B. rapa only partially recapitulated the kb-1 phenotype (Figure 4). These findings suggest that the activation capacity of AT1G29480 resides in exon 2 and indeed, a deletion series of AT1G29480 overexpression constructs (Figure 7) confirmed the notion that exon 2 of AT1G29480 is central to increasing the activity of the GLDPA promoter-driven GFP reporter gene.
By which molecular mechanism could the overexpression of AT1G29480 or its exon 2 segment enhance the expression of the GLDPA promoter-driven reporter gene? When constructs lacking all in-frame translational start codons or containing a frameshift mutation were overexpressed in the reference line (Figures 6 and S6) the GFP reporter gene activity was enhanced. This finding indicated that AT1G29480 and its exon 2 segment do not exert function by being translated into protein suggesting that it functions at the RNA level.
We hypothesized that the 1571-bp-long 5′-flanking region of the GLDPA gene with its complex interweaving of transcriptional and post-transcriptional control (Schulze et al., 2013; Wiludda et al., 2012) could be the target of AT1G29480 RNA action.
To test this hypothesis, a Cab1At promoter-driven GFP reporter gene was investigated for its sensitivity to AT1G29480 overexpression. The data obtained indicate that the activity of this GFP reporter gene can also be enhanced by AT1G29480 overexpression, suggesting that the effects are not promoter-specific.
Several other mechanisms can be imagined by which an AT1G29480 non-coding RNA could interfere with transcriptional or post-transcriptional control mechanisms. AT1G29480 RNA could target other modules of the p-GLDPAFt::TPRbcS-sGFP and p-Cab1At::TPRbcS-sGFP reporter genes, for instance the 3′-untranslated regions such as the nopaline synthase terminator (NOS) or the coding region TPRbcS-sGFP that are common to both constructs. The 3′-untranslated regions used in chimeric gene design also contain polyadenylation motifs necessary for transcription termination coupled with RNA 3′-end modification (Proudfoot, 2011). A recent study by Andreou et al. (2021) highlighted the role of terminator sequences in transgene regulation. Their study indicated that promoters and terminators interact with each other synergistically and that the association of the NOS terminator sequence with different promoters may differentially influence reporter gene expression (Andreou et al., 2021). Whether AT1G29480 mediates its effect on GFP expression via mechanisms such as these will require further analysis.
Long non-coding RNAs (lncRNAs) (Erdmann et al., 2000; Quinn & Chang, 2016; Wen et al., 2007) are well known to regulate gene expression at the transcriptional, post-transcriptional or translational levels mediated by different mechanisms including RNA–protein, RNA–DNA, and RNA–RNA interactions (Li et al., 2016; Quinn & Chang, 2016; Yoon et al., 2013). For instance, HID1 (HIDDEN TREASURE 1) lncRNA of A. thaliana represses PHYTOCHROME INTERACTING FACTOR 1 transcription (Wang et al., 2014). Another well-characterized plant lncRNA is cold induced lncRNA (COOLAIR); it promotes the transcriptional shutdown of the FLC (FLOWERING LOCUS C) locus during vernalization by mediating the coordinated switching of chromatin states at that locus (Csorba et al., 2014). In contrast, perfect complementarity (73-bp region) of mouse antisense Uchl1 (ubiquitin carboxyterminal hydrolase L1) lncRNA with the 5′-end of the Uchl1 mRNA, enhances the formation of active polysomes on Uchl1 mRNA and hence its translation (Carrieri et al., 2012). Hence, a direct impact on the expression of the reporter gene via an enhancement or even an indirect influence through the reduction of a yet elusive factor that then loses its inhibiting effect on the expression of the reporter gene could be possible. However, no relationship was found between the AT1G29480 RNA sequence and any known family of non-coding RNAs based on searches with non-coding RNA web-tools (PLncDB, GREENC, NONCODE, CANTATAdB, PNRD, PlantNATsDB, and Rfam). Furthermore, no obvious RNA structural features were found for AT1G29480 RNA and its homologues from other Brassicaceae species (mfold and RNAalifold), nor did we find any complementarity between transcripts from the GLDPA or the Cab1 promoters with AT1G29480 RNA.
In summary, we report the functional analysis of a previously uncharacterized gene model from A. thaliana. We show that the AT1G29480 locus is confined to the Brassicaceae with its exon-2 equivalent being well conserved. We demonstrate a robust impact of AT1G29480 on the expression of a GFP transgene and show that this effect is caused by the exon-2 part of the locus and mediated by RNA rather than protein. The details of this RNA-dependent mechanism remain unclear, and the endogenous role of the AT1G29480 locus is still an enigma.
ACKNOWLEDGMENTS
We thank Dr. Florian Döring, Dr. Udo Gowik, and Torben Lauck for providing the sequencing data for the genomic location of the GFP reporter gene within the reference line. We thank Dr. Karin Müller, Lyn Carter, and Dr. Filomena Gallo from the Cambridge Advanced Imaging Centre (CAIC) of the University of Cambridge for embedding the electron microscopy samples, producing the scanning electron microscope images, and for providing access to microscopes.
CONFLICT OF INTEREST
The authors have no conflicts to declare.
AUTHOR CONTRIBUTIONS
K. B., S. S., and P. W. designed the research. K. B., S. S., E. L. M. S., T. L. S., and T. B. S. performed the research. K. B., S. S, M. L., J. H., and P. W. wrote the manuscript.
Open Research
DATA AVAILABILITY STATEMENT
All data supporting the findings of this study are available within the paper and within its supporting information data published online.


