Lack of plastid-encoded Ycf10, a homolog of the nuclear-encoded DLDG1 and the cyanobacterial PxcA, enhances the induction of non-photochemical quenching in tobacco
Mai Duy Luu Trinh and Akira Hashimoto contributed equally to this work.
Abstract
pH homeostasis in the chloroplast is crucial for the control of photosynthesis and other metabolic processes in plants. Recently, nuclear-encoded Day-Length-dependent Delayed Greening1 (DLDG1) and Fluctuating-Light Acclimation Protein1 (FLAP1) that are required for the light-inducible optimization of plastidial pH in Arabidopsis thaliana were identified. DLDG1 and FLAP1 homologs are specifically conserved in oxygenic phototrophs, and a DLDG1 homolog, Ycf10, is encoded in the chloroplast genome in plant cells. However, the function of Ycf10 and its physiological significance are unknown. To address this, we constructed ycf10 tobacco Nicotiana tabacum mutants and characterized their phenotypes. The ycf10 tobacco mutants grown under continuous-light conditions showed a pale-green phenotype only in developing leaves, and it was suppressed in short-day conditions. The ycf10 mutants also induced excessive non-photochemical quenching (NPQ) compared with those in the wild-type at the induction stage of photosynthesis. These phenotypes resemble those of Arabidopsis dldg1 mutants, suggesting that they have similar functions. However, there are distinct differences between the two mutant phenotypes: The highly induced NPQ in tobacco ycf10 and the Arabidopsis dldg1 mutants are diminished and enhanced, respectively, with increasing duration of the fluctuating actinic-light illumination. Ycf10 and DLDG1 were previously shown to localize in chloroplast envelope-membranes, suggesting that Ycf10 and DLDG1 differentially control H+ exchange across these membranes in a light-dependent manner to control photosynthesis.
1 INTRODUCTION
Photosynthesis, which is carried out in chloroplasts, is divided into two distinct reactions, the electron transfer reaction and CO2 fixation. The light-harvesting chlorophyll-protein complexes (LHCII) absorb light energy, and the energy is transmitted into photosystem II (PSII), where water oxidation takes place. Electrons derived from the water molecules are transmitted from plastoquinone, to the cytochrome b6f complex (Cytb6f), to plastocyanin (PC), to photosystem I (PSI), to ferredoxin (Fd), and finally to the ferredoxin-NADP+ oxidoreductase to reduce NADP+ to form NADPH. Photosynthetic electron transfer causes the H+ concentration in the thylakoid lumen to increase due to water oxidation in PSII and the electron transfer in Cytb6f, which contribute to the formation of the H+ concentration gradients (ΔpH) across the thylakoid membranes, and these are required for ATP synthesis. NADPH and ATP are then used for CO2 fixation in the Calvin–Benson–Bassham (CBB) cycle in the chloroplast stroma (Blankenship, 2014).
In the natural environment, the quality and quantity of sunlight vary depending on time, season, and climatic changes. When plants receive strong sunlight, electrons are accumulated in the photosynthetic electron transfer chain, which potentially generates reactive oxygen species (ROS), and the generated ROS induce PSII photoinhibition through the suppression of synthesis of the PSII core protein D1 (Krieger-Liszkay, 2004; Møller et al., 2007; Niyogi, 1999; Yamori, 2016). Conversely, PSI photoinhibition is less likely to occur by strong light (Krieger-Liszkay et al., 2008; Murata et al., 2007). Instead, fluctuating light specifically damages PSI due to the elevated reduction of the special pair of chlorophylls in PSI (P700) that promote disruption of iron–sulfur clusters in PSI (Tiwari et al., 2016). In order to prevent such photoinhibition, plants have acquired several mechanisms to control the photosynthetic electron transfer in response to light conditions. Non-photochemical quenching (NPQ) is one of the crucial mechanisms that prevents photoinhibition in plants (Demmig-Adams et al., 2014). There are several NPQ components such as energy-dependent quenching (qE), state-transition quenching (qT), and photoinhibition-dependent quenching (qI), and qE is the major NPQ component in land plants in most growth-light conditions (Ruban, 2016).
qE is controlled by the xanthophyll cycle carotenoids (Demmig-Adams, 1990). When the photosynthetic electron transport chain is activated in high-light conditions, the pH in the thylakoid lumen is lowered and this results in the protonation of critical amino-acid residues of the lumen-localizing violaxanthin deepoxidase, which converts violaxanthin to zeaxanthin (Arnoux et al., 2009; Saga et al., 2010). Zeaxanthin in the LHCII is involved in dissipation of absorbed light energy into heat, resulting in the induction of qE (Jahns et al., 2009; Niyogi et al., 1998). However, in the dark or in low-light conditions, zeaxanthin is epoxidized by the stroma-localizing zeaxanthin epoxidase, which converts zeaxanthin to violaxanthin to relax qE (Havaux & Tardy, 1997; Niyogi et al., 1998). Therefore, qE is induced by ΔpH formation across the thylakoid membranes through photosynthetic electron transfer. The thylakoid membrane localizing protein, PsbS, is also required for the induction of qE (Li et al., 2000). The actual function of PsbS is not clarified fully, although it is known to interact with the LHCII in response to increased ΔpH and zeaxanthin formation, which are correlated with the induction of qE (Correa-Galvis et al., 2016; Nicol et al., 2019; Sacharz et al., 2017).
The pH values in the stroma also change in a light-dependent manner. In the dark, the pH of the stroma and the lumen is ~7; however, when photosynthesis is induced upon light illumination, the pH values in the stroma and the lumen increase to ~8 in the stroma and decrease to ~6 in the lumen (Takizawa et al., 2007). Lumen acidification not only induces qE but also activates the chloroplast ATP synthase (Junesch & Gräber, 1987) and reduces the activity of the Cytb6f complex to oxidize P700 (Hope et al., 1994; Takizawa et al., 2007). In addition, since the CBB cycle enzymes are activated at alkaline pH, increased pH in the stroma under light illumination conditions is also important for the upregulation of CO2 fixation (Tikhonov, 2015). Thus, H+ homeostasis in chloroplasts is crucial for the coordinated regulation of photosynthetic light and dark reactions.
We previously identified new components involved in the regulation of chloroplast H+ homeostasis in Arabidopsis thaliana: Fluctuating-Light-Acclimation Protein1 (FLAP1) and its possible interactor, Day Length-dependent Delayed-Greening1 (DLDG1) (Harada et al., 2019; Sato et al., 2017). FLAP1 and DLDG1 are specifically conserved in oxygenic phototrophs including cyanobacteria, algae, and plants. Cyanobacterial FLAP1 and DLDG1 homologs were required for proper light-dependent H+ release in cyanobacteria (Inago et al., 2020; Sonoda et al., 1998). In chloroplasts, FLAP1 localizes in both the thylakoid and envelope membranes (Sato et al., 2017), while DLDG1 only localizes in the envelope membranes (Harada et al., 2019). It was also found that the dldg1 mutant of Arabidopsis has a pale-green phenotype in young leaves under continuous-light conditions and excessively induces NPQ (Harada et al., 2019). Arabidopsis flap1 mutant also shows pale-green leaves and abnormal NPQ induction under fluctuating-light conditions (Sato et al., 2017). Of the above-mentioned components of NPQ, qE is greatly affected by the functional loss of DLDG1 (Harada et al., 2019) or FLAP1 (Sato et al., 2017; Trinh et al., 2019). These results suggest that FLAP1 and DLDG1 have regulatory roles in controlling H+ homeostasis in chloroplasts, although their exact activities are still unknown.
Plants and algae encode a DLDG1 homolog in the chloroplast genome, which was designated as Ycf10 (Harada et al., 2019). Pea Ycf10 localizes in the chloroplast envelope membranes and is called Chloroplast Envelop Membrane protein A (CemA) (Sasaki et al., 1993). A Chlamydomonas ycf10-deficient mutant was isolated and characterized, and it showed lowered HCO3− transport across the chloroplast envelope membrane, perhaps, due to the decrease in H+ translocation across the envelope membranes of chloroplasts (Rolland et al., 1997). These results suggest that Ycf10 is also involved in the H+ translocation across the envelope membranes. However, although tobacco ycf10 mutants were previously constructed (Khan & Gray, 2001; Świątek, 2002), detailed phenotypic characterization of ycf10 mutants in vascular plants has not yet been performed. In this study, we isolated and characterized tobacco ycf10 mutants and showed that Ycf10 may have a crucial role in controlling H+ translocation across the envelope membranes of chloroplasts, and for the precise control of NPQ induction.
2 MATERIALS AND METHODS
2.1 Plant materials and growth conditions
Tobacco (Nicotiana tabacum cv. Xanthi) WT and ycf10 mutants (Δycf10-1 and Δycf10-2) were grown under short-day conditions (8-h light [23°C]/16-h dark [16°C] cycles, 200 μmol m−2 s−1) and/or continuous-light conditions (24-h light [23°C], at 35 or 200 μmol m−2 s−1). All individuals were germinated on 0.8% (w/v) agar-containing half-strength Murashige-Skoog (1/2 MS) medium, and after the indicated growth periods, the plants were transferred to soil (vermiculite:promix ration of 1:1).
2.2 Isolation of tobacco ycf10 mutants
All primers used in this study are shown in Table S1. Initially, the coding region of the tobacco ycf10 gene (690 bp), together with the 2500 bp upstream and downstream regions from the start and stop codons, respectively, was amplified via PCR with the Nicotiana-Ycf10-2500Fw and Nicotiana-Ycf10-Rv primers. The amplified fragment was cloned into a pUC19 plasmid using an In-Fusion cloning kit (TaKaRa, Kyoto, Japan). The resulting plasmid was then amplified by PCR with the Nico-Ycf10-Fw2 and Nico-Ycf10-Rv primers. The aadA gene encoding the spectinomycin-resistant gene was also amplified by PCR with the pHP45Ω plasmid (Fellay et al., 1987) as a template using the nico-aadA-Fw4 and aadA-Rv4 primers. The two PCR fragments were mixed and connected using an In-Fusion kit. In pUCycf10Sp, the resulting plasmid, the aadA gene was inserted into the ycf10-coding region 161 bp from the start codon. The direction of the aadA is the same as that of ycf10. The correct sequence of the cloned fragment was verified by sequencing.
Plastid transformation was carried out as described previously (Kikuchi et al., 2018). Briefly, young leaves from sterile tobacco plants were bombarded with pUCycf10Sp plasmid DNA-coated gold particles (0.6 μm) at a pressure of 1100 psi using the Biolistic® PDS1000/He particle delivery system (Bio-Rad, Hercules, CA, USA). Antibiotic-resistant shoots/calli were selected on the RMOP agar medium containing 200 mg L−1 of spectinomycin dihydrochloride. The targeted insertion of aadA into the ycf10 region was estimated using genomic PCR, with a primer pair, YN356 and YN357 (Table S1). Four independent positive lines were obtained from 12 biolistic bombardments of tobacco leaves (data not shown). The transplastomic lines were subjected to additional rounds of regeneration to achieve homoplasmy. Finally, two independent lines, Δycf10-1 and Δycf10-2, were rooted on MS agar medium supplemented with 3% (w/v) sucrose and 500 mg L−1 of spectinomycin dihydrochloride. The T0 plants were subjected to Southern blotting to confirm their homoplasmicity.
2.3 Southern blotting
Total DNA was extracted from leaves of the WT, Δycf10-1, and Δycf10-2 using the Nucleon PhytoPure PLANT DNA extraction kit (GE Healthcare, Chicago, IL, USA) according to the manufacturer's instructions. Extracted DNA (5 μg) from each line was digested with EcoRI or XbaI (TaKaRa) and then separated using 1.5% (w/v) agarose gel electrophoresis. After electrophoresis, gels were treated with the denaturation solution containing 0.5-M NaOH and 1.5-M NaCl, and then the neutralization solution containing 0.5-M Tris/HCl (pH 7.5) and 3-M NaCl. DNA in the gel was transferred to the Hybound-N+ positively charged nylon membrane (Merck, Darmstadt, Germany). The PCR fragment of the full length of the tobacco ycf10 gene, amplified with the NicoYcf10-F and NicoYcf10-R primers (Table S1), was used as a DNA probe. The PCR fragment was labeled with the DIG High Prime DNA Labeling kit (Merck), according to the manufacturer's instructions. Hybridization was carried out with DIG Easy Hyb Granules (Merck) at 50°C for 16 h. After hybridization, the membrane was washed twice with 2× SSC (20× SSC contains 3-M NaCl and 0.3-M sodium citrate, pH 7.0) and 0.1% (w/v) sodium dodecyl sulfate (SDS) for 5 min at room temperature, and twice with 0.1× SSC and 0.1% SDS for 15 min at 65°C. Detection of the probe DNA was performed using the DIG High Prime DNA Detection Kit (Merck), according to the manufacturer's instructions.
2.4 SDS-PAGE and western blotting
Shoots of the WT, Δycf10-1, and Δycf10-2 plants, grown on ½ MS plates under short-day (8-h light [23°C]/16-h dark [16°C] cycles, 200 μmol m−2 s−1) or continuous low-light (35 μmol m−2 s−1) conditions for 21 days were harvested and homogenized in a buffer containing 10-mM Tris/HCl (pH 8.0), 100-mM NaCl, and 1-mM EDTA, followed by mixing with an equal volume of 2× SDS sample buffer containing 125-mM Tris/HCl (pH 6.8), 4% (w/v) SDS, 20% (v/v) glycerol, 100 μg ml−1 bromophenol blue, and 10% (v/v) 2-mercaptoethanol. The protein extracts were subjected to 12% or 10% SDS-PAGE, and the separated proteins were electroblotted onto a polyvinylidene difluoride membrane (GE Healthcare). An equal amount of protein (15–20 μg) was loaded in each lane. Immunodetection was carried out using specific antibodies (Agrisera, Vännäs, Sweden) and an ECL Plus Western Blotting Detection System (GE Healthcare).
2.5 Photosynthetic activity measurement

2.6 Measurement of the ECS signal
WT and ycf10 mutants (Δycf10-1 and Δycf10-2) were grown under short-day conditions. The pmf (proton motive force) was assessed by measuring the electrochromic absorbance shift (ECS or P515) with the DUAL-PAM-100 with the P515/535 module (Walz). The ECS signal was the difference between the transmittance at 550 nm and that at 515 nm (Klughammer et al., 2013). To determine the proton conductivity of the thylakoid membrane, gH+ (Avenson et al., 2005; Joliot & Joliot, 2002), and the ∆pH (proton concentration gradient) and ∆ψ (electric potential) components of the pmf (Cruz et al., 2001; Sacksteder et al., 2000), a DIRK-analysis was conducted, which was previously described (Baker et al., 2007). ECS signals were normalized by a single-turnover flash for 10 μs. The ECS decay from the actinic light (AL) turn-off for 200–300 ms in the dark was fitted using one-component decay kinetics, A1e−k1t + B, where A1 is an amplitude constant, k1 is a rate constant, and B is a constant. gH+ is identical to k1.
Light responses of the pmf, ∆pH, ∆ψ, and gH+ were determined for the leaves in response to continuous red AL at 30, 60, 135, 250, 500, 800, and 1200 μmol m−2 s−1. The leaf was illuminated with the red and blue light at 200 μmol m−2 s−1 for 30 min, and then the light intensity was gradually increased to 1200 μmol m−2 s−1 to open the stomata. After the illumination at 1200 μmol m−2 s−1 for 10 min, the blue light was turned off and the measurement began. Each parameter was obtained in the steady state attained at 300–600 s after the change in the AL. Measurements were made in the ventilated room air (40-Pa CO2, 21-kPa O2, at 25°C). Each data point represents the mean ± SD (n = 9).
2.7 Extraction and analysis of carotenoids
All seeds were germinated on 1/2 MS agar plates under continuous low-light conditions for 12 days. These seedlings were then transferred to soil and continued to grow under short-day moderate-light, continuous low-light, or continuous moderate-light conditions for a further 19 days before sampling for carotenoid analysis.
To check the effect of the three different growth conditions for carotenoid composition (Table 1), plants were kept in the dark for 30 min before harvesting the leaves. All developing leaves, showing no pale-green phenotype, were utilized for the analysis. Specifically, for plants grown under continuous low-light conditions, the sixth leaves were harvested; for plants grown under short-day moderate-light conditions, the fourth leaves were harvested; for plants grown under continuous moderate-light conditions, the eighth leaves were harvested. To see the effects of light response of the carotenoid compositions in the WT and the mutants (Table 2), plants grown under short-day moderate-light conditions were exposed to strong light (1700 μmol m−2) provided by a metal-halide lamp for 30 min and then transferred to the dark. The fourth and the fifth leaves were harvested at 0, 10, and 30 min after shifting from light to dark. Harvested leaves were put immediately into liquid nitrogen and stored at −80°C until used in the carotenoid analysis.
| Genotype | β-carotene | Zea | Ant | Vio | Neo | Lutein |
|---|---|---|---|---|---|---|
| Short-day ML | ||||||
| WT | 31.6 (±2.5) | 0.0 (±0.0) | 0.0 (±0.0) | 7.2 (±3.5) | 3.8 (±0.5) | 53.8 (±2.7) |
| ∆ycf10-1 | 55.6* (±6.8) | 0.0 (±0.0) | 0.0 (±0.0) | 15.6 (±4.6) | 8.8 (±4.4) | 71.3** (±4.0) |
| ∆ycf10-2 | 60.1 (±12.8) | 0.0 (±0.0) | 0.0 (±0.0) | 6.9 (±3.9) | 4.7 (±2.9) | 59.1 (±18.1) |
| Continuous LL | ||||||
| WT | 54.9 (±14.8) | 0.0 (±0.0) | 0.0 (±0.0) | 6.4 (±1.0) | 8.7 (±2.0) | 59.7 (±18.8) |
| ∆ycf10-1 | 29.8 (±10.2) | 0.0 (±0.0) | 0.0 (±0.0) | 8.1 (±6.0) | 8.8 (±4.9) | 77.6 (±14.5) |
| ∆ycf10-2 | 33.0 (±9.8) | 0.0 (±0.0) | 0.0 (±0.0) | 5.2 (±4.1) | 5.6 (±2.4) | 72.1 (±11.8) |
| Continuous ML | ||||||
| WT | 63.3 (±1.8) | 0.0 (±0.0) | 0.0 (±0.0) | 18.8 (±3.7) | 11.5 (±2.1) | 89.4 (±10.1) |
| ∆ycf10-1 | 56.4 (±8.1) | 0.0 (±0.0) | 0.0 (±0.0) | 10.8 (±7.1) | 8.7 (±3.1) | 69.5 (±14.1) |
| ∆ycf10-2 | 61.0 (±12.1) | 0.0 (±0.0) | 0.0 (±0.0) | 14.0 (±5.9) | 9.8 (±5.3) | 66.7 (±26.3) |
- Note: Plants were grown under short-day with moderate-light (ML), continuous low-light (LL), and continuous ML conditions. Carotenoids were extracted from the leaves of 30-min dark-adapted plants. Carotenoid contents were normalized to the total amount of chlorophyll (Chl a + Chl b) (mmol mol−1). Data were represented as mean ± SD (n = 3). ycf10 mutants were compared with the WT for statistically significant differences.
- Abbreviations: Ant, antheraxanthin; Neo, neoxanthin; Vio, violaxanthin; Zea, zeaxanthin.
- * P < .05, Turkey's multiple comparison test with a 95% CI.
- ** P < .01, Turkey's multiple comparison test with a 95% CI.
| Genotype | β-carotene | Zea | Ant | Vio | Neo | Lutein |
|---|---|---|---|---|---|---|
| 30-min HL | ||||||
| WT | 84.8 (±15.0) | 10.2 (±5.1) | 5.9 (±3.3) | 2.5 (±1.2) | 6.5 (±3.9) | 60.2 (±27.2) |
| ∆ycf10-1 | 97.6 (±9.0) | 10.8 (±2.6) | 5.1 (±1.6) | 2.3 (±0.9) | 7.8 (±3.4) | 92.0 (±16.4) |
| ∆ycf10-2 | 110.7 (±7.9) | 14.1 (±3.4) | 4.6 (±1.9) | 2.5 (±0.4) | 9.9 (±1.3) | 110.9* (±1.9) |
| 10-min dark | ||||||
| WT | 88.9 (±15.7) | 11.0a (±2.1) | 8.5 (±0.4) | 4.1 (±1.7) | 10.0 (±4.8) | 86.5 (±5.9) |
| ∆ycf10-1 | 103.9 (±17.2) | 6.8 (±5.1) | 6.4 (±0.6) | 2.7 (±0.3) | 9.7 (±1.6) | 107.0 (±14.4) |
| ∆ycf10-2 | 106.5 (±11.2) | 6.9 (±1.8) | 14.0 (±9.4) | 3.9 (±2.3) | 9.0 (±2.1) | 75.9 (±21.9) |
| 30-min dark | ||||||
| WT | 99.7 (±4.8) | 1.4 (±1.0) | 5.5 (±0.7) | 5.5 (±1.6) | 9.1 (±2.5) | 89.0 (±9.6) |
| ∆ycf10-1 | 120.4 (±7.5) | 0.7 (±0.5) | 8.8* (±1.4) | 6.9 (±0.7) | 14.0 (±2.0) | 113.4* (±7.7) |
| ∆ycf10-2 | 100.2 (±13.7) | 2.0 (±0.6) | 4.8 (±1.6) | 4.9 (±0.4) | 9.9 (±2.2) | 87.4 (±10.3) |
- Note: Plants were grown under short-day with moderate-light before exposed to high light (1700 μmol m−2 s−1) for 30 min (30-min HL), then dark-adapted for 10 min (10-min dark) or 30 min (30-min dark). The fourth and fifth leaves from these plants were harvested and extract carotenoids as mentioned in the Materials and Methods section. Carotenoid contents were normalized to the total amount of chlorophyll (Chl a + Chl b) (mmol mol−1). Data were represented as mean ± SD (n = 3). Values of ycf10 mutants were statistically analyzed with those of WT.
- Abbreviations: Ant, antheraxanthin; Neo, neoxanthin; Vio, violaxanthin; Zea, zeaxanthin.
- a Zea could be detected in two per three samples.
- * P < .05, Turkey's multiple comparison test with a 95% CI.
Carotenoid compositions were determined as previously described (Harada et al., 2019). Specifically, pigments in each harvested leaf sample were extracted with a mixture of acetone and methanol (7:2, v/v) containing 10-mM Tris/HCl (pH 8.0). The organic solvents were evaporated to dryness, and the pigments were dissolved in a small volume of chloroform and methanol (3:1, v/v). For high-performance liquid-chromatography (HPLC) analysis, the column was a NOVA pak C18 column (100 × 8 mm, RCM-type; Waters), and the detector was a photodiode array detector (SPD-M10A, Shimadzu, Kyoto, Japan). A linear gradient from an eluent containing 94.75% acetonitrile, 1.75% methanol, 1.75% dichloromethane, and 1.75% water (by vol.) to 50% acetonitrile and 50% ethyl acetate (by vol.) was applied for 12 min and then acetonitrile-ethyl acetate elution for 16 min at flow rate of 1.8 ml min−1. The peak areas of the HPLC at 440 nm for carotenoids and chlorophylls were compared. The relative amounts of each carotenoid were reported by normalizing to total amounts of the chlorophylls (chlorophyll a and chlorophyll b) in the same sample.
2.8 Complementation analysis of the antiporter mutants of E. coli
All plasmid constructs and the complementing E. coli TO114 and LB2003 strains were described previously (Harada et al., 2019), except for the Synechocystis PxcA expression plasmid. Briefly, coding regions of Arabidopsis Ycf10, DLDG1, and Synechocystis sp. PCC6803 NhaS3 were separately cloned in the ampicillin-resistant pPAB404 vector (Buurman et al., 1995), which were individually introduced into the Na+/H+ antiporter E. coli mutant TO114 (Buurman et al., 1995) or the K+/H+ antiporter mutant LB2003 (Stumpe et al., 1996). For the construction of the PxcA-expression plasmid, pxcA gene was amplified using PCR with a primer pair, PxcA-F, and PxcA-R and cloned onto the pPAB404 vector. Other constructions were described previously (Harada et al., 2019). The cording region of Ycf10 was previously cloned into the tetracycline-resistant pSTV28 vector (Matsuda et al., 2004) and introduced into the TO114 or LB2003 strain containing DLDG1 expression pPAB404 plasmid (Harada et al., 2019). An empty vector was also introduced to the remaining strains to let all strains have two plasmids (pPAB404- and pSTV28-based plasmids) and exhibit resistance to ampicillin and tetracycline.
The TO114 strain cannot grow in a high Na+-concentration medium. Therefore, the complementing strains were grown in the medium containing 1% (w/v) hipolypepton, 0.5% (w/v) yeast extract, 30 mM KCl, 50 mg L−1 ampicillin, and 10 mg L−1 tetracycline. The overnight cultures of the complementing strains were diluted to OD660 = 0.01 with the medium containing 1% (w/v) hipolypepton, 0.5% (w/v) yeast extract, 100-mM NaCl, 0.5-mM isopropyl β-d-thiogalactopyranoside (IPTG), and 10-mM Tris/HCl (pH 7.0). Cells were grown at 37°C for 8 h, and then OD660 of each culture was measured using a Shimazu UV-1800 spectrophotometer to estimate cell growth.
The E. coli K+/H+ antiporter mutant LB2003 could not grow in a low K+-concentration medium. Therefore, the complementing strains were grown in the medium containing 10% (w/v) hipolypepton, 0.5% (w/v) yeast extract, 100-mM KCl, 50 mg L−1 ampicillin, and 10 mg L−1 tetracycline. The overnight cultures of the complementing strains were centrifuged at room temperature by 1000 g for 1 min, and the collected cells were washed with the medium containing 46-mM Na2HPO4-12H2O, 23-mM NaH2PO4-2H2O, 7.9-mM (NH4)2SO4, and 1% (w/v) glucose. The cells were then resuspended and diluted to OD660 = 0.01 with the above medium containing 0.5-mM IPTG and different concentrations of KCl (5 mM, 30 mM, or 100 mM). Cells were grown at 37°C for 12 h, and then OD660 of each culture was measured to estimate cell growth.
2.9 Statistical analysis
All experiments were designed and performed with at least three independent replicates. The collected data were calculated and the graphs and charts constructed using Microsoft Excel 2016, GraphPad Prism version 5.01 and R software. The data are presented as the mean ± standard deviation (SD). The statistical differences between the experimental samples were confirmed using the Turkey test with 95% confidence intervals (CI).
3 RESULTS
3.1 Construction of ycf10 mutants
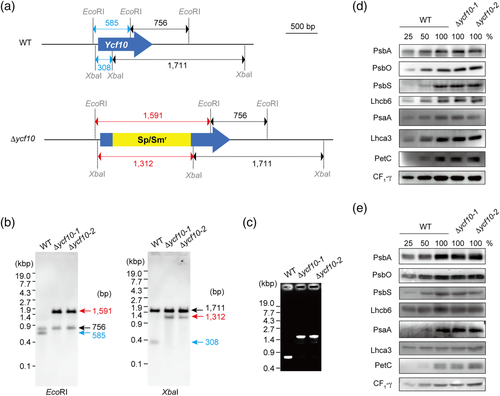
In the chloroplast genome of the tobacco Nicotiana tabacum, ycf10 is localized downstream of petA encoding cytochrome f, and upstream of psaI and ycf4, which encode the PsaI subunit of PSI and PSI-assembly proteins, respectively (Krech et al., 2012; Shinozaki et al., 1986). The petA, ycf10, psaI, and ycf4 are co-transcribed with several promoters (Khan & Gray, 2001; Świątek, 2002). Previously, to construct tobacco ycf10 mutants, the spectinomycin-resistance gene-cassette was inserted ~160 bp downstream of the Ycf10 start codon (Świątek, 2002). Although insertion of the gene-cassette induced alteration of the mRNA encoding the four genes, the protein levels of the PSI and cytochrome b6f subunits were the same as those in the WT (Świątek, 2002), suggesting that the secondary effects of the expression of petA, psaI, and ycf4 caused by the insertion of the spectinomycin-resistance gene-cassette in the ycf10 region are negligible. Here to construct the ycf10 tobacco mutant, we inserted the spectinomycin-resistance gene at the previously reported position in ycf10 to avoid the secondary effects caused by the gene insertion, and the construct was integrated into the chloroplast genome through homologous recombination. After callus formation, transformants were isolated on spectinomycin-containing plates. PCR-based genotyping indicated that the construct was successfully integrated into the chloroplast genome in the two independent mutant lines, Δycf10-1 and Δycf10-2, and Southern blot analysis indicated that their Δycf10 mutations were, at least, nearly homozygous (Figure 1a–c). We also confirmed, by Western blotting, that the levels of some photosynthetic proteins, including the subunits of PSII (PsbA, PsbO, PsbS, and Lhcb6), PSI (PsaA and Lhca3), cytochrome b6f (PetC), and the plastidial ATP synthase (γ subunit) were the same between the WT and ycf10 mutants grown under short-day (8-h light/16-h dark) with moderate-light (200 μmol m−2 s−1) (Figure 1d) and continuous low-light (35 μmol m−2 s−1) conditions (Figure 1e), indicating that the insertion of the antibiotic resistance gene-cassette in the ycf10 region does not affect the accumulation of major protein complexes in thylakoid membranes (Świątek, 2002).
3.2 Long-term response of ycf10 mutants to different light conditions
The Arabidopsis mutants lacking the Ycf10-homolog, DLDG1, had a pale-green leaf under continuous-light, but this was not observed when they were cultured in the dark for ≥8 h/d (Harada et al., 2019). To test if the phenotype(s) of the tobacco ycf10-mutant was day-length-dependent or not, we grew WT, Δycf10-1, and Δycf10-2 plants under three different growth conditions: short-day with moderate-light (200 μmol m−2 s−1), continuous low-light (35 μmol m−2 s−1), and continuous moderate-light (200 μmol m−2 s−1) conditions (Figure 2a–c, respectively). All seeds were germinated on plates under continuous low-light conditions, and 12 days after germination, the seedlings were transferred to soil and grown for a further 7 days in the conditions previously described. Plants grown under short-day moderate-light conditions (Figure 2a) were smaller than those grown under continuous moderate-light ones (Figure 2c). Plants grown with continuous low-light conditions (Figure 2b) were smaller than those grown under continuous moderate-light conditions (Figure 2c), indicating that plant sizes were dependent on illumination time and intensity. No difference was observed in the plant sizes between the WT and the ycf10 mutants, indicating that the ycf10 mutation did not significantly influence plant growth in any of the conditions tested.
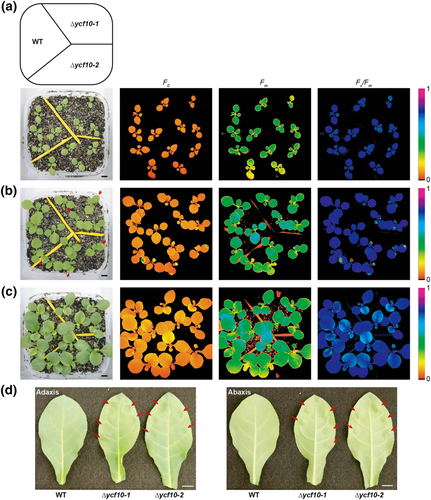
Under short-day moderate-light conditions (Figure 2a), Δycf10-1 and Δycf10-2 did not show visible phenotypes. Conversely, under continuous low-light conditions (Figure 2b), cotyledons and the first leaves of Δycf10-1 and Δycf10-2 contained pale-green areas (red arrows), and the maximum quantum yield of PSII (Fv/Fm) was reduced, mostly due to increased Fo (fluorescence under no actinic-light) compared with those in the WT. Under continuous moderate-light conditions (Figure 2c), not only Δycf10-1 and Δycf10-2, but the WT also showed a pale-green phenotype in the cotyledons, the third leaves, and the emerging leaves (the fourth leaves), where the Fv/Fm values were lowered. These results show that the mutational loss of Ycf10 results in a pale-green phenotype at the emerging area of leaves where photoinhibition and/or disassembly of PSII are accelerated.
For the plants grown under continuous moderate-light on soil for 21 days, after being transferred from plates, the fourth and the fifth leaves of the Δycf10-1 and Δycf10-2 showed unusual bumpy structures such that a concave shape was seen from the adaxial-side (Figures 2d and S1). These unusual structures were not observed in the WT, suggesting that the loss of Ycf10 influences leaf structure. It is of note that the pale-green phenotype in the third leaves of the WT, Δycf10-1, and Δycf10-2 disappeared at this growth stage (Figure S1), indicating that they were specific to developing leaves. The Fo, Fm, and Fv/Fm values in the concave-shaped fifth leaves of Δycf10-1 and Δycf10-2 were the same as those of the WT (Figure S2), suggesting that the formation of the unusual bumpy structures did not influence PSII activity. The unusual bumpy structures were not observed in plants grown under short-day moderate-light conditions (Figure S1).
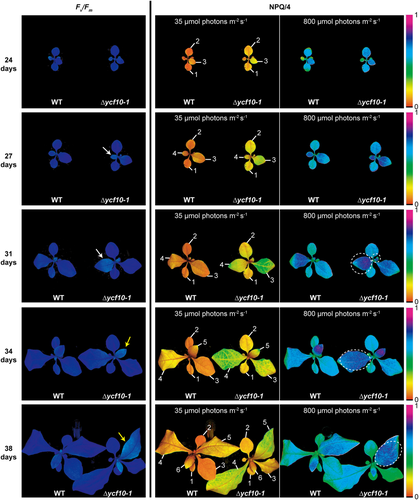
We also analyzed stage specific alterations of the NPQ in the ycf10 mutant. The Fv/Fm and NPQ values were measured with 24-, 27-, 31-, 34-, and 38-day-old plants grown under short-day moderate-light conditions. We found the developmental stage specific influence of the Δycf10 mutation on Fv/Fm, such that lowered Fv/Fm in the Δycf10-1 could be observed only in the developing leaves and not the mature leaves (Figure 3), although both developing and mature leaves of Δycf10 mutants showed WT-like shoot phenotypes under short-day moderate-light conditions. More specifically, Fv/Fm values in the fourth leaves of Δycf10-1 were lower than those in the WT in the 27- and 31-day-old plants (white arrows); however, the lowered Fv/Fm in these leaves of the Δycf10-1 had recovered when they were 34-days old. Lowered Fv/Fm was also observed in the developing fifth leaves of Δycf10-1 (yellow arrows). These results suggested that PSII assembly tends to be impaired and/or PSII photoinhibition tends to be accelerated in Δycf10-1, when compared with those in the WT, especially during leaf developmental stages. Conversely, NPQ values in the Δycf10-1 under low AL (35 μmol m−2 s−1) were always higher than those in the WT. Under high AL (800 μmol m−2 s−1), Δycf10-1 still showed higher NPQ values in the young leaves (developing leaves and emerging leaves, white circles). These results indicate that although the Δycf10 mutation might increase photoinhibition at PSII or/and decrease PSII assembly in developing leaves, abnormal NPQ induction in Δycf10-1 is irrelevant to the mentioned effects at PSII after maturation.
Because xanthophyll cycle carotenoids are involved in the NPQ control (Demmig-Adams, 1990), we next characterized the carotenoid compositions of the WT, Δycf10-1, and Δycf10-2 mutants grown under three growth conditions: short-day moderate-light (200 μmol m−2 s−1), continuous low-light (35 μmol m−2 s−1), and continuous moderate-light (200 μmol m−2 s−1), which are the same conditions shown in Figure 1. These plants were kept in the dark for 30 min before harvesting the leaves. We found that β-carotene and lutein contents in the leaves of Δycf10-1, grown under short-day moderate-light, were significantly higher than those in the WT (Table 1), which was not observed in plants grown under continuous low-light and continuous moderate-light conditions (Table 1). However, this phenotype may not be simply caused by the ycf10 mutation, because the difference was not observed in Δycf10-2 (Table 1). Note that no significant differences were observed for the xanthophyll cycle carotenoids, zeaxanthin, antheraxanthin, or violaxanthin (Table 1).
3.3 Short-term response of ycf10 mutants upon light/dark transition
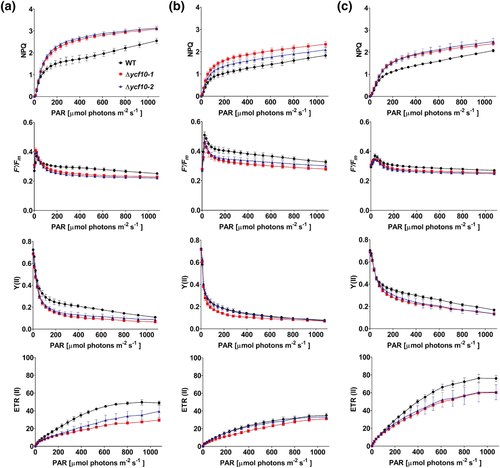
First, rapid light curve measurements (White & Critchley, 1999) were determined with the WT, Δycf10-1, and Δycf10-2 grown in short-day moderate-light (200 μmol m−2 s−1), continuous low-light (35 μmol m−2 s−1), and continuous moderate-light (200 μmol m−2 s−1) conditions, which were the same conditions indicated in Figure 1. For the measurement, plants were kept in the dark for 5 min and then illuminated using AL with an increasing intensity up to 1076 μmol m−2 s−1. The photosynthetic parameters were measured after 10 s of illumination during each AL intensity. Generally, 5 min of dark adaption is enough to diminish qE, but other effects in photosynthesis regulation influenced by different growth-light conditions may remain (White & Critchley, 1999). Alternatively, these data could show differences in PSII activity between WT and ycf10 mutant plants grown under separate conditions. The second leaves that did not show a pale-green phenotype was used (Figure 2) for the measurement. Plants grown under conditions without dark periods, such as continuous low-light (Figure 4b) and continuous moderate-light (Figure 4c), exhibited smaller NPQ values than those in plants grown under short-day moderate-light conditions (Figure 4a). Differences in NPQ values between ycf10 mutants and WT were clearly observed under moderate-light conditions (Figure 4a,c) than those under low-light conditions (Figure 4b). Plants grown under continuous moderate-light conditions (Figure 4c) exhibited higher ETR (II) values, which reflect the electron transfer rate at PSII, than those grown under short-day moderate-light (Figure 4a) and continuous low-light (Figure 4b) conditions. These results showed that the significance of mutational loss of Ycf10 for PSII activity differs depending on growth conditions, probably, owing to unballanced acclimation of the photosynthetic apparatus to different light conditions. Δycf10-1 and Δycf10-2 grown under short-day moderate-light (Figure 4a) conditions indicated higher NPQ than WT at AL of >100 μmol m−2 s−1. The increased NPQ accompanied not only lowered ETR (II) but also reduced F′/Fm and Y (II), which reflected the relative QA reduction and quantum yield of PSII, respectively. These results proposed that luminal pH tends to be lower in the Δycf10-1 and Δycf10-2, causing the higher induction of NPQ and the downregulation of photosynthetic electron transfer. Similar tendencies could be observed in plants grown under continuous low-light (Figure 4b) and moderate-light (Figure 4c) conditions.
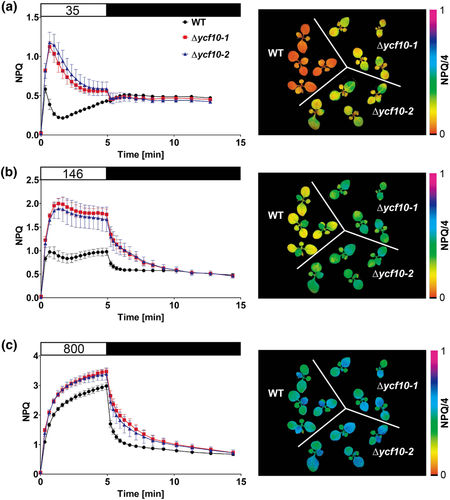
The NPQ induction kinetics upon dark–light and light–dark transitions were then analyzed (Figure 5). For these measurements, we grew plants under short-day moderate-light conditions, where Δycf10-1 or Δycf10-2 did not show pale-green phenotypes or unusual leaf structures (Figure 2a). Plants were kept in the dark for 30 min, and then AL was illuminated with three different light intensities (35, 146, and 800 μmol m−2 s−1) to drive photosynthesis. The kinetics of NPQ induction in the ycf10 mutants were as fast as those observed in the WT (Figure 5, left). Nevertheless, after the NPQ induction stage, the NPQ values were maintained at higher levels in the ycf10 mutants compared with those in the WT, at all three AL intensities (Figure 5, left). The NPQ in the WT relaxed within 1 min and 3 min after turning off the AL of 146 μmol m−2 s−1 and 800 μmol m−2 s−1, respectively (Figure 5b,c, left). However, for Δycf10-1 and Δycf10-2, the relaxation was slower than in the WT, as they required ~5 min and ~10 min to complete the NPQ relaxation in the dark after turning off the 146 μmol m−2 s−1 and 800 μmol m−2 s−1 AL, respectively. The NPQ values in Δycf10-1 and Δycf10-2 in the other leaves (cotyledons and the first leaves) were also higher than those in the WT, especially under low (35 μmol m−2 s−1) and moderate (146 μmol m−2 s−1) intensities of AL (Figure 5, right). In higher plants, qE is induced within a few seconds after turning on the light and relaxes within 1–2 min upon shifting from the light to the dark (Ruban, 2016); therefore, these results suggest that the luminal acidification in Δycf10-1 and Δycf10-2 is accelerated in the light and is not attenuated properly in the dark, when compared with the WT.
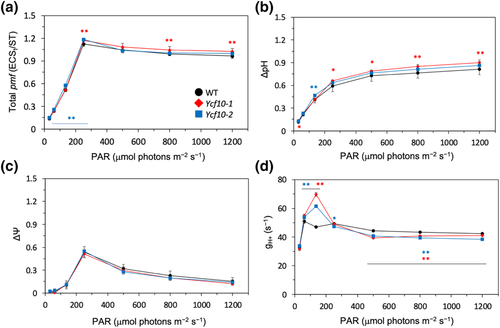
We next measured the electrochromic signal (ECS) and calculated the pmf, ΔpH, and ΔΨ across the thylakoid membranes, as well as the thylakoid proton conductivity by ATP synthesis (gH+). The leaves were exposed to red AL at 30, 60, 135, 250, 500, 800, and 1200 μmol m−2 s−1, and each parameter was obtained in the steady state attained at 300–600 s after the change in the AL. Slight but significant differences were observed between the total pmf and ΔpH values for the WT and the Δycf10-1 and the WT and Δycf10-2 under low (~100 μmol m−2 s−1) and high (>200 μmol m−2 s−1) AL illuminations, respectively (Figure 6a,c). Due to the fact that significant changes were observed in only one of the two mutants, it could not be concluded that the Δycf10 mutation itself causes these changes. No significant difference was observed between the ΔΨ values of WT and Δycf10-1 or Δycf10-2 (Figure 6c). Conversely, the gH+ values of Δycf10-1 and Δycf10-2 were significantly increased and decreased at AL intensity of 100-μmol m−2 s−1 and >500 μmol m−2 s−1, respectively (Figure 6d), showing that the rate of H+ translocation across the thylakoid membranes (pmf × gH+) in the ycf10 mutants, is higher and lower than in WT at the AL intensity of 100 μmol m−2 s−1 and >500 μmol m−2 s−1, respectively. These results also showed that higher NPQ observed in the ycf10 mutants (Figure 5) may not be explained simply by the acidification of the thylakoid lumen.
Then, levels of xanthophyll cycle carotenoids were determined after exposure to strong light (1700 μmol m−2 s−1) and 10 min and 30 min dark incubation after the transition from strong-light to dark (Table 2). It was found that WT accumulated a certain amount of zeaxanthin after 30 min strong-light irradiation, which was relaxed in the dark. The Δycf10-1 and Δycf10-2 also indicated strong light-induced zeaxanthin accumulation (Table 2), and antheraxanthin accumulation was significantly higher in Δycf10-1 than in WT after 30 min dark incubation. Lutein contents in Δycf10-2 and Δycf10-1 were also significantly higher than those in WT after strong-light irradiation and 30 min dark incubation, respectively (Table 2). However, because such significant differences were noticed only in one of the two ycf10 mutants, this phenotype may not be simply caused by the ycf10 mutation. These data showed that higher NPQ observed in the ycf10 mutants (Figure 5) may not be explained by alteration of compositions in xanthophyll carotenoids.
3.4 Response of ycf10 mutants to fluctuating light
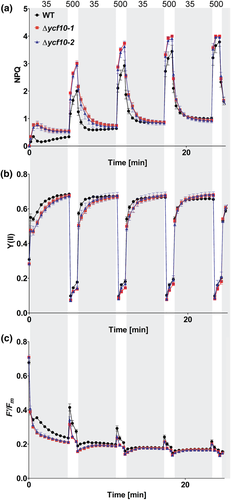
We next measured photosynthetic parameters under fluctuating-light conditions. The second leaves of the 22-day-old plants grown under short-day moderate-light (200 mmol m−2 s−1) conditions were used for the analysis. AL was repeatably illuminated with different light intensities: 35 μmol m−2 s−1 for 5 min and 500 μmol m−2 s−1 for 1 min. NPQ was highly induced in Δycf10-1 and Δycf10-2 in the first-round of illumination of low-light (35 μmol m−2 s−1) and high-light (500 μmol m−2 s−1) compared with the WT; however, the increment of NPQ was gradually diminished with increasing illumination periods and time (Figure 7a). Similarly, Y (II) and F′/Fm values were recovered with increasing illumination (Figure 7b,c). These results indicated that Ycf10 is important for photosynthetic control, especially during photosynthesis-induction stages, which could be compensated during light illumination.
3.5 Ycf10 functionally interacts with DLDG1
To get more insight into Ycf10 activity, complementation analysis of E. coli antiporter mutants with Ycf10 and DLDG1 was performed. Although Arabidopsis has a single DLDG1 gene in the nucleus, two DLDG1 homologs, designated as NtDLDG1a and NtDLDG1b, were encoded in the nucleus in N. tabacum (Table S2). The amino-acid sequence identity between NtDLDG1a and NtDLDG1b is 89%, which is higher than those between Arabidopsis DLDG1 and NtDLDG1a and/or Arabidopsis DLDG1 and NtDLDG1b (~62%), showing that NtDLDG1a and NtDLDG1b are paralogs. To characterize the functional interaction between Ycf10 and DLDG1, Arabidopsis Ycf10 and DLDG1, but not those of tobacco, were used to make the experiment simple. Specifically, complementation analysis of E. coli K+ and Na+ antiporter mutants by Arabidopsis Ycf10 and DLDG1 was performed. The E. coli mutants with the Ycf10/DLDG1 homolog of cyanobacteria, Proton Exchange A (PxcA) from Synechocystis sp. PCC6803 was also complimented. As indicated in Figure 8a, the E. coli strain TO114, lacking three Na+/H+ antiporters, could not grow in a liquid medium containing 100 mM NaCl because it lacks Na+ extrusion activity (+Vector). Alternatively, the TO114 strain expressing the cyanobacterial Na+ transporter NhaS3 recovered the growth, showing that NhaS3 could extrude Na+ in E. coli, as reported (Tsunekawa et al., 2009). Clearly, DLDG1, but not Ycf10 and PxcA, could complement the growth (Figure 8a), suggesting that DLDG1 has Na+ extrusion activity. Interestingly, TO114 strain expressing both DLDG1 and Ycf10 could not grow in the medium, this suggests that Ycf10 inhibits the Na+ extrusion activity of DLDG1.
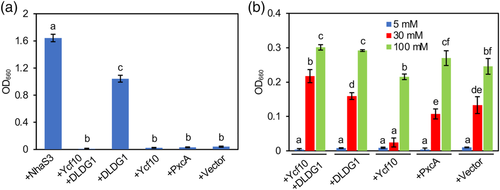
Complementation analysis of the K+ uptake-deficient E. coli strain LB2003 was also performed. All complementing strains could not grow in the medium containing 5 mM KCl (Figure 8b). Although the LB2003 strain containing vector could only grow in the medium containing 30 mM KCl, the strain expressing Ycf10 still could not grow in the medium, suggesting that Ycf10 inhibits K+ uptake activity of unknown transporter(s) and/or Ycf10 exports K+ in the mutant E. coli. Notably, the LB2003 strain expressing Ycf10 and DLDG1 could grow in the medium containing 30-mM KCl, suggesting that DLDG1 suppresses the Ycf10 activity. All the tested strains could grow in the medium containing 100 mM KCl.
4 DISCUSSION
In this investigation, we constructed tobacco mutants that lacked the plastid-encoded Ycf10. The ycf10 mutants exhibited similar phenotypes to Arabidopsis mutants lacking the Ycf10-homolog DLDG1, as both mutants had pale-green areas with increased PSII damage and/or disassembly in developing leaves (Figure 2). Furthermore, the pale-green leaves were strongly observed under continuous-light conditions, which are disappeared when plants were grown under dark–light cycles (e.g., short-day conditions) (Figure 2; Harada et al., 2019). Given that both Ycf10 and DLDG1 were shown to localize in the chloroplast envelope-membranes (Harada et al., 2019; Sasaki et al., 1993), these results suggest that the plastidial-encoded Ycf10 and the nuclear-encoded DLDG1 are functionally similar.
4.1 Control of plastidial pH by Ycf10 homologs
Ycf10 and DLDG1 homologs are specifically conserved in oxygenic phototrophs including cyanobacteria (Harada et al., 2019). Cyanobacterial Ycf10/DLDG1 homologs, designated as PxcA and PxcA-like (PxcL) (Inago et al., 2020), are involved in H+ translocation across the cytoplasmic membranes, suggesting that Ycf10/DLDG1 also involved in H+ translocation across the envelope membranes of chloroplasts. Synechocystis cells expressing Arabidopsis Ycf10/DLDG1 showed unusual H+ translocation activity (Inago et al., 2020), and Arabidopsis mutants lacking K+/H+ antiporters, KEA1 and/or KEA2 that are localized in chloroplast envelope-membranes, showed a ycf10/dldg1 mutant-like pale-green phenotype (Kunz et al., 2014), supporting the hypothesis that Ycf10 and DLDG1 control H+ translocation across the envelope membranes of chloroplasts. The cyanobacterium Synechocystis sp. PCC6803 extrudes H+ when illuminated with light for ~1 min and then begins H+ uptake after ~1 min in the light (Sonoda et al., 1998). Conversely, the Synechocystis PxcA mutant did not show H+ extrusion upon light illumination (Sonoda et al., 1998) while the PxcL mutant showed lowered H+ uptake activity when compared with the WT (Inago et al., 2020). These results suggest that PxcA and PxcL differentially control H+ exchange activity in cyanobacteria. The mutational loss of Ycf10 and DLDG1 also differentially impacted chloroplast function, such that the highly induced NPQ in the ycf10 and dldg1 mutants was diminished and enhanced, respectively, with increasing illumination times of the fluctuating-light (Figure 7; Harada et al., 2019). Furthermore, proton conductivity (gH+) in the ycf10 mutants was higher than WT at the low AL (Figure 6d); alternatively, dldg1 mutant exhibited lower gH+ than WT at the low AL (Harada et al., 2019). These results propose that Ycf10 and DLDG1 are differentially involved in light-induced H+ extrusion and uptake across the chloroplast envelope membranes, as is the case for the cytoplasmic-membrane localizing PxcA and PxcL in cyanobacteria, although how envelope-localized Ycf10 and DLDG1 influence gH+ is still elusive. A possibility is that alteration of stromal pH by the ycf10 or dldg1 mutation influences enzymatic activities in the stroma resulting in unusual ATP consumption and synthesis. Ycf10 inhibits DLDG1-dependent Na+ extrusion activity, and DLDG1 relaxed Ycf10-dependent K+ export or inhibition of K+ import activity in E. coli (Figure 8), suggesting that the two proteins interact to control exchanging Na+ or/and K+ in company with that of the H+ extrusion across the chloroplast envelope membranes.
4.2 Ycf10-dependent NPQ control
The qE in land plants is triggered by the acidification of the thylakoid lumen (Li et al., 2009). Since Ycf10 and DLDG1 are localized in the chloroplast envelope-membranes, they cannot directly control the acidification of the lumen. However, tobacco ycf10 mutants and Arabidopsis dldg1 mutants induce excess NPQ (Figures 4 and 5; Harada et al., 2019), indicating that Ycf10 and DLDG1 are required to regulate photosynthesis by adjusting the pH for the entire chloroplast (both in the stroma and the lumen) as regulators for H+ translocation across the envelope membranes. Alternatively, K+ and/or Na+ homeostasis was impaired in the mutants that must affect photosynthesis control (Li et al., 2021; Szabò & Spetea, 2017) supposing Ycf10 and DLDG1 are involved in the Na+/H+ and/or K+/H+ antiport across the envelope membranes. There are further unclarified issues. Specifically, sustained NPQ induction in the ycf10 mutants was observed in comparison with the WT plants, even under low AL illumination (35 μmol m−2 s−1) (Figure 5a), perhaps, due to the facilitation of the cyclic electron transport chains in the ycf10 mutants, resulting in high levels of luminal acidification with low AL intensity illumination in the mutants. On the other hand, no or slight alteration of ΔpH in the Ycf10 mutants was observed at low AL (Figure 6b). One possibility is that both thylakoid lumen and stroma are simultaneously more acidified in the ycf10 mutants than in WT at the light conditions. However, this idea still could not explain why ycf10 mutants showed altered gH+ (Figure 6d).
Although our data suggest the presence of the evolutionally conserved H+ translocation system that controls oxygenic photosynthesis, there are still unclarified issues: such as (1) the methods by which Ycf10- and DLDG1-dependent H+ translocation across the envelope membranes is regulated in a light-dependent manner; (2) the exact nature of the transporter activity regulated by Ycf10 and DLDG1; (3) the mechanism of how Ycf10 and DLDG1 regulate gH+; (4) the characterization of Ycf10, DLDG1, and the possible Ycf10/DLDG1 interactor FLAP1 to clarify the entire mechanism of NPQ control in chloroplasts.
ACKNOWLEDGMENTS
We thank Ms. Mina Goto for statistical analysis, all people in Masuda lab for experimental support, and the Biomaterial Analysis Division of Tokyo Institute of Technology for support with the devices used and technical assistance. This work was supported by MEXT/JSPS KAKENHI (grant no. 21H02075 to S.M.)
CONFLICT OF INTERESTS
The authors declare that there is no conflict of interest.
AUTHOR CONTRIBUTIONS
S.M. designed the research; all authors performed experiments and analyzed data; and S.M. wrote the article.
Open Research
DATA AVAILABILITY STATEMENT
The sequence data from this article can be found in the Arabidopsis Information Resource database (https://www.arabidopsis.org/) under the following accession numbers: Arabidopsis Ycf10 (ATCG00530), DLDG1 (At4G31040) and FLAP1 (At1G54520), in the NCBI database (https://www.ncbi.nlm.nih.gov/nuccore/) under the accession number: tobacco Ycf10 (NC_001879.2) and pHP45Ω plasmid (K02163.1), in the Sol Genomics Network database (https://solgenomics.net/organism/Nicotiana_tabacum/genome) under the accession number: tobacco DLDG1a (Nitab4.5_0000170g0200.1) and DLDG1b (Nitab4.5_0000807g0130.1), and the CyanoBase database (http://genome.kazusa.or.jp/cyanobase) under the accession number: Synechocystis PxcA (slr1596) and PxcL (sll1685).


