Results of the IX International Spectroradiometer Intercomparison and impact on precise measurements of new photovoltaic technologies
Abstract
Today's variety of photovoltaic (PV) technologies imposes new challenges to laboratories and industries to precisely measure the performance of devices and, consequently, to accurately estimate the energy yield once installed in a specific location. Spectroradiometry has become a key discipline for metrology applied to PV: Spectral irradiance is one of the three parameters according to which solar simulators are classified according to IEC 60904-9; precise spectrum measurements are a key factor in the spectral mismatch calculation. Finally, energy rating calculations according to IEC 61853 involve spectral irradiance conditions different than the AM1.5G standard spectrum. To tackle these issues, since 2011, the International Spectroradiometer Interlaboratory Comparison (ISRC) takes place annually in different locations of Europe with the participation of laboratories, research institutes, and industry partners to assess spectral measurement capabilities and share good measurement practices and protocols. In this paper, several results of the 9th ISRC 2019 are presented, looking in particular at the impact on characterization of new technologies like organic devices (OPV), dye-sensitized (DSSC), and perovskites.
1 INTRODUCTION
Spectroradiometry has become a key discipline in order to achieve precise measurements in the photovoltaic sector, from top-level calibration laboratories to industry in the production chain1, 2; new challenges have to be tackled, considering the increasing importance of an energy rating approach3 Since 2011, the International Spectroradiometer Interlaboratory Comparison (ISRC) takes place in different locations of Europe with the participation of top level laboratories, research institutes and industrail partners.4-6 At present, the need for a precise measurement of the spectral irradiance is due to the ample and continuously increasing variety of technologies and materials used for cutting-edge PV devices, characterized by very different spectral responsivities with respect to the reference devices used for their calibration.7, 8 This latter can be crystalline Si (with or without optical filters for reducing spectral sensitivity) used for outdoor or in indoor solar simulators or pyrheliometers and cavity radiometers for outdoor calibration. Whatever sensor is chosen, the difference in spectral responsivity between the device to be measured and the reference sensor generates a spectral mismatch, unless the measurement is performed using exactly the reference spectrum (usually AM1.5G according to IEC 60904-3), which is most unlikely the case (especially in indoor measurements). In addition to measurements at Standard Test Conditions (STC), the energy rating standard IEC 61853 foresees performance predictions in different climates,9 with spectral irradiance characteristics very different from the AM1.5G standard. Amongst them, the alpine region is characterized by very low values of air mass (AM), with rich ultraviolet (UV) content and very high irradiance peaks due to the lower atmospheric absorption, decreased Rayleigh scattering and low humidity.10, 11 This peculiarity suggested to locate the 9th ISRC at the premises of the Astronomical Observatory of Saint-Veran (France), geographical coordinates N44°41′56″ (N 44.6°); E006°54′30 ″ (E 6.9°), altitude 2,936 m a.s.l., during the week 24–28 June 2019. This location offers the possibility to compare direct normal irradiance (DNI), global normal irradiance (GNI), and global horizontal irradiance (GHI) spectral measurements with characteristics close to AM1 and air pressure of about 74% of the atmospheric pressure at sea level. The participants to the 2019 ISRC were 10 laboratories and research institutes active in the PV measurement sector and several actors of the instrumentation industry sector. Moreover, for laboratories having an ISO 17025 accreditation, intercomparison and round-robin campaigns are mandatorily prescribed. As a side activity, primary calibration of PV reference cells of various types was performed against PMO6 cavity radiometers directly traceable to the World Radiometric Reference Group (WRR) in Davos.12 The present work is focused on the spectroradiometers interlaboratory comparison describing the measuring systems, the data acquisition protocol, the data analysis techniques, and presenting relevant results. We will analyze the absolute spectral irradiance differences among acquired spectra and the impact of these differences on spectral mismatch correction factor (MF), parameter directly affecting the calibration performance of any PV device.
2 EXPERIMENTAL APPROACH
In this section, the experimental apparatus used to carry out the intercomparison is described, focusing only on the spectroradiometers and not on the system used for primary calibration of reference cells. During the last 10 years, the variety of spectroradiometers available on the market has considerably increased, ranging from relatively cheap instruments to top level ones. They are different in technology (single or multistage rotating grating monochromators, CCD array based instruments for fast measurements), in measurement range (from the standard 300–1,100 nm of single crystalline silicon detector to 280–2,500 nm of dual- and triple-detector), principle of operation (e.g., filter radiometers, measuring only the spectral contents of selected wavelength bands and, then, mathematically reconstructing the spectrum up to 4,000 nm), and measurement configuration (e.g., instruments configured to measure only DNI, instruments adaptable to measure GNI, DNI, and diffuse irradiance). A list of the instruments present at the intercomparison is shown in Table 1. Throughout this paper, the participants will be labeled anonymously with letters from “Lab A” to “Lab J” in random order (not alphabetical).
| Institution | Spectroradiometer | X'Meas. Quantity |
|---|---|---|
| AIT |
Ocean Optics Maya 2000 Pro Ocean Optics NirQuest 512 |
DNI |
| EKO Europe | EKO rotating shadow-band RSB-01S | DNI, GNI, Diffuse |
| ENEA | StellarNet | GNI |
| ESA | Ocean Optics NirQuest 512 | DNI |
| JRC–ESTI | EKO (MS701, MS710, MS712) | DNI, GNI, GHI |
| CAS140 | DNI, GNI | |
| PMOD/WRC Davos | PSR spectroradiometer | DNI |
| PTB | CAS140CT | DNI |
| Radboud University Nijmegen | EKO MS711 | GNI |
| RSE | Spectrafy SolarSim D2a | DNI |
| SERIS | Avantes | GNI |
| SUPSI | EKO MS710 + MS712 | GHI |
- a Filter radiometer measuring signals of filtered detectors and then using mathematical model to reconstruct the spectrum.
All the trackers had tracking accuracy of ±0.05°. Five of the instruments present at the campaign were able to measure only DNI, three were able to measure only GNI, and three were equipped with collimated tubes to switch from GNI to DNI measurements. Due to technical reason, one participant (Lab J) measured GHI instead of GNI, with Lab A providing reference in dedicated time slots. In order to be able to compare spectra acquired almost at the same time, all the measuring systems had their clock synchronized to a GPS driven reference clock to within ±5 s and periodically checked during measurement sessions. Spectra were continuously acquired during the clear sky days; each participant followed its own acquisition timing and protocols (i.e., frequency of dark measurements, merging of subspectra, and wavelength data interpolations). However, only those spectra acquired in time slots having irradiance stability within ±1% accordingly to a reference pyrheliometer (sky stability criterion) can be considered for comparison. Moreover, some of the time periods with stable sky conditions had an insufficient number of acquired spectra; therefore, only those periods satisfying the sky stability criterion and with the largest number of available data have been used for comparison.
Before the intercomparison campaign, the spectroradiometers were checked by participants at their facilities and then checked again after the end of the campaign; this good practice allows to check that the measurement systems were in good working condition during the campaign, excluding thus significant drifts or damages due to transportation. One interesting aspect of the intercomparison exercise is checking the equivalence of the various calibration chains through which the participants derive their reference; an overview of the used calibration methods and chains is given in Table 2.
| Institution | Calibration |
|---|---|
| AIT | In-house, standard lamp |
| EKO Europe | In-house, standard lamp |
| ENEA | External lab |
| ESA | Manufacturer |
| JRC–ESTI | In-house, standard lamp |
| PMOD/WRC Davos | In-house, standard lamp |
| PTB | In-house, standard lamp |
| Radboud University Nijmegen | Manufacturer |
| RSE | Manufacturer |
| SERIS | In-house, standard lamp |
| SUPSI | In-house, standard lamp |
Most of participants calibrate their spectroradiometers making use of standard lamps, which guarantee high accuracy, reproducibility, and stability; however, the emission spectrum of a standard halogen lamp is extremely poor in the UV region and, in general, exhibiting an integrated irradiance of about 200–300 Wm−2 in the wavelength band from 250 to 2,500 nm.13 The standard lamp low UV content is particularly relevant when measuring natural Sun spectrum at 3,000 m altitude where, due to the lower atmospheric absorption, very UV-rich spectra and high values of irradiance are measured. Regarding measurement uncertainties, Labs A, B, C, F, G, I, and J provided detailed uncertainty calculations for each wavelength or wavelength bands, whereas the others did not provide information on their uncertainties. As a consequence, a sensible and realistic performance statistics analysis has been possible only including those participants.
3 SELECTED METHODS FOR SPECTRA COMPARISON
- Absolute values comparison: At each wavelength, the absolute values of spectra are compared against an assigned value or a value taken as reference. In this work, due to the insufficient amount of information on measurement uncertainties, and for continuity with analysis of previous ISRC editions, the values measured by Lab A are taken as reference to calculate deviations.
- Comparison of relative spectral content in defined wavelength bands: This approach does not compare the absolute values wavelength-by-wavelength (W-W), but the content of the spectra integrated in several wavelength bands. This method is worth to be considered because in IEC 60904-9, it is used to classify solar simulators. Moreover, it is a good approach to evaluate the agreement of spectra shapes.
- Comparison of a derived parameter: Instead of comparing directly the spectra, a parameter of interest is calculated, and then, this latter is compared. In the present work, the parameter of interest is the spectral mismatch factor (MF), which affects all performance measurements of any PV device.
Amongst the three approaches, the first is the most analytical; comparing the absolute values means including all the sources of error of the measurement chain: Calibration of the standard lamp, transfer uncertainty of the in-house calibration of spectroradiometer, and alignment are the most relevant ones. Using the second and third methods, basically, only the spectrum shapes are compared. Moreover, absolute values comparison implies interpolation of measured spectra on the same wavelength axis; in the present work, spectra have been interpolated using a Hermite piecewise polynomial, which takes into account not only the values on the nodes but also the first derivative of the spectrum function. All the spectra have been interpolated on a grid with 0.1 nm step, which is a good compromise between computational cost and resolution of the measured peaks.
4 MEASUREMENT UNCERTAINTIES
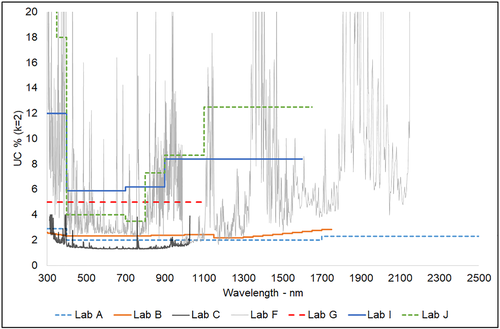
Each participant was asked to provide its measurement uncertainties for spectral irradiance. Estimation of measurement uncertainty is mandatory for laboratories following an ISO 17025 accreditation scheme but nevertheless is important for every laboratory, in order to assess the reliability of its measurements. The detailed uncertainty budget was not asked, and it is not the purpose of this work to go into details of estimation of measurement uncertainty of spectral irradiance.14 Hereafter (Table 3), a summary of the given measurement uncertainties is presented, having grouped in wavelength bands the uncertainties for Labs B, C, and F, because the former provided uncertainty values for each wavelength, and the latter in bands of 20–50 nm each. The plot in Figure 1 shows the detailed information provided by participants. For performance statistics analysis, the detailed information will be used.
5 WAVELENGTH-TO-WAVELENGTH ANALYSIS
5.1 Direct normal irradiance
In this section, an analysis of direct normal irradiance (DNI) spectra is presented. Each participant followed its own measurement timing and protocol, but in general, everyone was able to measure spectra every minute or few minutes. However, not all participants were able to measure throughout the entire day: Several participants were able to measure only in several time slots, due to difficulties in reaching the observatory (special transport means allowed only few passengers per time). To select spectra set suitable for comparison, the following filtering criteria have been applied: (1) check of sky stability condition as described above; (2) for each slot with stable sky, the number of available spectra per participant has been calculated; and (3) stable slots with the highest number of acquired spectra have been considered for further analysis. It has been found that for those participants measuring DNI the days with most available measurements were June 26th and 27th; on the 26th, the comparison is done between participants Labs A, C, E, and G in the time slot 11:57–12:45 (UTC + 1); on the 27th between Labs A, B, C, D, E, F, and H in the time slot 10:45–11:10 (UTC + 1). For each time slot, the acquired spectra for each participant have been averaged to have a single spectrum to be used for wavelength and bands analysis, once having checked that all the spectra of each participant were close to each other (Figure 2), and eventual outliers and artifacts removed. Figures 2 and 3 show all the spectra acquired in the time slot 11:57–12:45 (UTC + 1), day 26th and their averages divided per participant. The total number of spectra considered for calculation in this time slot is 141.
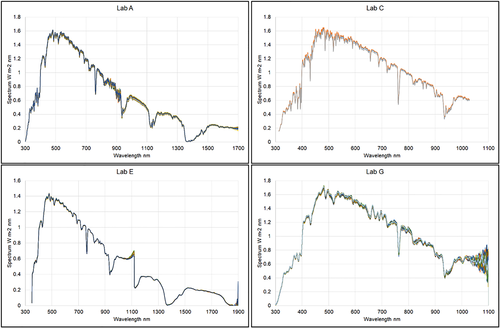
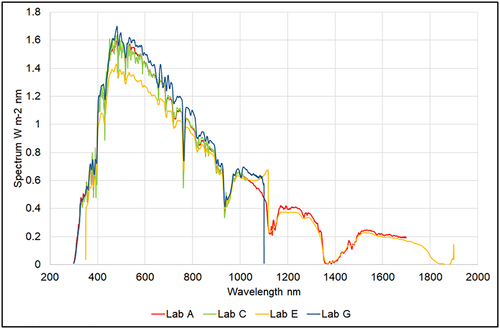
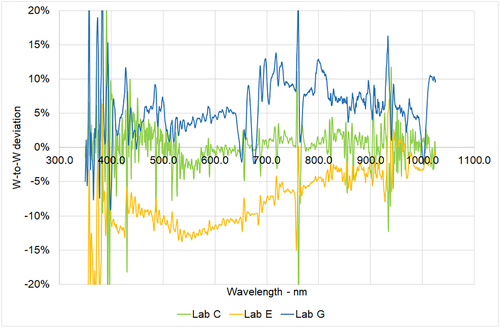
Analyzing the graphs, the first consideration is that there are not two participants measuring in the same wavelength range, they are all four different; secondly, Lab E spectra are characterized by a drop after 1,100 nm, probably due to artefacts on the merging of raw data given by the detectors of the instrument; finally, Lab E measurements were systematically lower in the region 400–700 nm with respect to the other three participants. During this time frame, the AM varied between 1.07 and 1.11. Taking the average spectrum measured by Lab A as reference, the following graph shows the deviations of Labs C, E, and G from the reference (Figure 4). The common wavelengths for these three spectra are within 350–1,025 nm; all of them have been interpolated on an uniform grid with step 0.1 nm. A first visual comparison evidences a very good agreement between the reference and Lab C, being within ±5% on almost the entire spectrum; Lab E has better agreement after 700 nm; Lab G is generally within ±10% except the band 700–800 nm. In all cases, there are spikes in the UV part before 400 nm, but this is a common fact in almost all spectra comparisons due to the very low signals of detectors in the UV and to the calibration issue concerning the very low emissivity of halogen standard lamps in 300–400 nm region.
 (1)
(1)where x is the measured value by a participant,
 is the reference value, and UC(.) is the expanded uncertainties (k = 2 in case of Gaussian distribution); this equation assumes the statistical independence between x and
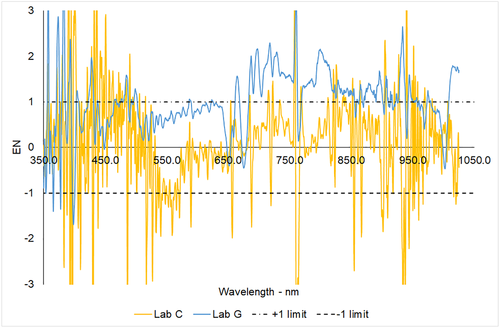
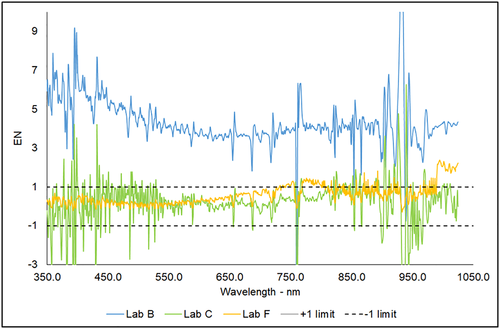
 . The EN numbers are calculated for all wavelengths in the common range 350–1,025 nm and are shown in Figure 5.
- EN ≤ 1: satisfactory agreement
- EN > 1: unsatisfactory agreement
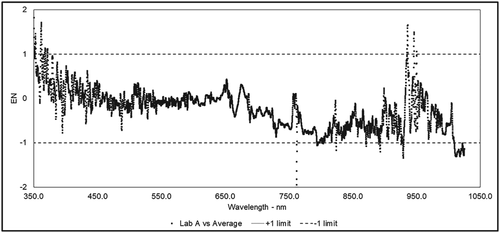
The classification in satisfactory or unsatisfactory depends not only on the difference between the two measured values of the same quantity but on the difference evaluated with respect to the declared uncertainties; it is possible therefore that a participant distant from the reference obtains satisfactory results while another participant closer to the reference obtains unsatisfactory EN scores, if the latter uncertainties are too small respect to the difference. Considering this aspect, performance statistics is a useful tool for each laboratory to assess its own calculated uncertainties. In the specific case, the agreement is unsatisfactory in the UV (which is a common issue) and after 700 nm. Throughout all the analyses, the reference for EN numbers calculation is Lab A, which has been used as reference in all the previous intercomparison campaigns. The consistency between Lab A and the average of spectra of all participants is proofed in Figure 6, showing the EN numbers between Lab A and the average (taken as reference with its calculated uncertainty) of the spectra acquired in the second time frame (having more available data).
The second time frame considered above was on day June 27th between 10:45–11:10 (UTC + 1) with Labs A, B, C, D, E, F, and H measuring DNI. The AM in this frame varied between 1.07 and 1.09. The selection of spectra useful for comparison follows the same methodology already described; the suitable selection of data is shown in Figure 7.
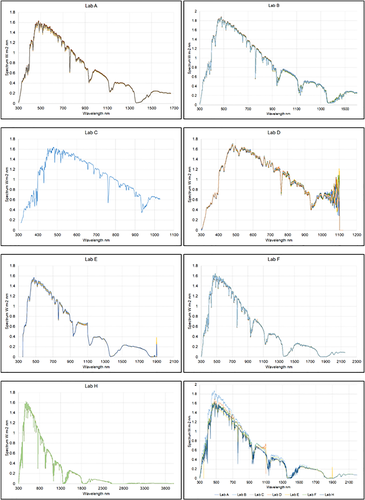
At a first sight, some considerations can be inferred: First of all, again, all participants measured in a different wavelength range, and in particular, one participant's spectra are extended up to 4,000 nm; in this case, the instrument is not a spectroradiometer but a filter radiometer, and the part above 1,200 nm is mathematically reconstructed; this instrument therefore is suitable for outdoor use. All spectra except Lab B have their peak around 1.6 W m−2 nm−1; however, this discrepancy in the absolute values does not necessarily prelude to a difference in shape. Lab E confirms the possible artefact at around 1,100 nm, which might be due to the merging algorithm between the two sub-spectra portions acquired by the detectors of the instrument. Last, Lab D measurement is dominated by noise after 1,000 nm. These considerations shall be quantified by the wavelength-to-wavelength comparison, which is performed using the average spectrum of each participant in this time frame, having acknowledged the stability of irradiance in this period. The total number of acquired spectra for this time frame analysis is 331.
In order to compare the absolute values point-by-point, the same approach used on day 26th with different participants has been used. The common wavelength range is the same, limited within 350–1,025 nm, then interpolated at 0.1 nm step to define with sufficient precision the measured peaks. Figure 8 shows the differences for all participants using Lab A as reference.
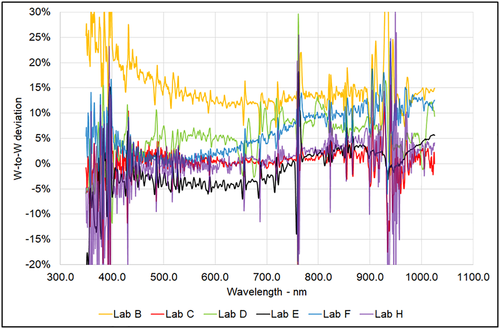
Although a numerical quantification of the agreement between measurements will be inferred using EN numbers, from the graph above Lab B confirms to be considerably higher than all the others, constantly above +10% respect to the reference. The reference is close to the average value of all spectra at least until 700 nm, being that the differences are distributed equally above and below the horizontal axis, whereas after 700 nm, probably the reference is slightly above the average. There is a good agreement of Lab C and Lab H to the reference and between themselves, whereas Lab F tends to deviate linearly in the NIR part of the spectrum. Lab F stated that these measurements were unintentionally taken without the internal calibration files of the spectroradiometer manufacturer due to software problems. Consequently, within these data, the nonlinearity correction of the detector as well as the correction of the wavelength dependent transmission losses is not applied. This could be the origin of the observed strong deviation in the NIR part of the spectrum. Comparing Figures 8 and 4, it seems that for DNI spectral measurement all participants are generally within ±10% respect to the reference, with only one outlier. It has to be reminded that the W-to-W comparison method is by far the most analytical, because there is no filtering action on outlier values as happens analyzing spectral band contents where integrated ratios relative to each spectrum integral are computed. Considering the expanded uncertainties provided by participants, for Labs B, C, and F, the performance statistics analysis can be performed. Looking at Figure 9, it is evident that the mutual uncertainties between Lab A and Lab B are underestimated, being Lab B completely above the “good agreement” limit of EN = 1; regarding Lab F, the agreement with the reference is good except for some outliers in the NIR part of the spectrum. A hypothesis for this behavior can be due to dark measurements procedures and uncertainties, which play an important role in outdoor measurement campaigns where sensors internal to the instruments are continuously exposed to sunlight, and also, the instrument body is not kept at room temperature like in indoor operations. Therefore, the two Labs might have used different routines for dark measurements, whereas the mutual uncertainties seem to be quite well in agreement in this case. For Lab C, the agreement is generally good except for outliers in the NIR and UV regions.
5.2 Global normal spectral irradiance analysis
Three laboratories measured global normal irradiance (GNI): Lab A (as reference), Lab D, and Lab I, using three systems with very different characteristics: Lab A used a system without collimating tubes composed by three detectors, Lab D an instrument with rotating shadow band, able to measure contemporarily GNI, DNI, and diffuse spectral irradiances; Lab I used a three-channels instrument, equipped with integrating sphere and optical fiber. The instruments of the three participants were mounted on different trackers. The experimental approach to measure GNI was the same as DNI measurements and the data analysis techniques as well. In this case, the best period in terms of sky stability and number of available data was on day 27th between 13:40 and 14:10, with AM comprised between 1.20 and 1.28. In Figure 10, the spectra selected for comparison are shown, for a total of 89 spectra, together with the averages per participant. Once again, the irradiance stability measured by the reference pyrheliometer is confirmed by the acquired spectra, which are very close to each other; however, looking at the bottom right plot in Figure 10, Lab I peak point around 1.4 W m−2 nm−1 seems too low. All cosine diffusers connected to optical fibers were mounted onto the same tracker, equipped with a mounting structure for the alignment, so it is improbable this difference to be due to misalignment; one of the possibilities could be related to the spectroradiometer calibration. Looking at the W-to-W comparison of the average spectra shown in Figure 11, Lab D appears well in-line with Lab A (being the difference within ±10% throughout all the range except for UV before 350 nm and NIR near 1,100 nm), whereas Lab I measured around 20%–30% lower. This considerable difference however might not be dramatic in terms of bands (spectrum shape matters) and consequently also its impact on spectral mismatch factor (MF) calculation. Lab I has previously reported that the in-house calibration was performed with a deuterium lamp with primary calibration (traceable NPL) and an halogen lamp with unreliable calibration, provided by the lamp manufacturer. Lab I has later on performed interlaboratory comparisons and found a systematic deviation in the VIS/NIR range, which is consistent with the deviations observed in this section.
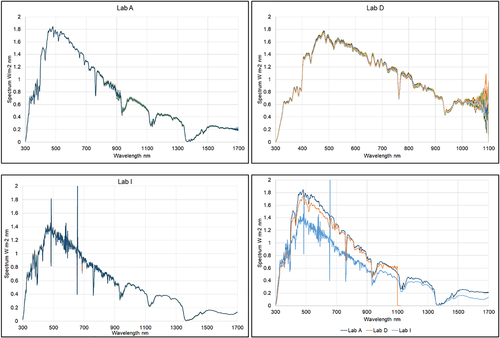
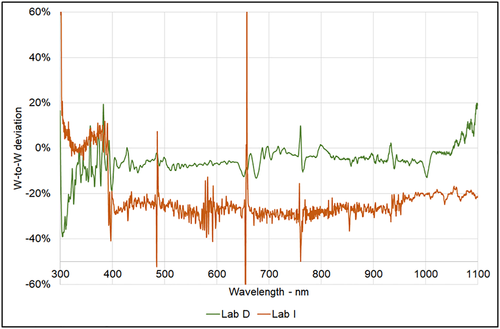
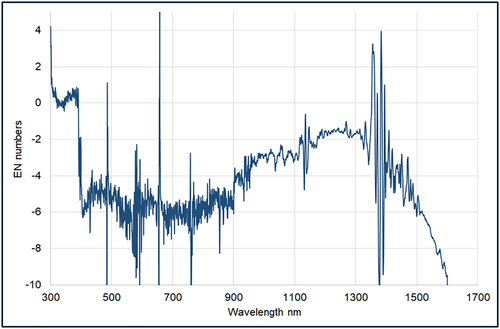
In terms of EN numbers, only Lab I provided measurement uncertainties, and therefore, the following graph shows only the performance statistics between the reference (Lab A) and Lab I. However, excluding Lab D, this operation can be extended up to 1,700 nm. From the result shown in Figure 12, it is evident that are in agreement only in the UV range, where Lab I has calibrated deuterium reference; in 400–1,100 nm, the measurement is affected by a systematic deviation arising from the biased in-house calibration.
5.3 Global horizontal spectral irradiance
For this analysis, the best time slot was during day 27th from 11:55 to 13:30 (UTC + 1). Figure 13 shows all the acquired spectra in this time frame, for a total of 196.
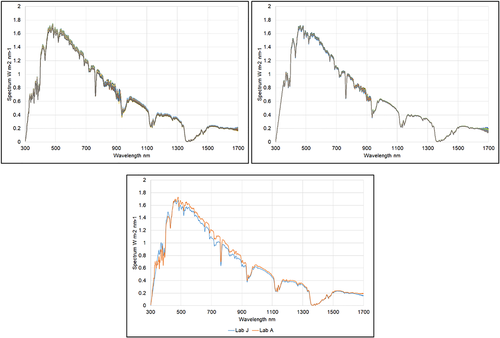
The graph of the average spectra (Figure 13) evidences a slight change in shape near 500 nm, where Lab A crosses Lab J spectrum; this effect is better appreciated in the point-by-point analysis below (Figure 14).
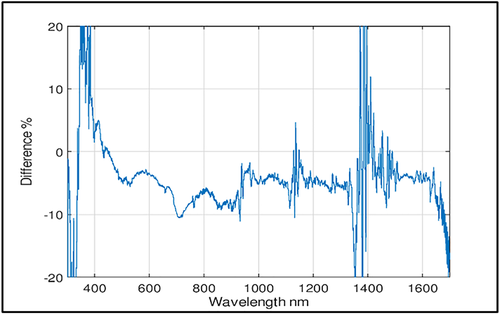
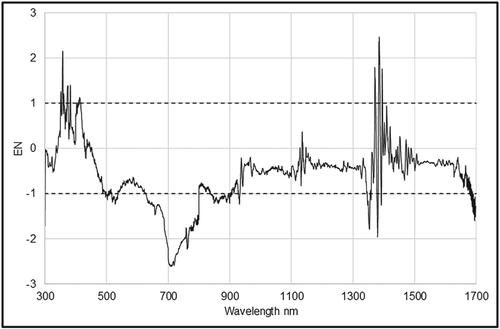
The agreement between the spectra is generally within 5% excluding the portion below 400 nm and around 1,400 nm due to the very low values there. Compared with previous absolute values comparisons, this agreement can be considered good. To assess the agreement of the two average spectra with the two mutual uncertainties, the EN numbers have been calculated; they are shown in Figure 15; it is evident that the uncertainties have been correctly estimated in the 300–400 nm part, whereas near 700 nm, they have been underestimated. The EN < −1 after 1,600 nm are attributable mainly to noise.
| Lab A | 300-400 nm: ± 2.9% | Lab F | Calculation W-by-W. |
| 400-1700 nm: ± 2.0% | Approximated summary: | ||
| 1700-2500 nm: ± 2.3% | 300-400 nm: ± 7% | ||
| 400-800 nm: ± 2.5% | |||
| 800-1000 nm: ± 7% | |||
| 1000-1400 nm: ± 3% | |||
| 1400-1800 nm: ± 4% | |||
| 1800-2200 nm: ± 8% | |||
| Lab B | Provided in bins of 50-100 nm. | Lab G | ± 5% on all range |
| Summary of worst cases: | |||
| 250-400 nm: ± 2.7% | |||
| 400-1150 nm: ± 2.4% | |||
| 1150-1450: ± 2.3% | |||
| 1450-1750: ± 2.8% | |||
| Lab C | Calculation W-by-W. | Lab H | No information provided |
| Approximated summary: | |||
| 313-350 nm: ± 3% | |||
| 350-400 nm: ± 2% | |||
| 400-1000 nm: ± 1.5% | |||
| 1000-1028 nm: ± 2% | |||
| Lab D | No information provided | Lab I | 240-300: ± 15% |
| 300-350: ± 12% | |||
| 350-400: ± 12% | |||
| 400-700: ± 5.9% | |||
| 700-900: ± 6.2% | |||
| 900-1600: ± 8.4% | |||
| Lab E | No information provided | Lab J | 300-350 nm: ± 58% |
| 350-400 nm: ± 18% | |||
| 400-700 nm: ± 4% | |||
| 700-800 nm: ± 3.5% | |||
| 800-900 nm: ± 7.3% | |||
| 900-1100 nm: ± 8.7% | |||
| 1100-1650 nm: ±12.5% |
5.4 Spectral contents in bands
For most of the calibration involving a PV device, only the knowledge of the spectrum shape of the light impinging on the reference and on the device under calibration is needed. One notable exception is the calibration of reference cell using the integrated spectral irradiance method. Spectroradiometers in photovoltaics are mainly used for classifying light sources (normally solar simulators) according to IEC 60904-9 or calculating the spectral mismatch factor, which will be described in the next section. In this section, the relative spectral content of the spectra in several defined bands of interest is analyzed: Two different sets of bands have been chosen for the analysis: The first is defined in the present IEC 60904-9 Ed.2 (see Table 4) and the second in the future IEC 60904-9 Ed.3, which at this moment is under approval process at the International Electrochemical Committee. Both of them are (will be) used to classify solar simulators accordingly to their match with the AM1.5G standard spectrum defined in IEC 60904-3, but the second one will extend the range from 400–1,100 nm to 300–1,200 nm; this last is a more appropriate range for the calibration of recent PV device technologies, exhibiting a wider range of spectral responsivities.
| IEC 60904-9 | |
|---|---|
| Ed. 2, nm | Ed. 3, nm |
| (ai, bi) | (ai, bi) |
| 400–500 | 300–470 |
| 500–600 | 470–561 |
| 600–700 | 561–657 |
| 700–800 | 657–772 |
| 800–900 | 772–919 |
| 900–1,100 | 919–1,200 |
 (2)
(2) , because of the effects due to integration. Several works have been done to study the error propagation between measured quantities and functionals having them as variables; apart for very basic cases, an analytical expression of the derived uncertainty is not possible, and numerical methods involving Monte Carlo simulations are more and more frequently used.
5.5 Direct normal spectral irradiance
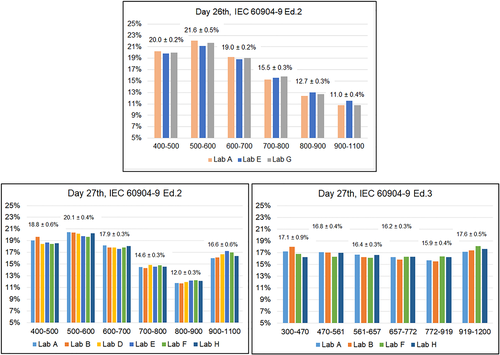
The same spectra sets used for the point-by-point absolute analysis will be analyzed in this section to assess the congruency between participants in terms of relative spectral content. Therefore, 472 spectra will be used in this section. For analysis in bands, the average spectrum for each participant in each time frame is considered. Figure 16 shows the calculated relative contents
 for both the two bands sets specified in the two versions of IEC 60904-9. Here, Lab A is not acting as reference, and results of the other participants are not evaluated against it. In Figure 16, each group of columns represents the content for a specific band; numerically, above each group of columns, the average and max-min deviation of the corresponding values are indicated. In this case, given the very low number of points, the max-min deviation has been preferred to the standard deviation. Not all the participants comparing in the W-to-W analysis (see Figures 3 and 7) could be considered here: Looking at Table 5, only those participants complying with the different range requirements are considered here. Looking at the results, the deviations for each band are all within ±1%, although some of the spectra had considerable differences W-to-W, in the order of ±10% or even more. This uncertainty reduction is partly due to the effect of integration, which smooths errors due to spikes, and partly to the normalization (denominator of Equation 2). The spectral content looks very different using Ed.2 bands respect to Ed.3 bands: In the former, the energy content decreases going to the right part, whereas in the latter, it remains almost constant (the bands of Ed.3 were thought to have a constant contribution for the AM1.5G spectrum; here, the spectra were DNI close to AM 1.1). The agreements shown in Figure 16 look quite comfortable in view of using these instruments on solar simulators, but only a few of them are able to fully cover the 300–1,200 nm range (typically, this problem concerns single-detector instruments). In particular, amongst the three participants on day 26th measuring DNI, the comparison is possible only using bands of IEC 60904-9 Ed.2, whereas only Lab A is able to cover the Ed.3 range, and therefore this comparison is absent from Figure 16.
| IEC 60904-9 Ed. 2 (400–1,100 nm) | |||||||||
|---|---|---|---|---|---|---|---|---|---|
| Lab A | Lab B | Lab C | Lab D | Lab E | Lab F | Lab G | Lab H | Lab I | Lab J |
| IEC 60904-9 Ed. 3 (300–1,200 nm) | |||||||||
| Lab A | Lab B | Lab C | Lab D | Lab E | Lab F | Lab G | Lab H | Lab I | Lab J |
| Compliant with requirements | |
|---|---|
| Not complaint: required wavelength range not fully covered | |
| Filter radiometer: complaint with range but cannot model solar simulators |
5.6 Global normal and global horizontal spectral irradiance
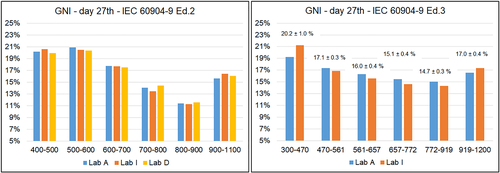
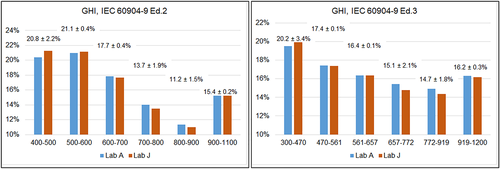
The same approach is followed to analyze the relative spectral content of GNI spectra acquired on day 27th (Figures 10 and 13). The comparison according to Ed. 2 has been possible amongst all the three Labs measuring GNI, but only two of them covered the full range 300–1,200 nm required by Ed.3 (Figure 17), whereas for GHI measurements, both Lab A and Lab J cover the 300–1,200 range. Once again, the deviations are in the same order of those for DNI. Remarkably, the range where the largest deviation is observed (0.9–1.0%) is 300–470 nm, where most of the calibration lamps have poor irradiance content, and therefore, calibrations have larger uncertainties. The GHI spectra show larger deviations in relative spectral content, more evident below 400 nm but low in the last band up to 1,200 nm (Figure 18).
6 IMPACT ON CALIBRATION OF NEW TECHNOLOGIES
 (3)
(3) the spectral responsivity of the reference device, Gm(λ) the measured spectral irradiance used to perform the IV characterization, and
 the reference spectral irradiance (here the AM1.5G). It is worth noting that the MF as defined in Equation 3 is the inverse of that defined in IEC 60904-7 for practical reasons: As defined here, MF > 1 means the spectral correction will increase the measured performance, MF < 1 the opposite. In this work the measured spectra already considered in previous analysis are used to calculate mismatch factors using as reference a crystalline silicon reference cell and several devices of different technologies, listed in Table 6 and whose spectral responsivities have been provided by ESTI laboratory.17, 18 For confidentiality, the various manufacturers are not indicated and all devices remain anonymous. Although during the ISRC several reference cells have been measured against cavity radiometers, the choice of using here a crystalline silicon cell instead of a pyrheliometer is due to the measurement range needed to calculate the mismatch factor, which is 300–1,200 nm and not 300–4,000 nm. If a cavity radiometer is used as reference, the measured spectra are normally artificially extended up to 4,000 nm using the corresponding AM1.5D spectrum, but this would add much more complexity without adding more information.
| Reference Device | ESTI Aspire c-Si reference cell without quartz glass in front |
|---|---|
| WPVS reference cell with quartz glass in front | |
| DSSC | Encapsulated single cell with 77.44 mm2 area |
| OPV | Mini-module with 8 cells in series, module area 0.0192 m2 |
| Perovskite | Mini-module with 28 cells in series, module area 0.03 m2 |
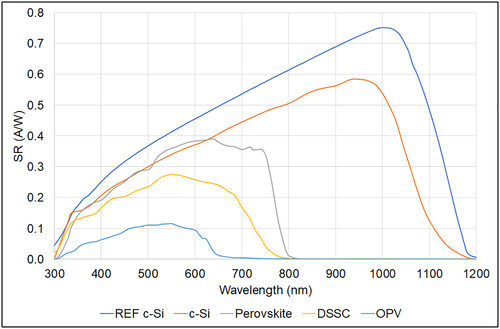
The spectral responsivities of all the devices used in this analysis are shown in Figure 19: Instead of reporting the normalized curves, here, the absolute values are showed, in order to appreciate not only the different wavelength regions but also qualitatively the different photocurrents.
6.1 Spectral corrections from DNI spectra
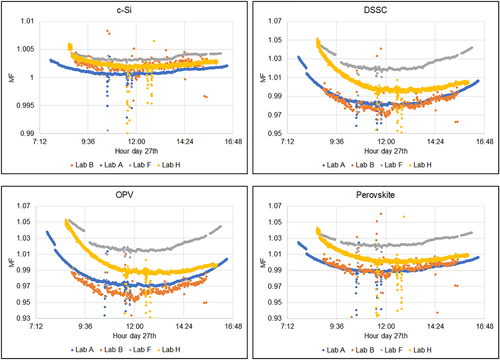
Photovoltaic devices can be calibrated outdoor under natural sunlight both measuring the irradiance in GNI or DNI; in any case, the reference spectrum is the AM1.5G. Here, all the suitable DNI spectra, covering at least the range 300–1,200 nm, measured during day 27th have been used to calculate the mismatch factors for the different technologies against a c-Si reference cell. This is a useful exercise to assess the variation of MF during a single day for the different technologies and spectra (Figure 20). The crystalline silicon device has been considered to act as “known-case,” to check the validity of the algorithm to compute the others; as expected, all participants' mismatch factors are within ±0.13% (half max-min in the central part of the smile) so very close to each other. The differences amongst laboratories considering other new technologies are higher; for Perovskite, the difference is in the order of ±1.6%, for DSSC ±1.9%, and for OPV devices even ±2.2%. Looking at the MF, the entity of the correction to the measured IV curve can be appreciated: This would be less than 0.5% for c-Si for all participants, from −2% to +5% for a DSSC device, from −1% to +4% for perovskite, and from −4% to +5% for OPV, depending on the specific laboratory. Given that the IV correction equation is linear respect to MF, these differences would be directly translated into STC performance discrepancies. However, in a real outdoor calibration campaign, most of them would be disregarded after having filtered them for irradiance stability and outliers detection. However, looking at all the subplots of Figure 20, there is a clear tendency of participants to be positioned in the same order respect to the others for all technologies, with Lab F tendentially higher than the other three.
6.2 Spectral corrections from GNI spectra
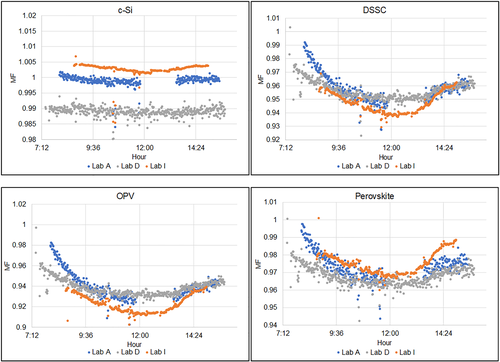
The same approach has been followed to compare the impacts on spectral mismatch factor of GNI spectra, measured on day 27th. Figure 21 is the analog of Figure 20 for GNI spectra. In this case, the three participants are not always in the same relative position on the graphs; in the case of c-Si, the larger deviation observed between Lab A and Lab D (than the deviation between Lab A and Lab I) can be explained by the fact that Lab D instrument does not reach 1,200 nm, resulting in larger spectral mismatch. The differences amongst laboratories considering other new technologies are in this case comparable to c-Si; for Perovskite, the difference is in the order of ±0.6%, for DSSC ±0.5%, and for OPV devices ±1.1%, being the only technology leading to a difference between laboratories above 1%. These corrections would lead to corrections in the order of half a percent, except a 1% correction for OPV. Having AM1.5G as reference spectrum, a GNI measurement leads to a spectral correction of minor entity, because GNI spectra are closer to the AM1.5G than DNI spectra.
7 CONCLUSIONS
In June 2019, 15 research institutes and industrial partners mostly active in the photovoltaic field met at the premises of the Astronomical Observatory of Saint-Veran (French Alps, about 3,000 m a.s.l.) to perform the IX International Spectroradiometers Intercomparison. This annual measurement campaign allows participants to share measurement procedures, good practices, and assess their capability of measuring spectral irradiance. Ten participants submitted their measured spectra (DNI, GNI, and GHI), each one accordingly to its measurement protocols and data analysis. Several time frames during two different days were selected as more suitable in terms of irradiance stability and number of acquired spectra for intercomparison analysis. Results show a very good agreement between participants in terms of relative spectral content in different spectral bands, well within ±1%; however, the new standard (at this moment not yet published) IEC 60904-9 Ed.3 will pose problems to several institutes to cover the new required measurement range 300–1,200 nm. Considering comparison of absolute values wavelength-to-wavelength, spectra were generally within ±10% in the visible range, within ±15% in the UV and NIR, the former due to very low signal and calibration uncertainty using standard lamp; a case of spectrum experiencing up to 40% difference was measured, due to a known systematic bias coming from the calibration of the instrument. Performance statistics analysis has been carried out considering EN numbers as function of wavelength (as defined in ISO/IEC 17043) but only for those participants which provided uncertainty values; in many cases EN numbers were outside the ±1 interval; therefore, considering absolute values, the measured spectra were not in agreement with declared uncertainties. For two measurement days the spectral mismatch factors for four different technologies (crystalline silicon, OPV, DSSC, and Perovskite) were calculated. For c-Si, a good agreement was found, with the exception of instruments not measuring the full range 300–1,200 nm; for the new technologies, differences above ±2.2% were found using DNI spectra. As a final conclusion, an effort is necessary for the spectroradiometry community in the field of PV to better tackle the uncertainty calculations and to improve measurement capability with instruments able to comply with the new IEC 60904-9 Ed.3 standard, when published.
ACKNOWLEDGEMENTS
We would like to thank our colleague Francesco Noseda for the mechanical support during the entire measurement campaign, Giorgio Bardizza for having measured at ESTI the spectral responsivities used in this paper, Mr. Dominique Menel for his support as director of the Observatory, and the municipality of Saint-Veran for the support regarding special transportation means. We thank in particular Willem Zaaiman and Dirk Friedrich for their effort in driving the special transport means, allowing all of us to reach the Observatory. The International Spectroradiometer Intercomparison is an activity organized by the ESTI laboratories and funded by the European Commission Joint Research Centre through the Horizon 2020 programme.


