Morphology, thermal, and crystallization analysis of polylactic acid in the presence of carbon nanotube fibers with tunable fiber loadings through polymer infiltration
Funding information: European Union Seventh Framework Program, Grant/Award Number: 678565; H2020 European Research Council; National Natural Science Foundation of China, Grant/Award Number: 21706039; Natural Science Foundation of Guangdong Province, Grant/Award Number: 2017A030310300
Abstract
The effects of high loading of carbon nanotube (CNT) fibers on the morphological, thermal, and crystallization properties of polylactic acid (PLA) in PLA-CNT fiber composites are investigated. The fabrication methods ensure full impregnation of the fiber by PLA and formation of a large fiber/polymer interface, resulting in an oriented transcrystalline (TC) layer of PLA on the fiber surface. The presence of TC layer in the composite leads to increased PLA thermal stability, higher crystallinity, and faster nucleation. However, the crystal growth rate of TC and bulk spherulite is independent of the type of nucleation. In addition, real-time variable-temperature synchrotron wide-angle X-ray scattering and fiber 2D-wide-angle X-ray diffraction analyses reveal that crystals from either pure PLA or PLA on the fiber surface develop a thermodynamically stable α phase of PLA when isothermally crystallized at 110°C. Furthermore, PLA crystals and long spacing lamellae are preferentially orientated and packed parallel to the fiber axis.
1 INTRODUCTION
With the increasing pollution of synthetic plastic wastes, the development of nonpetroleum and biodegradable materials has gradually become a societal priority and thus an important challenge for the scientific community. Polylactic acid (PLA) is a biodegradable plastic being made of starch, which is not only rich in natural resources but also environmentally friendly. In industry, PLA products can be processed by commonly used techniques such as injection, extrusion, and compression molding.1-3 PLA processing temperature can reach up to above 170°C, showing good thermal stability during production.4 In addition, PLA is stable in many industrial solvents and thus exhibits desirable corrosion resistance. Thanks to these advantages together with acceptable mechanical properties, PLA has been widely used in applications such as biomedicine, automotive decoration and packaging,5-8 being a “pioneer” biopolymer in the commercial market.
However, materials made solely by PLA are brittle, and poor in softness and impact resistance, for example, notched impact strength is less than 3 kJ/m.2, 9, 10 To overcome these drawbacks and try to explore its wider application, people have developed numerous strategies including chemical grafting,11, 12 physical blending,13 and compounding,14, 15 with the modifications mostly affecting PLA thermal and crystallization behaviors.
Nanofillers ranging from crystalline cellulose16, 17 through organoclay18 to low-dimension carbonaceous fillers,19-21 have been successfully incorporated into PLA matrix in order to regulate polymer crystallization, and to enhance its thermal and mechanical properties. Nanocarbons, for example, carbon nanotube (CNT), have been widely observed to act as heterogeneous nucleating agents with respect to polymer crystallization. Xu et al. reported that the nucleation induction, half and end crystallization time for polymer PLA were all notably decreased after dispersing a small amount (<2 wt%) of CNTs in polymer matrix.22, 23 For example, the addition of only 0.02 wt% multiwalled CNT reduced the induction time about 17 min, crystallization half-time around 40 min, at isothermal temperature of 115°C. However, after decades of work on nanocarbon composites it is clear that whereas large increases in electrical properties can be achieved at low volume fractions above the percolation threshold, often below 1 wt%, absolute mechanical properties rapidly fall with increasing volume fraction; thus, it is more effective to use preassembled nanocarbon fibers.24
Assembling CNTs into a macroscopic fiber with nanotubes oriented parallel to the fiber axis was reported as an effective route towards exploiting the excellent axial properties of individual CNT.25 In contrast with filler strategies, preassembling CNTs into highly aligned fibers enables use of extremely long CNTs (>1 mm) at high volume fraction (>10 wt%) in free standing fully formed materials. Typical formats include kilometer-long thin filaments (10 μm-diameter) or unidirectional fabrics about 1 m wide. More importantly, macroscopic fibers and fabrics have mass-normalized conductivity above metals, comparable tensile strength and modulus to carbon fibers, and superior tensile fracture than Kevlar (reference in a recent review by Mikhalchan and Vilatela26). Thus, macroscopic fiber is a relative new class of materials with applications in field such as structural reinforcement fibers, sensors, porous electrodes, and current collectors.26The combination of flexible porous structure,27 moderate surface area (200~300 m2/g),28 and good affinity to many polymers29 make CNT fibers very promising macroscopic reinforcing elements for nanocomposite fabrication. More importantly, composites containing high volume fraction of CNT fibers can be obtained through back infiltration of polymer into porous CNT fiber networks, in which load and charge carrying CNT elements could lead to significant improvements in the resulting composite properties. Using this strategy, a variety of high-performance nanocomposites were obtained, via the infiltration of liquid monomer,30, 31 mixture of epoxy and hardener32, 33 into CNT fiber followed by curing, or through direct infiltration of polymers in their molten state.34
In a previous paper,29 we reported the observation of nonepitaxial nucleation and orientation of different semicrystalline polymers (PVDF, PLA, PEEK, and PP) induced by the presence of macroscopic CNT fibers. Because these composites were prepared by hot-pressing, it was speculated that polymer chain orientation could be induced by shear forces arising during the flow of the polymer melt through the elongated pore structure of the CNT fibers.
A deeper analysis on PLA-CNT fiber composites is performed in the present work. For that, we prepared a series of PLA-CNT fiber composites by immersion in polymer solution followed by drying, with the fiber (highly aligned) loading ranging from 3.5 wt% to as high as 53 wt%. The morphology evolution of PLA crystals was monitored under polarized optical microscope (POM); thermal kinetic parameters were determined and analyzed by differential scanning calorimetry (DSC) measurements under both heating/cooling and isothermal conditions; synchrotron X-ray scattering results showed evidence of the accelerated nucleation in the presence of CNT fibers, and the polymer chain orientation relative to the fiber axis.
2 EXPERIMENTAL
2.1 Materials
Poly(lactic acid; PLA, PLA2002D, Mw = 210 000 g/mol, 4.25% of d-isomer, residual monomer of 0.3%) was obtained from NatureWorks. Dichloromethane and other organic solvents were purchased from Sigma–Aldrich and used as received without further treatment.
Samples of as-spun CNT fibers used in this work were produced by continuous drawing of an aerogel of CNTs directly from the gas phase during CNT growth using a chemical vapor deposition reactor (in vertical position) at 1250°C.35 The reaction was carried out in a hydrogen atmosphere (gas flow of 1.3 L/min) using a precursor feed rate of 2 mL/h. A high winding rate (40 m/min) was employed to produce CNT fibers with a high degree of alignment. Butanol was used as the carbon sources, ferrocene as an iron catalyst, and thiophene as a sulfur promoter, in a concentration of 97.7%:1.5%:0.8%, respectively, producing fibers made up of thin multiwall (3-5 walls) CNTs with an average diameter of 3 ∼ 9 nm.36 It is worth noting that, for a better comparison, CNT fibers were selected from the same batch of as-made CNT fibers at the same synthesis condition, and handling of the fiber was kept as similar as possible.
2.2 Fabrication of PLA-CNT fiber composites
Samples of PLA-CNT fiber composites were produced by a facile immersion-dry technique (Supporting Information Figure S1). Firstly, given amounts of PLA pellets were dissolved in dichloromethane to prepare PLA solutions in different concentration, that is, 0.5, 1, 3, and 10 wt%. Then, as-made CNT fiber was immersed into it for 1 min, taken out and dried at room temperature for 1 d, followed by a further 12 h convection drying treatment in a fume hood at ambient conditions. A transparent thin film of pure PLA was prepared by directly casting the polymer solution onto a clean glass substrate, being peeled and dried. Both the composites and PLA film were kept in a dry state prior to further use. The composites are coded as xCNTf@PLA, where CNTf represents CNT fiber and x denotes the mass fraction of CNTf in the composites. For instance, 3.5CNTf@PLA indicates the composite in which 3.5 wt% CNT fibers are incorporated in PLA matrix.
2.3 Characterization
The surface morphologies of samples were recorded using a scanning electron microscope (SEM, EVO MA15). The scanning surfaces of the specimens were coated with a thin layer ∼5 nm of conductive sputtering gold (Au). For cross-section view, samples were cut (milled) with a focused ion beam on a FIB-FEGSEM dual-beam microscope (Helios NanoLab 600i FEI). Transmission electron microscopy (TEM) was performed on a JEOL JEM 3000F TEM at 300 kV. Optical microscope (OM) images were captured (in reflection) on a microscope (OLYMPUS BX51) equipped with a camera (OLYMPUS ColorView).
 (1)
(1)Polymer nucleation and crystallization were further monitored with a POM (Carl Zeiss Jena with a CCD-IRIS camera, Sony) equipped with a hot stage (THMS600, controlled by Linkam TMS92). The sample was firstly heated at a rate of 40°C/min from room temperature up to a higher temperature (180°C) above polymer melting temperature, at which it was maintained for 3 min to assure that all polymers were completely in the molten state. Then, a cooling rate of 20°C/min was applied from the polymer melt to an isotherm temperature where POM pictures were taken at different time intervals. For some regions of interest, several optical magnifications were taken. Measurements were repeated under the same condition to check the reproducibility.
Wide-angle X-ray diffraction (WAXD) photographs were recorded on a flat-plate camera attached to a Phillips 2 kW tube X-ray generator (nickel-filtered Cu Kα radiation, λ = 1.54 Å) with sample to detector distance of 85 mm (Supporting Information Figure S5). Prior to the diffraction measurements, pure PLA and PLA-CNT fiber composites produced by immersion-dry method were annealed at 110°C for an hour in order to acquire diffractograms of high quality for crystal structure analysis. Real-time wide-angle X-ray scattering (WAXS) experiments were performed at the beamline BL11-NCD, in ALBA Synchrotron Light Facility. The WAXS profiles were acquired with a Rayonix LX255-HS detector, using λ = 1.24 Å. For the isothermal measurements, both for PLA and PLA-CNT fiber at 110°C, the scattering patterns were collected at 30 s/frame for pure PLA and 10 s/frame for PLA-CNT fiber. The time-resolved 1D diffractograms as a function of time were obtained after sample-to-detector-distance calibration as well as background subtraction. Meridional and equatorial 2D WAXS patterns parallel and perpendicular to the fiber axis were integrated with 20° of azimuthal sections. All synchrotron raw data were processed using Fit2D software.38
3 RESULTS AND DISCUSSION
3.1 Sample composition and thermal stability
Composition of the PLA-CNT fiber composites with different mass fraction of the polymer and fiber was determined by TGA. Plots of weight loss (in air atmosphere) vs temperature as well as their derivatives are presented in Figure 1. Three regions of apparent weight loss are observed: at temperatures below 200°C, between 250°C and 400°C, and above 500°C, respectively. At temperatures below 200°C, the weight loss corresponds to the vaporization of residual solvent and water that have strong chemical interactions with PLA molecules. The weight loss occurs at temperature ranging from 250°C to 400°C is attributed to ongoing polymer degradation. Heating after this region, only graphitic materials remained, so the weight percentage at 400°C is taken as mass fraction of the fiber in the composites. The severe weight loss, occurs between 500°C and 650°C, is attributed to oxidation of nanotubes and graphitic materials.39 According to TGA results, we can estimate mass fraction of PLA and CNT fiber in the composites, as listed in Supporting Information Table S1. These immersion-dried PLA-CNT fiber composites contain different amounts of CNT fibers in mass base, 3.5 wt% for 3.5CNTf@PLA, 15.9 wt% for 15CNTf@PLA, 33.7 wt% for 33CNTf@PLA, and 53.2% for 53CNTf@PLA, whereas the concentration of the infiltrating PLA solution varied from 10 wt% through 3 wt% and 1 wt% to 0.5 wt%.
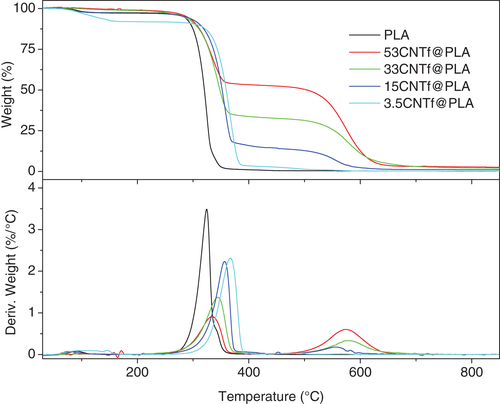
The concentration of CNT fiber also affects the thermal stability of the PLA matrix as is observed clearly in the derivative curves (Figure 1, down). The maximum of the derivatives peaks, associated to polymer degradation (between 250°C and 400°C), appeared at higher temperatures. Small amount of the fiber (3.5 wt%) increased the peak temperature 40°C, from 325°C for PLA to 365°C for 3.5CNTf@PLA. However, the peak temperature decreases with further increase of the fiber content. For instance, the peak temperature was shifted from 365°C to 355°C when increasing the fiber loading from 3.5 wt% to 15.9 wt%, although all composites have better thermal stability than pristine PLA. Some studies have already shown that the thermal stability of PLA was able to be improved by the addition of CNTs.40 The reason why PLA thermal stability decreases with increasing CNTf content could be related to different grade of porosity in the composites, as it is discussed below. Higher amount of polymer surfaces exposed to the atmosphere can accelerate polymer degradation.
3.2 Morphology and texture
3.2.1 SEM observations
Our previous study showed that several polymers in their molten state could easily wet and infiltrate into porous CNT fibers through capillary action as a consequence of their large surface area.29 When CNT fiber is immersed into polymer solution of PLA in dichloromethane and the solvent is removed subsequently, polymer coverage of the inner structure of the CNT fibers also occurred, as shown in SEM images (Figure 2). From both lateral surface and cross-section view, we can find a good coating of polymer PLA layer (initially prepared at 3 wt%) on CNT fiber surface, displaying large and uniform CNT fiber/PLA interfaces.

3.2.2 Optical microscope observations
These observations have been performed in the different composites, with changing polymer fraction, as shown in the OM images in Supporting Information Figure S2. Specifically, we observed PLA coverage on CNT fiber surfaces: (a) from randomly distributed PLA aggregates at low solution concentration of 0.5 wt% (47 wt% of polymer in dry composite), (b) through growing networks of the aggregates at medium concentration of 1 or 3 wt% (65 and 81 wt% of polymer in dry composite respectively), (c) to fully covered polymer at high concentration of 10 wt% (89 wt% of polymer in dry composite). On the whole, the sample made by 3 wt% PLA has an even polymer coverage on the fiber; below this concentration, the fiber surface was not fully covered, whereas excessive polymer remained outside the fiber coverage at higher concentration. Therefore, we intentionally used 15CNTf@PLA sample as the representative PLA-CNT fiber composite for performing different measurements in comparison with pure PLA polymer, unless stated otherwise.
3.2.3 Isothermal crystallization by POM
Isothermal crystallization experiments were performed on samples (15CNTf@PLA) of long continuous CNT fibers embedded in polymer on a Linkam heating stage and followed by POM. The spherulites growth and the evolution of the interface between the bulk polymer and fiber were monitored. In Figure 3, time resolved POM pictures under isothermal conditions (at 120°C, taken as an example) show sequential polymer spherulite growth, from the bulk and in the presence of macroscopic CNT fiber bundles, that is, PLA and PLA-CNT fiber. One obvious observation is that two types of crystalline morphologies were distinguished in CNT fiber contained samples: bulk spherulite (isolated from the fiber) and a transcrystalline (TC) layer (located at the fiber/polymer interface). The latter morphology has a high packing density and grows in the radial direction outwards from and perpendicular to the fiber, covering the whole fiber surface (Figure 4). Moreover, it should be noted that the typical TC layer has a limited depth and appears only near/close to the fiber surface.
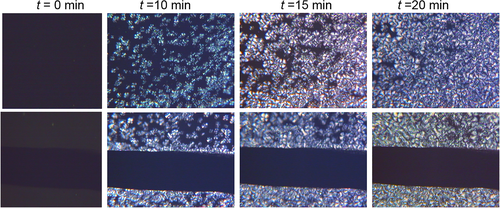

The earlier appearance/formation of the TC layer in the composites has a very important implication: in contrast to the bulk spherulite, the TC layer near the fiber surface experiences accelerated nucleation. Multiple nucleating sites on the fiber surface would favor polymer nucleation, which nevertheless lead to a population of small crowded spherulites due to the restriction of the freely extending polymer chains in such a small area. However, the spherulite growth rate seems not to be affected, because the thickness of the TC layer is similar to the radius of biggest spherulites (Figure 4), and it is assumed that the nucleation of these spherulites was simultaneous to that on the CNTf surface. Then, the spherulite growth rate is rather independent on the type of nucleation, as was previously reported.29
3.3 Thermal analysis
3.3.1 Cooling/melting DSC experiments
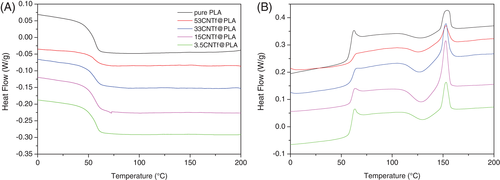
The DSC curves of all composites, carried out by DSC at 10°C/min, are shown in Figure 5. During the cooling (Figure 5A), only the glass transition is observed in all samples. This Tg is centered at around 56°C for all composites. The unique difference was found in the heat capacity increment (ΔCp) at glass transition due to the different concentration of polymer in each composite. For that reason, 53CNTf@PLA showed the lowest ΔCp and 3.5CNTf@PLA the highest among all composites, with the corresponding ΔCp values listed in Table 1. Then, the percentage of PLA content is calculated from the ΔCp values in relation to neat PLA, being the results: 47% for 53CNTf@PLA; 60% for 33CNTf@PLA; 79% for 15CNTf@PLA and 90% for 3.5CNTf@PLA. These values are in good agreement with those obtained from TGA results (Supporting Information Table S1).
| Samples | Tg (oC) | ΔCp (J/g°C)a | (ΔHm − ΔHcc)/ωPLA (J/g)b | χc (%)c |
|---|---|---|---|---|
| 53CNTf@PLA | 60 | 0.25 | 3.4 | 3.7 |
| 33CNTf@PLA | 60 | 0.32 | 1.7 | 1.8 |
| 15CNTf@PLA | 60 | 0.42 | 0.7 | 0.8 |
| 3.5CNTf@PLA | 60 | 0.47 | 1.2 | 1.3 |
| Pure PLA | 60 | 0.53 | 0.2 | 0.2 |
- a Increment of heat capacity at Tg calculated on cooling.
- b Normalized to the actual PLA content in the composite.
- c Enthalpy calculated from the integration from 75°C to 180°C and normalized to the PLA content in the composite using ωPLA obtained by TGA (Supporting Information Table S1).
The subsequent heating at 10°C/min (Figure 5B) showed three thermal transitions at similar temperatures for all samples: glass transition at 60°C, cold crystallization at around 130°C, and finally, melting at 153°C. There is, however, a small but appreciable shifting of the cold crystallization temperature, which appears around 2° lower for composite 3.5CNTf@PLA in relation to neat PLA. Moreover, ΔCp values depend on the polymer content, and the exothermic and endothermic enthalpies are associated to cold crystallization and melting process, respectively. Additionally, there is also a very apparent influence of the composition on the intensity of the physical aging peak at the top of the glass transition. The magnitude of this aging decreases rather markedly with the increase of the CNT fiber, in such a way that the aging is practically absent for composite 53CNTf@PLA.
Although no clear exothermic peaks are observed in Figure 5A, yet a small amount of crystallization is produced during cooling at 10°C/min of these samples, as deduced from the neat enthalpy determined by integrating the melting curves from 75°C to 180°C. This enthalpy represents the initial crystallinity of the sample, that is, the difference between melting and cold crystallization enthalpies (Table 1). From these values, the initial crystallinity can be determined, after normalization to the PLA content in the composite. The corresponding values, shown in the last column of Table 1, indicate that a higher crystallinity is obtained for the composite with lowest polymer concentration. Composites, with lower polymer content, have a higher percentage of polymer in contact to the CNTf surface, and taking into account that heterogeneous nucleation is faster than bulk nucleation, the global crystallization rate should be higher, justifying the increment of the crystallinity with decreasing polymer content.
3.3.2 Isothermal crystallization
The heat flows generated from the energy release during polymer isothermal crystallization from the melt were recorded as a function of time. Supporting Information Figure S3 shows DSC isotherms for PLA crystallization in the absence/presence of CNT fibers at different isothermal temperatures (Tc). The composite takes substantially less time to crystallize in comparison to the pure polymer. For example, the exothermal maxima in the composite appears ∼20 min earlier than that seen for neat PLA at varied temperatures.
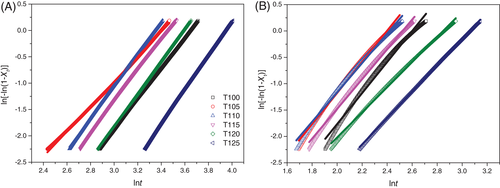
Relative crystallinity (Xt) is widely used to evaluate the relative overall rate of polymer crystallization, and can be obtained by integrating the crystallization exotherm as a function of time and normalizing by the total crystallization enthalpy of each experiment. Typical sigmoidal Xt curves of pure PLA and 15CNTf@PLA composite are depicted in Figure 6. It can be observed, first, that the maximum rate occurs in both cases at intermediate temperatures, and, second, the composite reaches the maxima plateau much earlier than the neat polymers at any temperature between 100°C and 125°C.

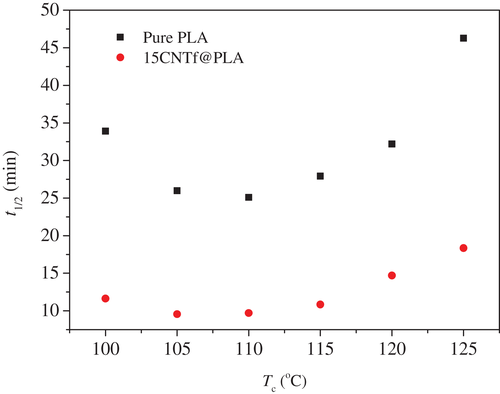
Very often, the kinetic parameter t1/2 is used to quantify the kinetics of polymer crystallization, which defines the time taken to complete 50% of relative crystallinity. For all analyzed temperatures, t1/2 is much smaller for the composite than that for the pure polymer, and the gap time is kept approximately constant for all temperatures (Figure 7). However, the role of the isothermal temperature in the crystallization is rather similar in both systems. This is due to the fact that the spherulitic growth rate is similar, but the nucleation is faster in the composites, and therefore the effect of the crystallization temperature in the global crystallization rate is equivalent: the minimum of t1/2 is found at Tc = 110°C in both cases, although t1/2 is always lower in the composites but practically keeping constant the difference with the neat polymer.
 (2)
(2) (3)
(3)
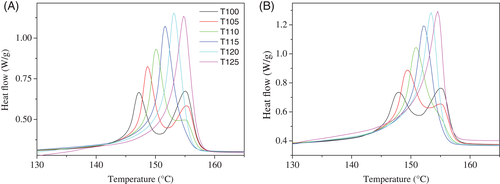
Finally, the subsequent melting curves after isothermal crystallization reveal also a similar behavior in both cases (Figure 9). Low isothermal crystallization temperatures, below 115°C, lead to rather imperfect crystals whose melting temperature is low enough to allow the recrystallization, and the reformed crystals melt at higher temperature. For that reason, the samples crystallized below 115°C, show a two-melting-peak profile. In addition, there is no significant variation of Tm as function of Tc (Supporting Information Figure S4). Maximum differences of just 0.5°C at lower crystallization temperatures are observed, being reduced with the increase of Tc, giving an idea that the crystal morphology is not practically affected by the heterogeneous CNTf composites. This fact is also analyzed in the next section.
3.4 Synchrotron WAXS and crystal structure analysis
Synchrotron X-ray radiation provides high energy photon fluxes, thus allowing very short acquisition times and X-ray diffraction experiments can be performed under almost real time conditions. In Figure 10, time-resolved WAXS diffractograms for the isothermal crystallization at Tc = 110°C for PLA and the PLA-CNT fiber composite are plotted as a function of time. Initially (lower diffractograms), only a broad peak, ascribed to the polymer amorphous component, is observed, in top of which the main (200)/(110) crystal reflection appeared in both cases at higher times (at a scattering vector q values of 13.25/nm, Bragg's spacing of 0.47 nm). The location and width of these diffractions are rather similar for the two cases, as observed in the lower plots of Figure 10.
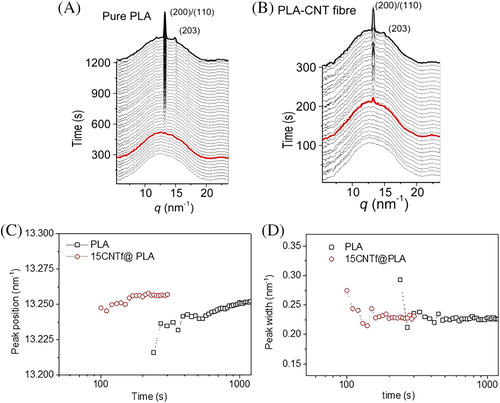
These diffractograms are characteristic of the α phase of PLA. A thermodynamically melt-crystallization favored crystal form consisting of two left-handed 107 helices packed in an orthorhombic unit cell.43 Besides, the fact that the peak positions did not change in both samples and the peak intensity of the reflections is growing with time suggests that a well-defined stable α phase of PLA was developed on the CNT fiber surface under isothermal conditions at 110°C. However, the nucleation effect is clearly observed, since the first appearance of (200)/(110) diffraction peak in the composite sample occurs at a relatively short crystallization time (onset time above which main diffractions are detectable by WAXS, marked in red in Figure 10). For instance, the first detectable peak of the (200)/(110) reflection appears at >300 s for neat PLA sample vs ∼120 s for the PLA-CNT.
Figure 11 shows some representative 2D profiles. In Figure 11C, diffraction peaks with an intense (200)/(110) refection at 2θ = 16.7° (q = 11.8/nm), (203) plane at 2θ = 19.1°, and (010) plane at 2θ = 14.9° suggest the existence of the most stable α phase of PLA crystals.43 No shifts in the main diffraction peak position can be found when comparing the radial integration plots of PLA and 15CNTf@PLA, suggesting that the thermodynamically stable α phase of PLA crystal is predominant in both samples.
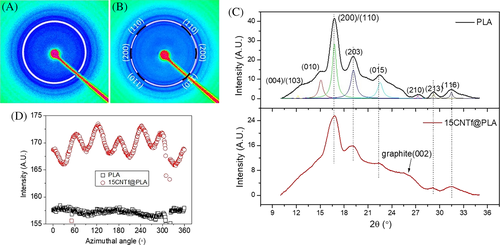
Interestingly, if we only focus on its primary (200)/(110) refection, a nearly hexagonal packing of PLA in the presence of CNT fiber can be easily discerned, showing six arcs (Figure 11B) in accordance with the six peaks in the azimuthal scan (Figure 11D). This split of the diffraction (200)/(110) is ascribed to the presence of oriented TC layer in 15CNTf@PLA. Previously, we found that the PLA crystals formed on CNT fiber surface tend to be oriented parallel to the fiber axis.29 Briefly, polymer crystals adjacent to CNTs nucleate in a way that c-axis in the unit cell is preferentially oriented parallel to the fiber axis. Furthermore, long spacing lamellae are packed parallel in this direction (along the fiber) too. As consequences, a TC layer near the fiber with orientated crystal structure is generated, in contrast to the packing mode of isotropic bulk polymer lamellae. Similar oriented crystallization phenomenon was reported for poly(vinyl alcohol) in contact with single walled CNTs.44
These results show that polymer chain alignment induced by the CNTs in the fiber occurs upon crystallization from polymer solution casting. In previous studies, it was speculated that the flow of polymer melt through elongated pores could induce alignment of the polymer chains29; however, this new evidence suggests that the elongated CNT bundles induce such alignment in the absence of shear stresses caused during flow in the porous system. Then, polymer chain alignment is induced by adsorption, in concordance to the soft-epitaxy model for crystallization from low polymer concentration solution.45
4 CONCLUSION
In this work, PLA-CNT fiber composites with the fiber loading ranging from 3.5 wt% to as high as 53 wt% were prepared by a simple method of fiber immersion in polymer solution and subsequent drying treatment. With the incorporation of the nanofibers, thermal stability of the polymer matrix increased dramatically, for example, PLA degradation temperature rose by 40°C when introducing small amount of the fiber (3.5 wt%). The microscopic morphology of the composite sample surface and cross-section was investigated, displaying well-impregnated CNT fiber/PLA interfaces at least for 15CNTf@PLA. Isothermal crystallization process was monitored by POM, and we observed that the oriented transcrystallinity layer near the fiber appeared earlier than the bulk spherulites isolated of the fiber, indicating that the fiber functioned as a nucleation agent. However, the crystal growth rate of those spherulites is irrespective of the type of nucleation.
DSC cooling/melting experiments showed that a slightly higher crystallinity was obtained for the composite with lower polymer concentration. In the isothermal crystallization process, DSC kinetic analysis showed that the time taken to complete 50% of relative crystallinity was much smaller for the composite than that for the pure polymer at all isothermal temperatures. Avrami analysis confirmed this faster nucleation, showing that the crystallization rate constant values increased significantly as the amount of CNT fiber increased. In addition, synchrotron time-resolved WAXS revealed that like for pure PLA polymer, a thermodynamically stable α phase of PLA was predominantly developed on the CNT fiber surface under isothermal condition at 110°C. The faster nucleation effect was also evident by observing that the first appearance of PLA (200)/(110) diffraction peak in the composite occurs at a much shorter crystallization time compared with that found in pure PLA. Furthermore, a hexagonal packing of PLA in the presence of CNT fiber found in the 2D-WAXD profiles suggests the split of the PLA diffraction plane (200)/(110), which is ascribed to the presence of TC layer in the composite. PLA crystals near CNT fibers and long spacing lamellae are preferentially orientated and packed parallel to the fiber axis.
ACKNOWLEDGMENTS
We acknowledge financial support from National Natural Science Foundation of China (21706039), Natural Science Foundation of Guangdong Province (2017A030310300). J.J.V. is grateful for generous financial support provided by the European Union Seventh Framework Program under grant agreement 678565 (ERC-STEM) and by the MINECO (RyC-2014-15115). J.P.F-B wants to thank the support of COST action 15107. Real-time X-ray diffraction experiments were carried out at Beamline BL11-NCD in ALBA Synchrotron Light Facility, with the support of ALBA staff.


