On the predictive capabilities of non-local models for ductile crack propagation under different levels of stress triaxiality
Abstract
Ductile materials are used in many applications such as hydrogen storage and transport, energy plants and additively manufactured components. High safety standards are vital for such applications, which underline the necessity of thoroughly investigating ductile failure to ensure safety and increase components efficiency. Ductile failure is mainly prompted by the evolution of the so-called ductile damage, characterized by the nucleation, growth and coalescence of microvoids due to plastic deformation. Moreover, the plastic zones formed at the crack tip of ductile materials exhibit high sensitivity to the stress triaxiality level, which in turn distinctly depends on the geometry of the considered component. The quantification of the stress triaxiality at the crack tip is therefore essential to better understand and predict ductile crack propagation and failure. For that reason, a non-local ductile damage model is employed in this work to simulate the ductile crack propagation under different stress triaxiality conditions. Different geometries are considered, such as constrained geometries of notched bending specimens and unconstrained geometries of center cracked tension specimens, which characterize the different triaxiality levels. To address the effects of thickness and initial crack length, three-dimensional geometries are simulated, which account for the out-of-plane crack-tip constraints. Finally, to evaluate the prediction quality of the simulations, corresponding experiments have been carried out and direct comparisons are conducted, with respect to the crack length, ductile crack propagation and resistance curves.
1 INTRODUCTION
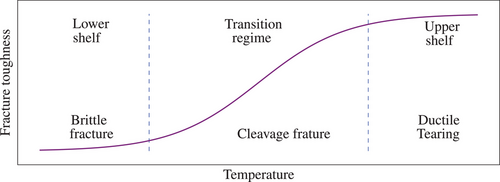
Ensuring structural integrity and safety of engineering components, while keeping the efficiency at top levels, has always been a high priority in the design process. For most metallic materials, one can distinguish between different failure behaviors depending on the material state and operation temperature. Three main different regimes can be identified as can be seen schematically in Figure 1. At low temperatures, or in the lower shelf regime, brittle fracture without considerable plastic deformation is prominent. With increasing temperature a ductile-to-brittle transition regime is observed, whereby failure occurs by cleavage, preceded by some plastic deformation leading to crack blunting and small crack extension. At high temperatures, ductile failure, also referred to as upper shelf regime, is observed. Ductile failure is mostly caused by ductile damage, which is characterized by the nucleation, growth and coalescence of microvoids due to plastic deformation, where prior to failure a considerable amount of crack extension is observed. For all different failure behaviors, the so-called fracture toughness is used to describe the material resistance against crack initiation and propagation.

In the transition regime as well as in the upper shelf regime, the fracture toughness is well known to be strongly dependent on the stress triaxiality state at the crack tip [1-3] (as schematically illustrated in Figure 2). In the transition regime, this dependency, also referred to as constraint effect, has been extensively studied and is already accounted for in component design according to guidelines given by [4], wherein, depending on the plasticity level, the fracture toughness of a cracked component can be scaled w.r.t. the fracture toughness of standard specimens with a high level of constraint (C(T) or deep cracked SE(B)) by means of constraint parameters. In the upper shelf regime, the fracture toughness is characterized by means of the crack resistance (J-R) curve, which can be experimentally determined according to the ASTM E1820 guidelines [5] for specimens with high constraint level. Furthermore, experimental investigations showed, that in the upper shelf regime, not only the fracture toughness is constraint dependent, but also the slope of the (J-R) curves depends on the geometry of the specimen. Some correlations have been established between the (J-R) curves and constraint parameters, however, no generalized correlations have been derived, since only a limited number of standard crack geometries and materials were considered. In order to derive a generalized and robust correlation between the (J-R) curves and constraint parameters, extensive studies on different specimen geometries (standard and non-standard), and a wide range of materials should be carried out. Only then, the fracture toughness properties determined on standard specimens can be transferred to cracked components considering specific crack geometries and loading conditions.

Extensive experimental studies are however not possible on their own due to limited resources and high required costs. For those reasons, finite-element simulations can be used to support material testing. But in order for the FE simulations to be regarded as an enhancement to the experimental investigations and help to derive correlations between the fracture toughness and constraint parameters, a robust and efficient model has to be employed. The modeling of ductile damage and failure has seen substantial interest and numerous modeling attempts were made to realistically predict and simulate ductile failure, among those approaches, the micromechanically-based model of Gurson [6] with its extension of Tvergaard and Needleman [7], famously known as the GTN model, has since been characterized as the gold standard to simulate and predict ductile damage and failure. It also exhibits a favorable property characterized by the intrinsic influence of constraint, mainly the stress triaxiality on damage evolution. The aim of this work is therefore to employ the GTN model to simulate the ductile crack propagation under different stress triaxiality conditions and to evaluate its prediction quality by means of direct comparison to corresponding experimental data. Moreover, the quantification of the stress triaxiality at the crack tip and its correlation to the fracture toughness is investigated. After this brief introduction, a short description of the employed GTN model and its numerical implementation are presented. In the following section, the results of the FE-simulations are then shown and compared to their experimental counterparts. Finally, the work is summarized and concluded.
2 NON-LOCAL GTN MODEL
2.1 Model description
 as follows:
 (1)
(1) ,
,  , are the current yield stress of the matrix material, the hydrostatic stress and the Mises equivalent stress, respectively. q1 and q2 correspond to the empirical model parameters of Tvergaard and Needleman and
  is the plastic multiplier. The characteristic stress measures are defined as:
 (2)
(2) and plastic
  parts, so that:
 (3)
(3) corresponds to the Jaumann-rate of the Cauchy-stress tensor σ and
  is the fourth order tensor of isotropic elasticity. The evolution of the void volume fraction as a mechanism of softening is driven by the growth of voids
  , and by void nucleation
  :
:

 (4)
(4) (5)
(5) and the two variables are related by a Helmholtz type partial differential equation:
 (6)
(6) is the Laplacian operator and
  is an additional parameter, which can be interpreted as an internal length that controls the width of the damage process zone. Moreover, the mechanism of void coalescence is modeled by a modified accelerated void evolution formulation, where the effective porosity
  evolves faster than the actual porosity f, when a critical value
  is attained. More details about the employed model can be found in [9, 10].
2.2 Finite element implementation
For the finite element implementation, the similarity between the steady-state heat equation and the Helmholtz-type differential equation for the non-local variable is utilized. Accordingly, an analogy between the temperature degree of freedom and the non-local variable  is drawn, and the difference
  is interpreted as the internal heat source. Finally, the thermal conductivity is interpreted as the internal length squared
  . Taking advantage of this similarity makes it possible to use the Abaqus user-defined material (UMAT) subroutine instead of the user-defined element (UEL) subroutine [11], which requires additional efforts in terms of implementation, contact formulations and post-processing. The non-local GTN model is therefore implemented as a UMAT subroutine in Abaqus/standard adopting a monolithic scheme and the constitutive equations are integrated by means of an Euler-backward implicit scheme in radial return mapping algorithm framework including an operator split. Additional details about the finite element implementation of the employed non-local GTN model can be found in [9, 10].
3 RESULTS
3.1 Test matrix
In order to evaluate the qualitative prediction of the non-local GTN model for the ductile crack growth under different levels of stress triaxiality, different fracture mechanics specimens are considered. The specimen dimensions are given in Table 1, as well as the corresponding initial crack length. All specimens with through cracks, namely C(T), SE(B), SE(T), and M(T) were side grooved by a depth of 10% of the specimen thickness. For a direct and accurate comparison the same experimental conditions, that is, specimen dimensions, operating temperature, and evaluation procedures, adopted in [12] are replicated here for the finite element simulations with the non-local GTN model. On the first hand, the C(T) and deep cracked SE(B)-specimens are evaluated following the compliance method according to the ASTM E1820 guidelines, both, the experiments as well as respective simulations. On the other hand, all other specimens are tested following the basic method, (details regarding the two different evaluation approaches can be found in [12]).
| Specimen type | Specimen dimensions in mm | Crack length a0 in mm | |
|---|---|---|---|
| Thickness | Length W | ||
| Compact Tension C(T) | 25 | 50 | 29 |
| Single Edge Bending SE(B) - Deep | 10 | 20 | 10 |
| Single Edge Bending SE(B) - Short | 10 | 20 | 2 |
| Single Edge Tension SE(T) | 10 | 40 | 20 |
| Middle crack Tension M(T) | 10 | 40 | 20 |
| Corner Crack Tension CC(T) | 15 | 15 | 6 |
3.2 Non-local GTN model parameters
Furthermore, the parameters of the non-local GTN model for the rotor steel investigated in this work were identified using the approach proposed in [13], whereby, the parameters are identified in an iterative-free procedure based on the experimental data of a uniaxial tensile test and a high-constraint fracture mechanics test, for example, C(T)-specimen according to ASTM E1820. The determined parameter set of the tested material is given in Table 2 with the tensile properties.
| E [GPa] | Rp0.2 [MPa] | Rm [MPa] | f0 |  |
 [mm] [mm] |
fn | εn | sn | q1 | q2 | κ |
|---|---|---|---|---|---|---|---|---|---|---|---|
| 206.0 | 1000.0 | 1088.0 | 0.002 | 0.1 | 0.015 | 0.008 | 0.3 | 0.1 | 1.5 | 1.0 | 4 |
3.3 Damage mechanics analysis
For the verification of the identified parameter set, the C(T)-specimen, which experimental data are used for the identification procedure, is simulated with the non-local GTN model first. The same specimen dimensions and initial crack length a0 of the experimental test are selected. The same evaluation approach for the J-R-curve is used as well, here according to the ASTM E1280 guidelines for the C(T)-specimen. The crack extension  is evaluated by
  , where
  is measured as the relative displacement along the crack ligament describing the blunting of the crack tip, and the
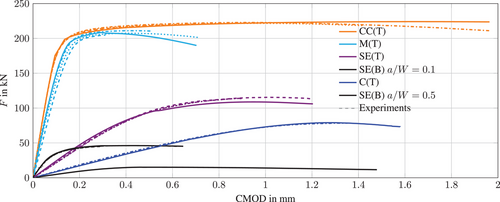
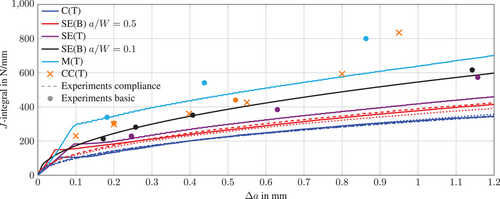
  corresponds to the crack extension due to material failure. Figures 3 and 4, show that the force-crack mouth opening displacement (F-CMOD) and J-R-curve of the C(T)-specimen obtained from the non-local GTN simulations (blue solid lines) display a nearly perfect agreement with the experimental results (blue dashed line), which is expected since the C(T)-specimen has been used for the identification of the non-local GTN parameters.


Using the identified parameter set (Table 2), the non-local GTN model is, therefore, further employed to simulate and predict the behavior of the other specimen geometries (see Table 1). Figure 3 shows the comparison between the predicted F-CMOD curves of the different specimens and their respective experimental results. It can be seen that a good match between the simulation and experimental results is obtained w.r.t. the F-CMOD curves. On the other hand, Figure 4 compares the predicted J-R-curves with their experimental results. A good agreement between the predicted and experimentally determined fracture toughness is obtained, especially when considering the ductile crack initiation, that is, J0.2. Moreover, a qualitatively correct prediction of the slope of the J-R-curves is obtained, however, the non-local GTN model underestimates quantitatively the slopes of the experimental curves, thus resulting in conservative behavior of resistance against the ductile crack propagation. Furthermore, Figure 4 illustrates the strong dependency of the J-R-curves and the fracture toughness at crack initiation J0.2 on the crack-tip constraint. As expected, the C(T)-specimen, which exhibits the highest constraint level yielded the lowest crack initiation value, whereas the M(T)-specimen with the lowest constraint level of all simulated specimens, resulted in the highest initiation value.
The fracture toughness dependency on the constraint can be further investigated by taking a closer look at the stress state at the crack-tip. In this work, the stress triaxiality ratio h is considered as the constraint parameter of the elastic-plastic stress field at the crack-front. The stress triaxiality is defined by the ratio  , which describes the relationship between the hydrostatic stress σh and the equivalent von Mises stress
  . In Figure 5, the distributions of the stress triaxiality along the thickness of different specimen geometries are plotted along with the corresponding contour plots of these distributions along the crack ligament. The triaxiality values shown in Figure 5 are evaluated at the point when the J-integral reaches J0.2 of the corresponding specimen and at a normalized distance
  from the crack front (due to symmetry, the distribution is plotted only along half of the thickness).

 corresponds to the specimen center, with Bn is the specimen net thickness i.e., considering the side-grooves).
It is clear that each specimen exhibits a considerably different stress state at the crack-front, manifested by the different variations of the stress triaxiality state along the thickness of the specimens, as well as the values of h. Once again, as expected the triaxiality ratio h evaluated for the C(T)-specimen yielded the highest values illustrating the high-constraint level of such specimen, whereas on the other hand the M(T)-specimen, which is normally designated as the lowest constraint specimen, gives the lowest values of h. This quantification of the constraint shows, that the employed non-local GTN model is capable of reasonably predicting the crack-tip constraint and their effects on the ductile crack resistance, which were qualitatively as well as quantitatively demonstrated in the prediction of the J-R-curves as shown in Figure 4 and the corresponding discussion. Additionally, from Figures 4 and 5, a distinct correlation between the fracture toughness and the triaxiality ratio h can be deduced, which could be used in the future to relate the fracture toughness of standards specimens, such as the C(T)-specimen, to cracked components.
4 CONCLUSION
In this work, the non-local GTN damage model was employed to investigate its predictive capabilities for ductile crack propagation under different levels of constraint. For that purpose, damage mechanics simulations on specimens with different geometries each exhibiting different level of stress triaxiality, were carried out. The crack resistance curves J-R-curves were evaluated for each specimen and directly compared with experimental results. The numerical results showed, that the used non-local GTN model, is able to predict qualitatively as well as quantitatively the constraint effects on the fracture toughness, either w.r.t. the crack initiation values or the slopes of the J-R-curves. The constraint parameters were further quantified by evaluating the stress triaxiality ratio of each specimen from the damage simulations, which demonstrated a distinct correlation between the triaxiality ratio and the fracture toughness. Such correlations can thus be used to transfer the fracture toughness properties determined on standard specimens, for example, C(T), to specific cracked components. Therefore, the non-local GTN model will be further utilized to generate direct correlations, for example by means of look-up diagrams, relating the constraint parameters and crack initiation parameters of different specimen geometries with different constraint levels for a wide range of materials. A robust concept can thus be derived, which allows the constraint effects to be considered in the design of cracked components in the upper shelf regime with specific crack geometries, loading and constraint conditions.
ACKNOWLEDGMENTS
Open access funding enabled and organized by Projekt DEAL.


