High-resolution numerical simulations of polymer injection molding: Analysis of mesh size and refinement
Abstract
Accurate and high-resolution numerical simulations are crucial for preventing manufacturing defects during polymer injection molding. However, achieving efficient and precise simulations in this field remains a subject of ongoing research. In this study, we develop a macro-scale numerical model to describe the behavior of melted polymer during the filling phase. Employing our in-house finite-element solver, XNS, we simulate the polymer and air flows as a two-phase flow using the level-set method. This formulation involves significant discontinuities across the interface, therefore a high mesh resolution along the interface becomes necessary. Furthermore, to accurately capture the polymer behavior along the wall, we apply a variable Navier slip condition that is dependent on the mesh size. To assess the impact of mesh size on the solution, we compare the results obtained with different levels of mesh refinement. Additionally, we investigate the effects of localized mesh refinement at the wall boundary and conclude that refinement in the interior of the channel is also required. Through our analysis, we highlight the importance of high-resolution meshing and appropriate wall boundary conditions in achieving accurate simulations of polymer injection molding. This research contributes to the ongoing efforts in improving the understanding of the complex phenomena involved in this manufacturing process.
1 INTRODUCTION
The motivation behind our research project is to address the need for high-resolution simulations in the field of injection molding. In the present industrial landscape, the reliance on traditional methods for injection molding simulations has proven insufficient for high-resolution applications. These methods often utilize simplified physical models, which often compromise the accuracy of results. Our primary objective is to improve the accuracy of simulations while maintaining computational efficiency. By achieving this goal, we aim to enhance mold design quality, reduce production cost by reduced amount of low-quality parts, and advance the overall understanding of the injection molding process.
The injection molding process can be divided into three main phases: cavity filling, packing, and cooling. In our study, we specifically focus on cavity filling, where the melted polymer is injected into the cavity initially filled with air. In this phase, the polymer is considered a viscous fluid, even solidification already starts when the polymer contacts the cool, temperature-controlled mold walls. This phase is of particular significance as it not only sets the initial configuration for the subsequent packing phase but also can directly influence the final product's properties, influenced by the crystallization structure and distribution, and the potential for air entrapment.
In this work, we focus on the study of mesh sizes and refinement. For a 2D geometry resembling a typical injection molding cavity channel, we analyze the solution behavior utilizing different mesh refinements. We study the effects on the polymer front advance, velocity, temperature, and viscosity. These results bring us a better understanding of the process and serve as a first step to developing convenient techniques to efficiently reduce the problem's complexity without compromising accuracy.
2 GOVERNING EQUATIONS AND SOLUTION TECHNIQUE
The governing equations of the cavity filling problem are the Navier-Stokes equations coupled with the heat equation. We use a two-phase flow formulation, considering both the air and the polymer, and to capture the material's interface we employ the level-set method [1]. To extend the model for semi-crystalline polymers, a crystallization transport equation is coupled to the system, accounting for the polymer crystallization.
The computational domain that we consider, , encloses the air and polymer subdomains, where . The interface between these phases is defined as and the boundary of the entire domain is defined as .
Here represents the isobaric heat capacity, k thermal conductivity, Φ viscous heat dissipation, and Ξ crystallization heat source. For this study, following the conclusions in [2], the contributions of both viscous stresses and crystallization are neglected.
The constant material properties in Equations (1)–(4) for both the polymer and the air phase are given in Table 1. The viscosity of the polymer is defined following the Cross-Williams-Landel-Ferry (Cross-WLF) model [8] with the formulation in [9] and the parameters in Table 2.
| Constant | Polymer | Air | Units |
|---|---|---|---|
| ρ | 784 | 0.8 | kg/m3 |
| Cross-WLF | kg/(m s) | ||
| k | 0.22 | 0.025 | W/(K m) |
| 2667 | 1000 | J/(kg K) |
| Parameter | Value | Units |
|---|---|---|
| 25,000 | Pa | |
| A1 | 31.01 | − |
| A2 | 51.60 | K |
| D1 | 2.64 · 1019 | Pa s |
| D2 | 231 | K |
| D3 | 0 | K/Pa |
| n | 0.34 | − |
To solve the system, we use a finite-element solver developed in-house at the Chair for Computational Analysis of Technical Systems. Equations (1)–(6) are discretized using P1P1 finite elements with the Galerkin/Least-Squares (GLS) stabilization [10] and a space-time discretization [11].
3 BOUNDARY CONDITIONS ON THE WALL
Boundary conditions on the wall play a crucial role in the cavity filling problem with melted polymers. With the two-phase flow model, we can prescribe different conditions for the air and the polymer phase. In the case of the air phase, to simplify the problem, and because it does not influence the polymer behavior, we can apply a slip condition at the walls. However, for the polymer phase, a no-slip condition is typically imposed to ensure an accurate representation of the physics. Nonetheless, enforcing a no-slip condition for the polymer phase in our formulation restricts the movement of the polymer-air interface. To avoid this phenomenon and allow the interface to move, we impose a slip condition around the interface, maintaining a no-slip like condition for the rest of the polymer domain. This is a generally accepted approach in the literature [9, 12, 13].
The β coefficient upstream of the front flow, , should be a sufficiently high value to restrict completely the fluid movement, for this work it is set to 1 · 107. The limits for the slip transition are determined by the signed distance function ϕ restricted by the slip length α determined by the element length h, ensuring always a slip condition at the interface, , and a smooth transition to no-slip behavior, .
Notably, this approach is dependent on the mesh size: the smaller the elements at the interface, the shorter the—non-physical—slip length at the polymer interface, and the closer to reality is the model. This effect is analyzed in the results section.3
The conductivity coefficient k is set to 700 W/(m2 K) and the ambient temperature to 303 K. For both the air and the polymer phase, we use the same parameters.
4 GEOMETRY AND MESHES
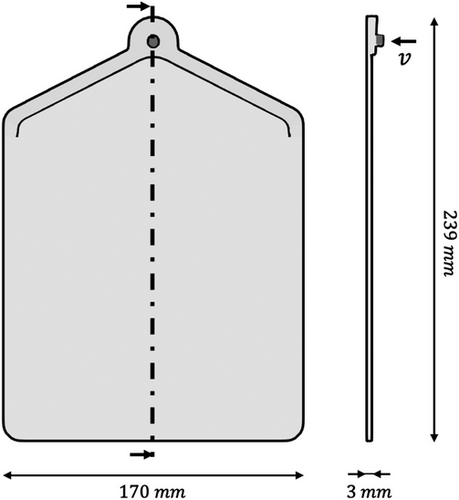
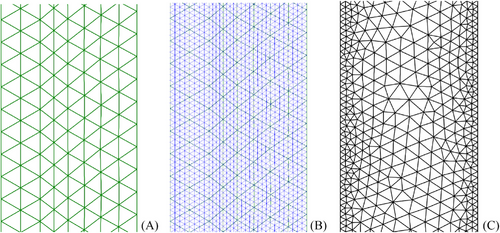
Previously, using a very fine mesh, we simulated a 2D geometry and obtained results comparable to experimental results. From these results, we have now investigated qualitatively the effect of the mesh size on the results obtained. The geometry used corresponds to the mid-slice of the plate-shaped geometry used for experimental testing at the Institute for Plastics Processing - Institut für Kunststoff Verarbeitung (IKV), Figure 1. For this study, five different meshes have been used. Starting from a uniform unstructured Very coarse mesh and refining by partition, every mesh has four times more elements than the previous, four meshes have been generated. Finally, to study the effect of non-uniformity, a wall-refined mesh, , has been tested. The refined mesh combines elements sizes from the Coarse mesh, at the center of the channel, and from the Very fine mesh, near the channel walls, see Figure 2. The main features of the meshes are shown in Table 3.
| Very coarse | Coarse | Fine | Very fine | Refined | |
|---|---|---|---|---|---|
| Number of elements | 1161 | 4644 | 18576 | 74304 | 19019 |
| Number of nodes | 1434 | 5188 | 19662 | 76474 | 20956 |
| Element size in y (mm) | 1.00 | 0.50 | 0.25 | 0.125 | 0.125–0.5 |
| Element size in x (mm) | 0.78 | 0.38 | 0.19 | 0.10 | 0.1–0.38 |
5 RESULTS
In this section, we present the results of the same problem solved with the different meshes presented. At the initial time of our 2D problem, the polymer phase Ω2 is already filling the top of the geometry, and the rest is filled with air Ω1. The two-phase flow interface is located at the entry of the cavity, at mm upstream of the outlet. During the simulation, the melted polymer enters the domain through the top right gate at a constant velocity of 52 mm/s and the air phase leaves the domain through the end of the channel, where a traction-free velocity boundary is prescribed.
The initial temperature field is 513 K in the polymer phase and 303 K in the rest of the domain. At the inlet, the temperature remains 513 K. Crystallization is initially .
After 1 second of injection, the velocity and temperature profiles at the beginning of the channel are already steady and we can observe noticeable differences within the solutions. The computational times, as well as the final polymer's filled distance along the channel, are quantified in Table 4. The absolute and relative difference in the polymer's final position is also computed, taking the results from the Very fine mesh as the reference value.
| Very coarse | Coarse | Fine | Very fine | Refined | |
|---|---|---|---|---|---|
| Time (s) | 591 | 1683 | 4772 | 24534 | 3610 |
| Timesteps/hour | 2436 | 855 | 301 | 58 | 398 |
| Cores | 12 | 12 | 48 | 48 | 48 |
| Total filled distance (mm) | 85.8 | 95.2 | 100.0 | 102.0 | 98.0 |
| Absolute difference (mm) | 16.3 | 6.8 | 2.0 | 0 | 4.0 |
| Relative difference (%) | 16.0 | 6.7 | 2.0 | 0 | 3.9 |
For a qualitative analysis of the results, the polymer flow front is plotted in Figure 3. Here we can observe how both the flow advancement and the interface profile vary with the mesh size, as expected. For a deeper understanding, we analyze the velocity and temperature profiles in Figure 3.
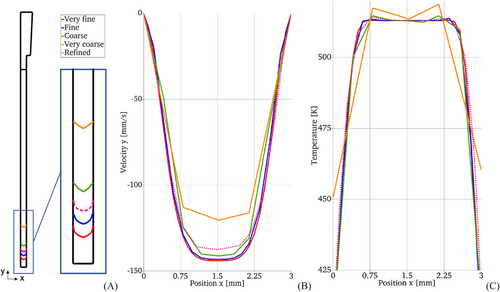
Examining the velocity profiles, we observe that the Coarse and Very coarse mesh resolutions fail to accurately represent the velocity profile, leading to an underestimation of the flow advance over time. While the velocity profile appears similar for both Fine and Very fine meshes, the slight variation propagates in time and leads to different flow advancements. In terms of temperature, we find that a lower mesh resolution, Coarse, can be sufficient to detect the expected temperature changes near the cavity walls.
Considering the possibility that the differences in the flow advancement may arise from the mesh-dependent wall boundary conditions and the flow resolution near the walls, we have tested a refined mesh at the walls. By combining a coarse mesh in the middle of the channel with very fine mesh elements near the walls, a new mesh configuration is created. This mesh has a similar number of nodes as the Fine mesh, but the total computational time of the simulation is reduced.
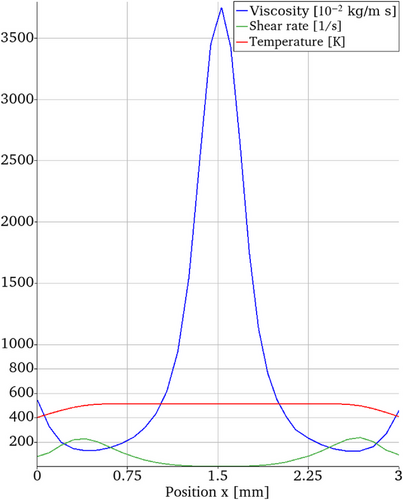
The results show that while the interface profile resembles that of the very fine mesh, the flow advancement is significantly degraded, resembling more the behavior observed with the coarse mesh. This outcome is also evident in the velocity profile, where the velocity in the center of the channel is under-predicted, indicating that our geometry, a thin channel, does not permit mesh coarsening in the center. To validate this observation, the viscosity profile is examined in Figure 4. It is observed that the viscosity undergoes noticeable changes along the channel width coinciding with the shear rates changes. In the x direction, fine discretization is crucial due to the wide boundary layers caused by the narrow channel and shear-thinning behavior of the polymer.
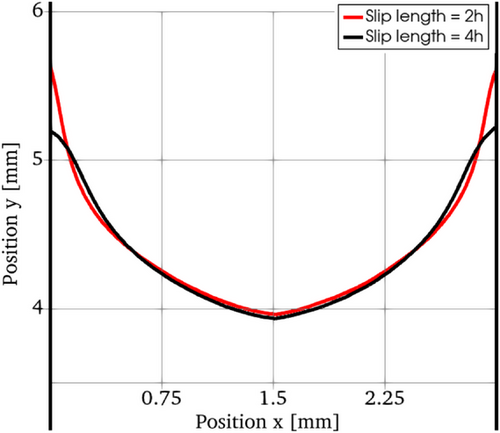
To observe the direct effect of the slip length α of the wall boundary conditions, a simulation with the Very fine mesh and with has been compared with the original simulation with . The flow front of both simulations after 1s is plotted in Figure 5. From this picture it is clear that widening the slip area did not affect the advancement of the polymer through the channel, it just affected the solution near the wall, changing slightly the interface profile in that area.
6 OUTLOOK
In this paper, the effect of mesh refinement for a typical injection molding simulation in a thin channel has been analyzed. We have observed that the mesh-dependent wall boundary condition proposed is a convenient approach, that does not seem to influence the accuracy of the flow front advancement. According to our findings, the polymer advancement seems to be strongly influenced by the viscosity profile, highly dependent on the shear rate. To resolve the viscosity profile and obtain accurate results on the filling pace, a fine mesh at the center of the channel is required. The local refinement at the walls noticeably improves the polymer-air interface profile, but not the flow pace.
Future research includes utilizing these findings to reduce the computational costs of the problem without strongly compromising the accuracy of the results. Additionally, the simulation of the 3D geometry is planned, as well as the comparison of the results with the 2D simulation, to study the 3D effects.
ACKNOWLEDGMENTS
The authors gratefully acknowledge the support of the German Research Foundation (DFG) under program SFB 1120 “Precision Melt Engineering” - 236616214. Calculations for this research were conducted on the Lichtenberg high-performance computer of the TU Darmstadt.
Open access funding enabled and organized by Projekt DEAL.


