Detecting local spots in network materials prone to mechanical failure
Abstract
The prediction of the onset of fracture is a challenging issue in the mechanics of disordered materials. In this contribution, we show that the fracture process in network glasses, such as silica glass, turns out to be a complex phenomenon that originates from specific spots that have the size of a few hundred atoms only. We apply pure shear deformation to identify local rearrangement spots prone to material damage. These spots are analyzed using stress drop steps, originally used for densely packed disordered systems.
1 INTRODUCTION
Due to its exceptional properties, silica glass is highly valued in many industries and research. It can withstand extreme temperatures, allows light to pass through, is very resistant to chemicals, and has good electrical properties. These exceptional properties make silica glass highly versatile for various applications [1]. Unfortunately, on the macroscale, silica glass type breaks in a very brittle and somewhat unpredictable manner without any noteworthy foregoing plastic deformation, which limits the structural application of such materials. However, silica glass plastifies on the nanoscale and shows unusual behavior under shear and pressure [2]. Thus, extensive studies have been conducted to understand the dynamics of fracture in such a network-type of glass. These studies have employed both molecular simulations to understand the behavior of silica materials at the atomic level [3] and compare the simulation results with the experimental data [4].
Bamer et al. [5] used two-dimensional silica structures for the presentation of the main mechanical phenomena using molecular simulations due to several advantages. First, exploring a purely two-dimensional model offers a notable advantage in terms of visual representation, which enables enhanced classification and comprehension of intricate mechanical phenomena. Moreover, reducing one dimension results in computationally more economical models compared to three-dimensional counterparts of similar scales. Third, while dealing with such a theoretical model, it is less important for the model to be quantitatively accurate in terms of quantitative results while still providing a strong link to experimental images [6].
The main motivation of our study is to provide one step further to the understanding of an underlying molecular phenomenon behind the fracture of such two-dimensional silica structures. In this context, it has already been shown on densely packed systems, that is, models that describe the underlying physics of metallic glasses, that the material response originates from local rearrangements that involve a region of a few hundred atoms only and leads to an elastic response in the surrounding matrix [7, 8]. These small regions are predefined in the material prior to any deformation and may be activated during loading. One big issue in the community is to detect such “soft spots” prior to any mechanical deformation and preferably from the geometrical picture of the material only. In this context, Patinet et al. developed a model to detect this local rearrangement in amorphous solids by direct local probing of shear stress thresholds during remote loading in shear [9]. Furthermore, Bamer et al. [10] have investigated the reversibility of the local rearrangement and classified the reversibility using polynomial regression.
In this paper, we create a database of two-dimensional network glass samples and subject them to pure shear athermal quasistatic (AQS) deformation. This study focuses on detecting local rearrangements within the structures, which are as considered regions susceptible to future breakage. In order to identify and represent the size of the local rearrangements, we study the non-affine displacement fields of the structure under mechanical loading.
2 THEORY
2.1 Generating silica structure
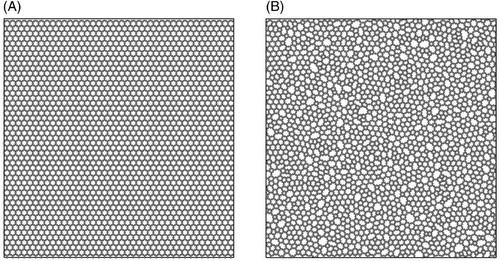
By following this procedure, artificial two-dimensional glass models that follow Zachariasen's framework were successfully generated using the Monte Carlo bond-switching algorithm.
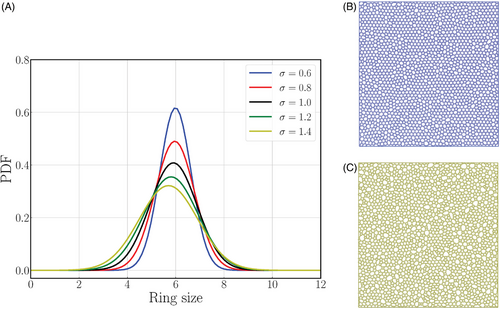
3 SIMULATION AND RESULTS
3.1 Pure shear deformation
Regarding shear deformation, simple shear and pure shear are considered. Noteworthy, the deformation gradient of simple shear is determined by combining the effects of pure shear deformation and rotation. This leads to a measurable stress response in the material and the contribution of rigid body motion [5].
In molecular simulations, a pure shear deformation protocol along the x and y directions can be easily implemented by subjecting the material to push-pull combined deformation and maintaining a constant cell volume. This approach proves convenient in molecular simulations.
Instead of using a time integration scheme, we employ an AQS deformation protocol. This approach involves increasing the strain incrementally and minimizing the potential energy without considering thermal effects. In other words, local energy basins can only be escaped through externally applied strain rather than thermal activation. This AQS protocol provides a physically meaningful description of glassy structures at temperatures significantly lower than the glass transition temperature. As a result, it enables a pure mechanical characterization of the disordered structure, free from thermal disturbances.
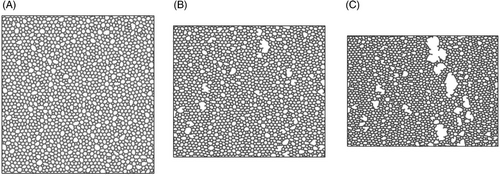
Figure 3 illustrates one of the outcomes obtained from the application of the AQS pure shear deformation on the generated lattice samples of heterogeneity , where the deformation for each step is Å. In Figure 3A, the initial state of the deformation is depicted, revealing an intact lattice structure without any damage or fracture. However, after subjecting the lattice to 200 steps of deformation, Figure 3B shows the occurrence of rearrangements within the lattice. These transformations can form irreversible large rings, which can be regarded as local fractures in the material. Continuing the deformation process, the voids depicted in Figure 3B continue to grow, as illustrated in Figure 3C. After 400 deformation steps, the voids become significantly larger and they have the potential to propagate throughout the entire lattice structure, which potentially leads to total rapture.
3.2 Detecting identified regions of local rearrangement
We aim to find regions susceptible to mechanical failure or local rearrangements that are decoded in the material prior to deformation. This approach is motivated by the shear transformation zone (STZ) theory proposed by Falk and Langer in 1998 [7]. By analyzing the behavior and properties of these identified regions, one can gain insights into the mechanisms and patterns of mechanical failure in the simulated material.
Due to the change in the potential energy landscape (PEL) caused by external deformation, there is a possibility of encountering a point where the system can drop into an adjacent basin. This transition leads to a catastrophic and discontinuous rearrangement event. In other words, the system undergoes a sudden and significant change in its configuration as a result of this drop in the PEL. The strain step introduced to the cell is kept small enough to avoid significant alterations in the mechanical response behavior of the system. However, it is large enough to promote the occurrence of a specific saddle-node bifurcation that may emerge in the PEL as the shear strain increases. In other words, we took care that possible events were not skipped during strain increase. During each elastic AQS step, the objective of the minimization algorithm is to reposition the disturbed atom back into its minimum basin.
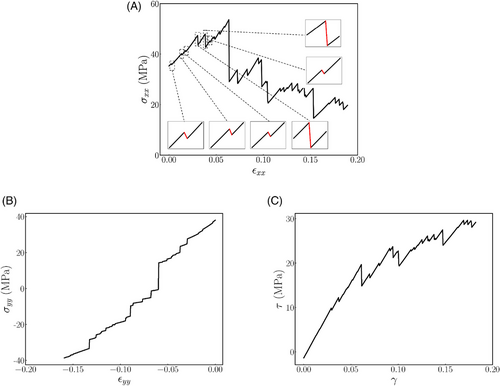
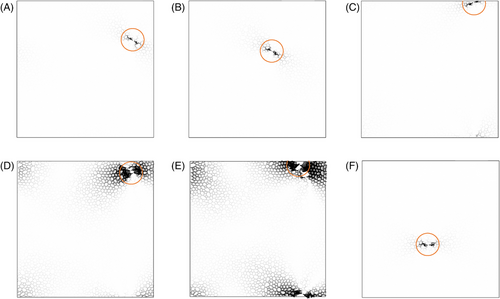
In Figure 5, we present the non-affine displacement field corresponding to the first six stress drops enlarged in Figure 4A. By examining these fields, one observes that the regions exhibiting significant non-affine displacements correspond to the damaged regions within the material. We emphasized this observation further by highlighting these regions with an orange circle. The center of each circle is chosen so that it coincides with the atom that experiences the maximum non-affine displacement. The radius of these circles may vary, allowing for flexibility in capturing the extent of the damaged region. Quantification of the size of these soft spots by finding the appropriate corresponding radii may help to better classify the extent of the damage for future studies.
4 CONCLUSION
In summary, we have constructed a database of two-dimensional silica network structures and subjected them to pure shear AQS deformation using molecular simulations. Through our analysis, we have identified and examined the occurrence of local rearrangements within the structures. These localized rearrangements can be regarded as regions susceptible to structural failure. We have identified local regions to represent these small damages, that allow for characterization and an understanding of potential failure mechanisms in the structures. Future work will aim to conduct investigations on the sizes of the identified regions of local rearrangement.
ACKNOWLEDGMENTS
This research was funded by the Federal Ministry of Education and Research (BMBF) and the Ministry of Culture and Science of North Rhine-Westphalia (MKW) under the Excellence Strategy of the Federal Government and the Länder.
Open access funding enabled and organized by Projekt DEAL.


