
Model reduction for  -induced vesicle fusion dynamics
Abstract
In this work, we adapt an established model for the  -induced fusion dynamics of synaptic vesicles and employ a lumping method to reduce its complexity. In the reduced system, sequential
  -binding steps are merged to a single releasable state, while keeping the important dependence of the reaction rates on the local
  concentration. We examine the feasibility of this model reduction for a representative stimulus train over the physiologically relevant site-channel distances. Our findings show that the approximation error is generally small and exhibits an interesting nonlinear and non-monotonic behavior where it vanishes for very low distances and is insignificant at intermediary distances. Furthermore, we give expressions for the reduced model's reaction rates and suggest that our approach may be used to directly compute effective fusion rates for assessing the validity of a fusion model, thereby circumventing expensive simulations.
1 INTRODUCTION
Neurotransmission at chemical synapses relies on the  -mediated fusion of synaptic vesicles with the presynaptic membrane. Incoming action potentials trigger the opening of voltage-gated
  -channels, and the ensuing elevation of presynaptic
  -levels provokes synaptic vesicle release via activation of vesicular
  -sensors [1-3]. Studies combining experimental and mathematical analysis demonstrated that this process could be modeled by a linear reaction network involving five sequential
  -binding steps [4]. Subsequently, it was shown that an augmentation of this network incorporating allosteric modulation of the
  -sensor provided even better results [5]. In ref. [6], the allosteric model was further extended to account for synaptic plasticity effects due to (un)priming – a presumably reversible maturation process that allows vesicles to become susceptible to
  -stimulation [7-10].
An overview of the resulting linear reaction network adapted from ref. [6] is given in Figure 1: a synaptic vesicle docks to an empty release site (P0) and is reversibly primed for release (R0). Then, a sequence of up to five  -ions can reversibly attach to the vesicle (
 ). Finally, vesicle release takes place at a rate that increases with the number of bound
  -ions. After fusion, the release site becomes immediately available again and the cumulated number of fusion events is counted in F. The system's dynamic behavior results entirely from the fact that the unpriming rate as well as the
  -binding rates depend on the time-dependent cytosolic
  -concentration
  , which increases transiently in response to applied stimulation. Notably, the
  -transient is significantly determined by the distance of the release site to the voltage-gated
  -channel.

 . Successive binding of up to five
  -ions by the reactions
  increases fusion probability. Cumulative fusions are counted in F, and upon fusion, release sites become immediately available for vesicle docking by returning to P0.
In studying neurotransmission, the need for extensions of the model shown in Figure 1 may arise, for example, for the investigation of unexplained synaptic plasticity effects (as was the case previously with the unpriming mechanism) or for the analysis of other known synaptic processes such as vesicle trafficking or recycling [11]. However, increasingly complex systems also become more computationally expensive to simulate and suffer from higher-dimensional parameter spaces in optimization. Furthermore, there may be details of minor interest that unnecessarily take up computational resources when modeling processes on larger scales. This motivates to investigate the possibility of reducing the model in Figure 1, specifically the feasibility of merging the five  -binding releasable steps
  into just one release state
  , as depicted in Figure 2. A good reduction should (a) not lead to a significant loss of information in the model output and (b) preserve
  -dependency, such that further
  -dependent effects as well as model responses to arbitrary stimuli may be explored using the reduced model.

 of the full model depicted in Figure
  . Both
  and
and  are weighted averages of the unpriming and fusion rates from the full model, see Equation (
A promising reduction approach in this regard is based on lumping of states and was introduced by Sunnåker et al. [12]. It relies on the assumption that the merged subsystem is in quasi-steady-state (QSS), which requires a time-scale separation in the sense that reactions within the lump are occurring at very high rates. As several of the reaction rates in our system depend on the calcium concentration which itself depends on the spatial location and strongly changes with time, the validity of the QSS assumption will also change with these variables and a general analysis is hard to realize. Our approach is, therefore, to study the applicability of this method to the five ion-binding steps.
The full model
 is given by the vector
 (1)
(1) to define the mean number of release sites in state
  at time t. The associated system of ordinary differential equations as well as the parameter values can be found in tab. 3 and 4 of ref. [6] (unpriming model with cooperativity five). For the reaction rates, see also Figure 4A. We note that for any time t the values
  sum up to the total number
  of release sites under consideration, such that
  gives the fraction of release sites in state S.
 -concentration and fraction parameters. The left plot (A) shows the temporal evolution of
  -concentrations
  for four representative distances
  of release sites from the
  channel. Note the logarithmic scale of the vertical axis. In (B), the fraction parameters
  for the relevant range of
  -concentrations is shown, see Equation (10). Note the logarithmic scale of the horizontal axis.
 -dependency of reaction rates. Note the logarithmic scales of the axes. (A) The rates of the original model as described in ref. [6] are shown, notably only the ion binding rates (grey) and the unpriming rate (black) are
  -dependent. The fusion rates (green), the priming rate (yellow) as well as the ion unbinding rates (blue) are constant. Unpriming rate:
  where
where  is a constant,
  is a Michaelis-Menten constant and
  is the cooperativity exponent. Binding rates:
 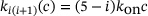 for a constant
  . Unbinding rates:
  for constants
  . Fusion rates:
  for constants
  . Priming rate:
  . (B) The blue line corresponds to the unpriming rate in the reduced model computed according to (4), while the dashed grey line shows the original unpriming rate. The lines do not cover the whole domain since the rates got too small to compute at high c. (C) The blue line represents the fusion rate in the reduced model computed as a weighted average via (4).
 of
of  with an impulse response function g [6, 13]:
 (2)
(2)2 MODEL REDUCTION
 into a single releasable state
  and thereby reduce the model structure of Figure 1 to that displayed in Figure 2 while preserving the
  -dependency of the dynamics. The components that are to be lumped will in the following be gathered in the vector x,
 (3)
(3) . Following [12], the reaction rate for a linear reaction from the lumped state to a state outside the pool can be found as a weighted average of the individual rates, with the weights given by the shares of the individual states in the lumped state. For the two resulting rates in the reduced model this means
 (4)
(4) . The fraction parameter
  describes the share of pool component i in the lumped state. As the original states
  are not explicitly known when working with the reduced model, the fraction parameters
  will be approximated as follows. In analogy to Equation (19) in ref. [12] we describe the temporal evolution of the lumped system in terms of dynamics internal to the pool and inputs to the pool,
 (5)
(5) is a tridiagonal matrix with components
 (6)
(6) is time-independent and has the form
 (7)
(7) (8)
(8) (9)
(9) (10)
(10)Note that this means  , and thereby also
  , and
, and  , so the only time-dependence in the fraction parameters and therefore also the rates in (4) results from the time-dependence of
  . Thus, the distribution over the states inside the pool when assuming QSS is only dependent on the current
  -concentration. In order to compute the fraction parameters in Equation (10), we need to compute the inverse of the tridiagonal 6 × 6 matrix A. Fortunately, Jia and Li [14] developed an algorithm for the symbolic inversion of general tridiagonal matrices which allows us to find an analytic expression for A−1 and thus also the fraction parameters
  , provided in the code included at the end of the article.
3 REACTION RATES IN THE REDUCED MODEL
We start by determining relevant ranges for the values of the  -concentration c, which actually does not only depend on time but also on the distance d to the
  channel,
  . Figure 3A depicts the temporal evolution of the
  -concentration c for five stimuli at 60 Hz at four different distances
  from the
  -channel over the time interval
  , where
  s.1 The
  -dynamics were computed using the CalC modeling tool [15] with the assumptions for action-potential induced
  -inflow given in Figure 7 of Kobbersmed et al. [6] for the unpriming model at an extracellular
  -concentration of 1.5 mM.
As expected, c is smaller for larger distances to the  -channel, see Figure 3A. With continued stimulation, the base level that c drops to in between stimuli increases gradually, while the peak concentrations remain at very similar values. This means that we can assume the relevant domain of
  -concentrations to be sufficiently covered by the extent of
  closest to the channel. The range is given by
  , as the initial base level
  is on the order of
  M while the peaks are on the order of
  M.
M.
The fraction parameters  derived in Equation (10) are shown in Figure 3B over the relevant
  -domain. They correspond to the shares of states
  in the lumped state
  under the QSS-assumption. Interestingly, the QSS-distribution given by
  is sensitive to changes in c specifically over the previously chosen relevant range of
  -concentrations, and especially so for
  , which coincides with the accumulated concentrations in the inter-stimuli periods, see Figure 3A. For
  we observe
  , that is, the distribution inside the pool accumulates in R0. In contrast, for large
  -concentrations, R5 has the largest share. For intermediate values of c, the internal distribution appears rather balanced out.
Using the fraction parameters  and by averaging with the original reaction rates according to Equation (4), we can study the reduced model depicted in Figure 2. In order to clarify the scale and
  -dependencies of the reaction rates in the full model, we display them in Figure 4A.
 can be approximated remarkably well via the original unpriming rate
  , as depicted in Figure 4B:
 (11)
(11) -dependence of the two factors in
  , see Equation (4).
For  ,M we know that
  (see Figure 3B), which is why in this domain we find
  . On the other hand, for
  , we have
  (see Figure 4B) independently of
  .
.
Consequently, Equation (11) holds over the entire domain of  -concentrations, which suggests that the unpriming rate
  may also be used for the reduced model.

 ,
,  ,
,  ,
,  ,
,  ,
,  and
and  ,
,  ,
,  ,
,  ,
,  ,
,  are calculated from the model parameter values defined in ref. [6].
In order to compute the effective fusion rates for the precursor models in refs. [4, 5], the authors performed simulations and differentiation of the cumulative fusions. Notably, by defining  , our approach might allow to directly compute an approximate effective fusion rate for arbitrary
  -concentrations, which could be compared to a numerically determined effective fusion rate in the future.
4 APPROXIMATION VALIDITY AND RELEASE SITE POSITION
Note that the only approximation made in the model reduction is the QSS-assumption in the derivation of the new unpriming and fusion rates  and
and  , respectively. Therefore, by investigating the performance of the reduced model, we are implicitly testing for the validity of the QSS-assumption within the pool of lumped states for a given
  . In order to compare the two models we study their output currents C and
  , where
  is defined in analogy to Equation (2). Again, we consider five stimuli at 60 Hz and all parameter values as described in Section 3. The resulting behavior is displayed in Figure 5 for the same four distances as above, as well as for another distance
  nm which is close to the local minimizer of the approximation error, see Figure 5F. The blue lines in Figure 5 show the output of the full model, and the dashed colored lines give the output of the reduced model. Note the different scales on the vertical axes, which arise due to the lower absolute values of
  , leading to less overall fusions. Close to the
  -channel (
 nm) and the special distance
  , the reduced model performs extremely well and achieves almost the same output as the full model (see Figures 5A and 5C). At d1 (Figure 5B), the reduced model consistently underestimates the peak currents in terms of absolute values, while at d2 (Figure 5D), a consistent overestimation of the peak sizes can be observed. The overestimation remains at the largest distance d3 (Figure 5E), but is weakened. Interestingly, during the inter-stimulation periods (i.e., at the local minima of
  ), the reduced model's output current returns to values very similar to those of C for all positions
  .
.

 (dashed, brown/orange in consistency with (F)) in comparison to the full model's output current C (blue) for different distances to the
  -channel. (F) Approximation error
  (12) of the output current for the full range of site-channel distances. The color corresponds to the distance d for easier comparison with the other plots. All outputs are in response to five applied stimuli at 60 Hz and all parameters as described in Section3.
 (12)
(12) are arbitrary continuous non-decreasing functions [16]. We chose this error measure because the model reduction may result in very good agreement of the curves' overall shapes with some temporal displacement, as can be observed in Figure 5C. Due to the curves' high slopes, even small time shifts may have significant impact on the difference
  , so the approximation error should not simply be measured along the vertical axis when quantifying the model performance.2
We observe a nonlinear and non-monotonous relation, where the error almost vanishes at small distances and shows a local minimum around  as well as two local maxima. For very large distances the error decreases again. While the exact location of the extreme points is of minor importance (it depends on the parameter values), it is the qualitative behavior that we intend to explain in the following. Here, the nonlinear scaling of the unpriming rate
  with the
  -concentration as opposed to the linear scaling of the binding rates
  plays a central role (compare Figure 4A). The overestimation of the signal for large distances ≈250 nm results from an underestimation of the unpriming effect: At these positions, the calcium concentration c is small, resulting in comparatively large values of
  . On the other hand, the binding rates
  are large enough for the quasi-equilibrium distribution
  to significantly deviate from η(0). Especially it holds
  , and consequently
  . While in the full model, due to
  , unpriming keeps the vesicles from binding calcium ions and undergoing fusion, this effect is underestimated in the reduced model and more fusion events take place. In contrast, the underestimation of the signal for small distances ≈100 nm results from underestimating the fusion dynamics. Here, the calcium concentration is large enough for unpriming being negligible (see Figure 4A). The sizes of the binding/unbinding rates and the fusion rate
  , however, are of the same magnitude, such that in the full model a substantial part of state R5 undergoes fusion instead of unbinding. In other words, time-scale separation is not fulfilled and the QSS assumption is broken. For intermediate distances ≈150 nm these two effects seem to balance out.
5 CONCLUSION
In this work we have investigated the feasibility of applying a reduction technique based on the lumping approach by ref. [12] to an established model of presynaptic vesicle fusion dynamics. The technique preserves  -dependencies in the reduced model's dynamics, which allows for future use with arbitrary stimuli and study of further
  -dependent effects. We analysed the reduced model's reaction rates and provide expressions for them in Section 3. For the reduced unpriming rate, we determined that it can be approximated remarkably well by the full model's unpriming rate. Furthermore, we explained that the lumping approach can be used to directly estimate the effective fusion rate for arbitrary
  -concentrations without having to perform numerical integrations or Monte Carlo simulations. The relation of effective fusion rate to
  -concentration is commonly used to asses model validity for models of presynaptic fusion dynamics.
Due to the dependency of the dynamics on temporally strongly varying  -concentrations there is no obvious time-scale separation in the system. Consequently, the QSS assumption that the lumping approach is based on is not always satisfied. Nevertheless, our numerical studies showed a high level of approximation for the reduced model in comparison to the original one. The approximation error displays a very interesting non-monotonic behavior: the error vanishes close to the
  -channel and assumes a local maximum at a distance of ≈100 nm, where the deviation may be explained by an underestimation of the fusion dynamics by the reduced model. Another local maximum exists at larger distances of ≈250 nm, which may be explained by an underestimation of the unpriming effect. In both cases, the QSS assumption is violated which causes the error. At the local minimum of ≈150 nm the deviations partly cancel each other. For application purposes, these effects can be taken into account by rescaling the averaged rates accordingly depending on the release site's distance.
In the future, it would be of great interest to integrate the experimentally determined spatial distribution of release sites into this analysis in order to study the effective impact of the approximation error when considering the total current induced by many release sites in parallel. Furthermore, it would be desirable for application purposes to symbolically simplify or approximate the expression for the reduced model's fusion rate  such that parameter variations may easily be included. Finally, to assess the feasibility of using
  (Figure 4C) as an approximation, it could be compared to numerically computed values of the original model's effective fusion rate.
ACKNOWLEDGMENTS
This research has been partially funded by the Deutsche Forschungsgemeinschaft (DFG, German Research Foundation) through grant CRC 1114/3 and under Germany's Excellence Strategy – The Berlin Mathematics Research Center MATH+ (EXC-2046/1 project ID: 390685689).
Open access funding enabled and organized by Projekt DEAL.
Open Research
DATA AVAILABILITY STATEMENT
The code containing the rate expressions and their computation is available at https://doi.org/10.5281/zenodo.8102810
REFERENCES
- 1 The positions were chosen in order to cover a realistic arrangement of docked vesicles, which was experimentally determined in ref. [6] to follow a Rayleigh distribution over the range of 0–300nm and to assume an average value of 118 nm. Thus, d0 and d3 represent the tails of the distribution and d1 is close to the mean docked vesicle position.
- 2 An algorithm for the numerical computation of (12) was developed in ref. [16] and is implemented in the frechetdist Python library.