Synergistic Effect of Feeding Time and Diet on Hepatic Steatosis and Gene Expression in Male Wistar Rats
Abstract
Objective
Eating out of phase with the endogenous biological clock alters clock and metabolic gene expression in rodents and can induce obesity and type 2 diabetes mellitus. Diet composition can also affect clock gene expression. This study assessed the combined effect of diet composition and feeding time on (1) body composition, (2) energy balance, and (3) circadian expression of hepatic clock and metabolic genes.
Methods
Male Wistar rats were fed a chow or a free-choice high-fat, high-sugar (fcHFHS) diet, either ad libitum or with food access restricted to either the light or dark period. Body weight, adiposity, and hepatic fat accumulation as well as hepatic clock and metabolic mRNA expression were measured after 5 weeks of the diet. Energy expenditure was measured using calorimetric cages.
Results
Animals with access to the fcHFHS diet only during the light period showed more hepatic fat accumulation than fcHFHS dark-fed animals despite less calories consumed. In contrast, within the chow-fed groups, light-fed animals showed the lowest hepatic fat content, but they also showed the lowest caloric intake. Locomotor activity and heat production followed feeding times, except in the fcHFHS light-fed group. Hepatic clock and metabolic gene expression rhythms also followed timing of food intake. Yet, in the fcHFHS light-fed animals, clock gene expression appeared 3 hours advanced compared with chow light-fed animals, an effect not observed in the fcHFHS dark-fed animals.
Conclusions
An fcHFHS diet consumed in the light period promotes hepatic fat accumulation and advances clock gene expression in male Wistar rats, likely because of a mismatch between energy intake and expenditure.
Study importance
What is already known?
- ► Timing of food intake can affect metabolism.
- ► Shift workers are at higher risk for developing obesity and obesity-related disorders.
- ► This increased risk is probably due to food intake at a biologically “inappropriate” time.
What does this study add?
- ► We show an interaction effect of feeding time and diet on liver steatosis in male Wistar rats.
- ► Feeding a high-fat high-sugar diet at the wrong time of day (i.e., the regular sleep period) results in hepatic steatosis in male Wistar rats.
- ► This increased steatosis is presumably the result of a mismatch between energy intake and energy expenditure as well as a mismatch between energy intake and plasma insulin levels.
- ► When food intake is restricted to the inactive (i.e., sleep) period, hepatic clock gene expression rhythms are affected by diet.
- ► These results are important for the ongoing understanding of the unhealthy effects of shift work.
Introduction
Obesity has become a major health concern ((1)). Epidemiological studies have shown that shift workers are at higher risk for developing obesity and obesity-related pathologies, including type 2 diabetes mellitus ((2-5)). The accepted hypothesis is that these health problems arise from aberrantly timed feeding out of synchrony with the endogenous biological clock ((6)). In the contemporary Western 24/7 society, feeding moments are distributed over a great part of the day, often with meals ingested late in the evening, indicating that many more people than only shift workers might be at risk for metabolic derangement ((7, 8)).
All body cells contain the same molecular clock machinery, yet they are entrained by different signals. The central clock in the hypothalamic suprachiasmatic nucleus (SCN) is mainly entrained by light. Clocks in peripheral organs, including liver, muscle, or fat tissue, most of which cannot receive photic information themselves, are synchronized by the SCN via autonomic, endocrine, and behavioral signals ((8)). Most important external “Zeitgeber” for peripheral clocks is the feeding/fasting cycle ((9)), although the exact mechanism is not yet understood. Feeding at “inappropriate” times can entrain rhythms in liver triglycerides (TG), insulin, and proteins into a phase opposite to the phase of other physiological rhythms dictated by the master clock, hence contributing to metabolic imbalance ((10-12)), which may partly be explained by inefficiency in energy expenditure ((13)). In addition to a desynchronization between the central and peripheral clocks, desynchronization between peripheral clocks within different metabolic organs or between metabolic genes and clock genes within one organ can also lead to metabolic imbalance ((14)).
In humans, temporary circadian misalignment caused a decrease in glucose tolerance and insulin sensitivity and a complete reversion of the cortisol profile, which eventually may contribute to obesity development ((15)). Timing of food intake appeared important for the success of weight loss in humans ((16)). In line with these findings, time-restricted feeding, irrespective of the macronutrient composition, can attenuate metabolic diseases both in rodents and humans ((17-20)).
Evidence is growing that macronutrients can affect the molecular clock. Studies have shown the effects of a high-fat or high-sugar diet on metabolism and the clock (reviewed in Oosterman et al.) ((9)). Consuming the combination of fat and sugar affects adiposity and satiety hormones differentially from consuming sugar or fat alone ((21)). Interestingly, the specific effects of these macronutrients on the molecular clock mechanism have not been assessed before ((9)).
The aim of the current study was to decipher the synergistic effect of eating palatable food and eating at an “inappropriate” time of day on (1) whole body composition, (2) energy balance, and (3) circadian expression of hepatic clock and metabolic genes. Therefore, we used the free-choice high-fat, high-sugar (fcHFHS) diet, in which rats are free to consume their regular chow diet as well as saturated fat and a sugar solution, and they consume the components they prefer most at a particular time of day, hence resembling human diet composition and feeding habits ((22)). Because optimized timing of food intake can be an effective way to prevent and treat obesity and associated metabolic diseases ((23)), a better understanding of those mechanisms, as well as the effects of macronutrient composition, may help to improve further dietary interventions.
Methods
Animals
Male Wistar rats (n = 193) (Charles River Laboratories, Sulzfeld, Germany) were group-housed upon arrival with three to four animals per cage under controlled environmental conditions, with a room temperature of 20°C to 21°C, 44% to 60% humidity, and a 12-hour light-dark (LD) cycle. Animals going to receive light-phase feeding were housed under regular LD conditions (lights-on 7 am), whereas animals going to receive dark-phase feeding were housed under reversed LD conditions (lights-on 7 pm). Ad libitum–fed animals were randomized between the regular and reversed LD conditions. Animals on a regular and reversed LD schedule were acclimatized for 1 or 4 weeks, respectively. During the acclimation period, animals had ad libitum access to water and standard rat chow. Five days before the diet experiment, animals were randomized to be either group-housed (three to four animals/cage) or single-housed during the experiment. Body weight at the start of the experiment was 290 to 310 g (8-9 weeks old).
For logistic reasons, animals were divided into five different batches (36-55 animals/batch), each of which was in the experiment in separate periods. Starting body weights and acclimatization periods were similar among the different batches. Animals housed individually in metabolic cages provided data on food intake, body composition, and energy expenditure (n = 10-11 animals/diet group). For liver gene expression, data from all animals (n = 32-33/diet group) were used. All procedures were approved by the animal experimental committee of the Royal Netherlands Academy of Arts and Sciences.
Diets
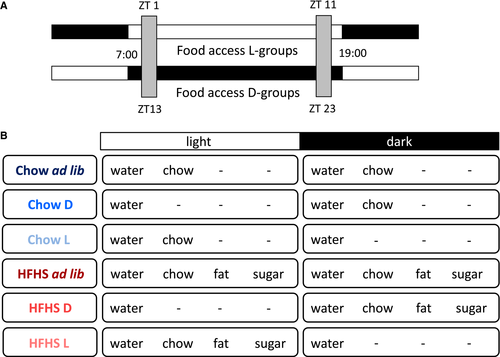
The chow diet consisted of 6.2% fat, 62.4% carbohydrates, and 18.6% protein (Irradiated Global 18% protein rodent diet no. 2918; Harlan Nederland, the Netherlands). The fcHFHS diet consisted of a dish of saturated fat (beef tallow, ‘‘Ossenwit,’’; Vandermoortele, Belgium) and a bottle of 30% sucrose water (sugar dissolved in water) next to regular chow pellets and tap water. Animals in the ad libitum groups had ad libitum access to the diet components 24 hours/day, whereas animals in the dark and light groups were restricted to the diet for 10 hours during the dark or light period, respectively. All groups had ad libitum access to regular tap water (Figure 1). Energy density used in calculations was as follows: 3.1 kcal/g for chow, 9.0 kcal/g for fat, and 1.2 kcal/g for sugar.
Measurements of food and animals
During 5 consecutive diet weeks, food and fluid intake were measured manually twice daily, 30 minutes after lights on (ZT0.30) (or off in reversed L/D setting [ZT12.30]) and 30 minutes before lights off (ZT11.30) (or on in reversed L/D setting [ZT23.30]). Total daily weighing time was 1 hour, resulting in undisturbed food access of ~10 hours per day. Animals were weighed twice a week (Figure 1).
Continuous measurements and indirect calorimetry
In week 4 of the experiment, at ZT6, individually housed animals were moved to calorimetric cages (size similar to home cages, Phenomaster/Labmaster system; TSE Systems GmbH, Bad Homburg, Germany) during 3 consecutive days. The first 6 hours (until ZT12) were considered an acclimation period, and data from these hours were discarded. Animals were within hearing and seeing distance of each other. Chow, fat, sugar, and water were available in accordance with each group’s diet, all attached to an automated weighing system, allowing for continuous measurements. Oxygen consumption and carbon dioxide production were measured continuously using indirect open-circuit calorimetry, from which the respiratory exchange ratio (RER) and heat production were automatically calculated. Fat and carbohydrate oxidation were calculated manually according to Bruss et al. ((24)). Locomotor activity was measured with ActiMot2 (TSE Systems GmbH) light beam frames. After measurements in the calorimetric cages, animals were returned to their home cages for the remainder of the experiment.
Tissue sampling
Animals were not fasted before termination, as fasting affects gene expression. Decapitation followed sedation during a short period with high-concentration carbon dioxide. A part of one liver lobe (similar for each animal) was taken out, frozen immediately in liquid nitrogen, and stored at −80°C until further use to preserve RNA in the tissue. Mesenteric, unilateral epididymal, perirenal, and subcutaneous white adipose tissue (WAT) (used as proxy for total WAT mass) as well as one liver lobe (similar for each animal) were carefully dissected and weighed. From this liver lobe, one part was frozen in liquid nitrogen, whereas another part was formalin-fixed for subsequent staining and histopathological assessment. Trunk blood was collected in heparinized tubes and centrifuged for 15 minutes at 4°C, and plasma was stored at −20°C until further use.
RNA isolation, cDNA synthesis, and real-time quantitative polymerase chain reaction
RNA isolation was performed using the Nucleospin RNA kit (Machery-Nagel Ltd., Oensingen, Switzerland) and nucleospin RNA II columns, following the manufacturer’s instructions. Finally, RNA was eluted in 40 µL RNase-free H2O. RNA concentration was determined using the Nanodrop 2000C (Thermo Fisher Scientific, Waltham, Massachusetts). The RNA Integrity Number (minimal value 9.20) was determined using the Agilent Bioanalyzer 2100 ( Santa Clara, California) Expert software. Input for cDNA synthesis was 200 ng RNA, using Transcriptor First Strand cDNA synthesis Kit (Roche, Basel, Switzerland) and diluted to a final dilution of 1:9 cDNA:RNase-free H2O. Quantitative real-time polymerase chain rection was performed using the Lightcycler480 (Roche) and SYBR Green detection. Primer sequences are listed in Supporting Information Table S1. Starting cDNA concentrations were calculated by using LinRegPCR (version 2015; Amsterdam UMC, Amsterdam, Netherlands) software. The amount of target mRNA was normalized against the geometric mean of three housekeeping genes (TATA box binding protein [TBP], cyclophilin, and β-actin).
Liver histopathology
Formalin-fixed, paraffin-embedded liver samples were sectioned at 3 μm and stained with hematoxylin and eosin. Liver sections (one slice per animal; n = 8-10 animals per diet group) were analyzed for the presence of steatosis, ballooning, and lobular inflammation by an expert pathologist (JV), using a semiquantitative scoring system ((25)). From snap-frozen liver tissue, 7-μm–thick cryo-sections were cut and stained with Oil Red-O, which detects hydrophobic lipids including esterified cholesterol, and counter-stained with hematoxylin. The same expert pathologist assessed the percentage of hepatocytes containing stained fat vesicles (in one slice per animal, 8-10 animals per diet group).
Analytical methods
Plasma concentrations of corticosterone and insulin were measured in duplicate using radioimmunoassay kits (MilliporeSigma, Burlington, Massachusetts; and MP Biomedicals, Orangeburg, New York, respectively). The intra-assay variation coefficient of the immunoassays was < 10%. Glucose was measured using the glucose oxidation method with the Biosen glucose analyzer (EKF Diagnostics, Barleben, Germany). TG were measured using spectrophotometry (Roche).
Data analysis and statistics
All data are shown as mean (SEM). Graphs were made using Graphpad Prism (Graphpad Software, Inc., La Jolla, California). Statistics were done using the SPSS software version 24 (IBM, Armonk, New York).
Results
Caloric intake, body weight gain, and adiposity
All animals on the fcHFHS diet showed hyperphagia compared with the animals on a chow diet (two-way ANOVA: diet, P < 0.001; timing, P = 0.0001; diet × timing, P = 0.497). Within the chow groups, the light- and dark-fed animals ingested fewer calories per 24 hours than chow ad libitum–fed animals (P < 0.001 and P < 0.01, respectively), but caloric intake between the chow light and dark groups was similar. Within the fcHFHS groups, only the light-fed animals consumed fewer calories than ad libitum animals (P < 0.05), which was mainly attributable to less chow intake, as fat and sucrose intake between the different HFHS groups did not differ. Caloric intake between fcHFHS light- and dark-fed animals was similar (Figure 2A).
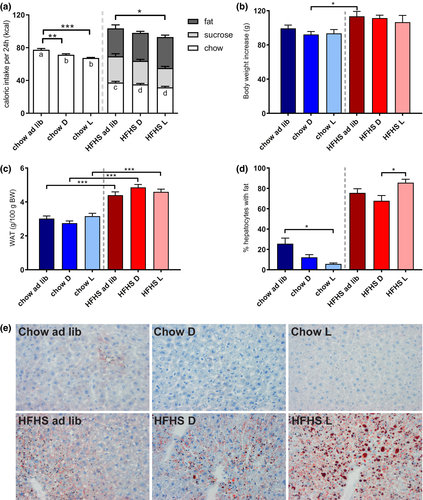
Animals on an fcHFHS diet gained more body weight after 34 days and showed more WAT mass compared with animals on a chow diet. Within the chow or fcHFHS groups, timing of food intake did not affect body weight gain (two-way ANOVA: diet, P < 0.001; timing, P = 0.424; diet × timing, P = 0.809) (Figure 2B) or WAT mass (two-way ANOVA: diet, P < 0.001; timing, P = 0.596; diet × timing, P = 0.057) (Figure 2C).
Hepatic fat accumulation
The percentage of fat accumulation in the livers of fcHFHS-fed animals was significantly higher than in the chow-fed animals, in which only few fat deposits were observed. Feeding time also affected fat accumulation, as significantly less hepatic fat accumulation was observed in the chow light-fed animals compared with the chow ad libitum–fed animals. Moreover, in the fcHFHS-fed animals, more fat accumulation in the fcHFHS light-fed group was observed compared with the fcHFHS dark-fed group (significant) and the ad libitum–fed group (trend). This reveals a markedly different response to timing in chow-fed and HFHS-fed rats concerning fat accumulation in the liver (two-way ANOVA: diet, P < 0.001; timing, P = 0.031; diet × timing, P = 0.001) (Figures 2D-2E).
Plasma concentrations
Average 24-hour insulin and glucose concentrations did not significantly differ between the diets. Plasma insulin levels peaked during the period in which most food was ingested, except for the HFHS light-fed group, in which no day-night variation was observed (Figure 3Ai). Diurnal variation in plasma glucose concentration was only observed in the chow dark-fed and HFHS ad libitum groups (Figure 3Aii). Plasma corticosterone concentrations peaked around the beginning of the dark period for all groups, indicating that the internal circadian rhythm was not disrupted and that light-phase feeding does not change the phase of the SCN. In the light-fed animals, a second corticosterone peak was observed in the beginning of the light period (Figure 3B), which is in accordance with previous observations on the effects of restricted feeding ((26, 27)).
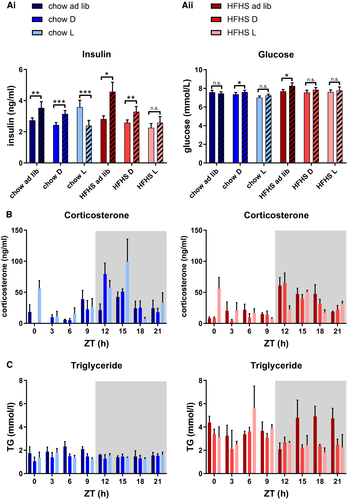
Differential effects of diet on plasma TG were found, with highest expression levels during the fasting period in chow-fed animals and highest levels during the feeding phase in HFHS-fed animals. In HFHS light-fed animals, TG peaked during the feeding phase, whereas no clear peak was observed in chow light-fed animals (Figure 3C).
Rhythms in energy expenditure
The RER gives an estimation about the substrate being oxidized. In ad libitum chow-fed animals, the RER fluctuated around 1.0. Temporal food restriction increased the RER amplitude compared with the ad libitum–fed groups, especially in the fcHFHS diet. Chow light-fed animals showed an almost 12-hour shifted RER pattern compared with ad libitum– and dark-fed animals. Similarly, RER in the fcHFHS light-fed animals was 12 hours shifted compared with fcHFHS ad libitum– and dark-fed animals (Figure 4A).
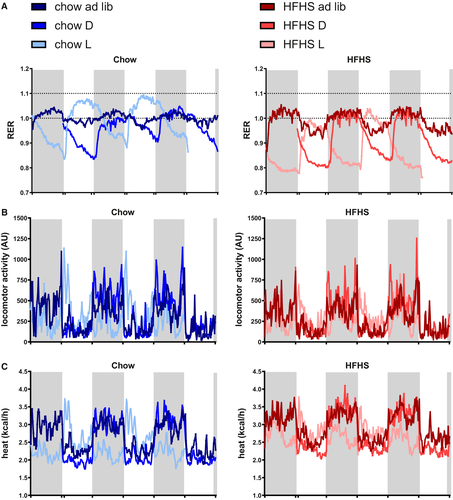
Locomotor activity showed a clear daily pattern in the chow ad libitum– and dark-fed groups, with most activity during the dark period and least activity during the light period. In the chow light-fed animals, although less pronounced, this pattern was reversed, with a short peak in activity in the light period right after food was presented. A similar pattern was observed in the fcHFHS groups (Figure 4B).
Heat production followed a comparable pattern to that of locomotor activity and was similar between chow-fed and fcHFHS-fed rats on a dark and ad libitum diet. Both light-fed chow and light-fed fcHFHS animals showed a 12-hour shift in heat production as well as an altered pattern, with a shorter peak compared with the ad libitum and dark-fed animals (Figure 4C).
24-hour and 12-hour energy expenditure data
Average 24-hour RER was affected by diet (lower RER in fcHFHS-fed vs. chow-fed animals) as well as by timing (significantly lower RER in the fcHFHS dark- and light-fed vs. fcHFHS ad libitum–fed animals), whereas no timing effect was found within the chow-fed animals (two-way ANOVA: diet, P < 0.0001; timing, P < 0.0001; diet × timing, P < 0.0001). RER breakdown into light and dark period showed a significantly higher RER during the period in which most calories were consumed in all groups (Figure 5A).
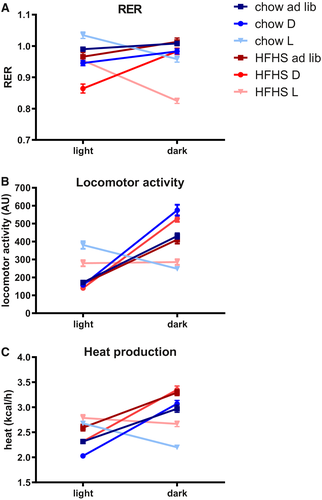
Average locomotor activity per 24 hours was higher in chow-fed vs. fc-HFHS-fed animals (two-way ANOVA: diet, P = 0.018; timing, P < 0.0001; diet × timing, P = 0.721). Within the chow group, dark-fed animals showed most locomotor activity (P = 0.008 and P = 0.06 compared with chow ad libitum and chow light, respectively). Within the fcHFHS diet groups, there was no significant difference in total 24-hour locomotor activity. Breakdown into light and dark period shows that all chow-fed animals display most locomotor behavior in the period that most food is ingested. The light/dark distribution for ad libitum–fed animals was 30%/70%. This variation was stronger in dark-fed animals (20%/80%) but weaker in the light-fed animals (60%/40%). Similarly, fcHFHS ad libitum–fed and dark-fed animals were most active during the dark period (LD distribution 30%/70% and 20%/80%, respectively). However, fcHFHS light-fed animals were unable to shift their activity pattern, resulting in a 50%/50% distribution (paired-samples t test light vs. dark, P < 0.0001 for all groups except for fcHFHS-light, which was nonsignificant) (Figure 5B).
Average 24-hour heat production showed a diet effect (more heat production in animals on an fcHFHS vs. chow diet) as well as a timing effect (less heat production in the dark- and light-fed animals vs. ad libitum–fed animals) (two-way ANOVA: diet, P < 0.0001; timing, P = 0.001; diet × timing, P = 0.985). Breakdown into light and dark period shows, for all groups, a significantly higher heat production in the period in which most food is ingested, although the LD variance was least in the fcHFHS-light group (Figure 5C).
Fat and carbohydrate oxidation
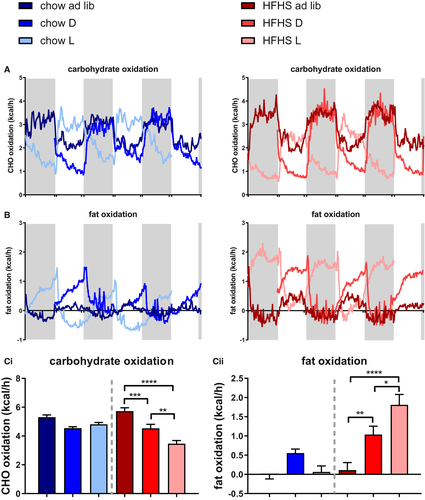
Temporal food restriction increased the diurnal amplitude of carbohydrate as well as fat oxidation in both chow and fcHFHS animals (Figures 6A-6B). Interestingly, temporal food restriction only affected 24-hour mean carbohydrate and fat oxidation in the fcHFHS-fed animals, with increased fat oxidation and decreased carbohydrate oxidation compared with fcHFHS ad libitum animals, whereas no effect was seen within the chow groups. Fat oxidation was highest, whereas carbohydrate oxidation was lowest in the fcHFHS light-fed group (Figure 6C).
Hepatic gene expression
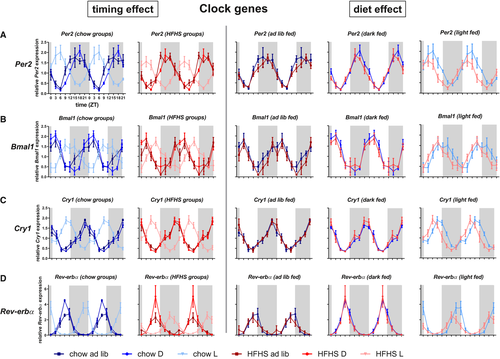
To assess the effect of diet composition and the effect of diet timing on the hepatic clock, daily expression rhythms of clock genes and several metabolic genes involved in gluconeogenesis, glycolysis, and lipolysis were measured. For all clock genes, peak expression in the light-fed groups was almost 12-hour shifted compared with the dark-fed and ad libitum–fed groups, with comparable expression pattern between the ad libitum– and dark-fed groups. Period 2 (Per2) and brain and muscle ARNT-like 1 (Bmal1) cycle in antiphase in the ad libitum– and dark-fed groups, whereas this antiphase is less strong in the light-fed groups. Splitting the graphs according to timing of food intake shows that diet composition had no major effects on clock gene expression in any of the dark-fed and ad libitum–fed animals, whereas the fcHFHS light-fed diet resulted in a 3-hour advance in the expression pattern of Per2, Bmal1, Cry1, and Rev-erbα (Figure 7) compared with the chow light-fed diet.
Peroxisome proliferator-activated receptor gamma coactivator 1-alpha (Pgc1α), encoding PGC1α, a clock-controlled gene that is involved in gluconeogenesis in the liver, peaked at the end of the fasting period in all groups. Restricting food intake to the light period enhanced the rhythmic expression of Pgc1α (Figures 8A and 8E).
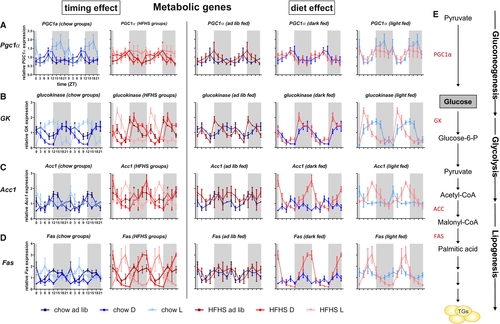
Glucokinase, involved in glycogen synthesis and glycolysis, peaked towards the end of the feeding period and cycles with food intake. Temporal food restriction enhanced the amplitude independent of diet. Within similar feeding periods, the amplitude of gene expression was greater and the peak expression occurred earlier in fcHFHS-fed compared with chow-fed animals (Figures 8B and 8E).
Acc1, encoding acetyl-CoA carboxylase, involved in the first step in lipogenesis, peaked at the end of the fasting period in chow-fed animals but toward the end of the feeding period in fcHFHS-fed animals. Temporal food restriction enhanced the amplitude of gene expression in both diet groups (Figures 8C and 8E).
Fas, encoding fatty acid synthase (FAS), which is involved in lipogenesis, did not show a clear rhythm in ad libitum–fed animals. Temporal food restriction established a Fas rhythm, which was more pronounced in fcHFHS compared with chow animals. Peak expression in the fcHFHS light-fed group was in the middle of the feeding period, while it was toward the end of the feeding period in the fcHFHS dark-fed group (Figures 8D-8E).
Differential effects of diet composition and timing were also shown for peroxisome proliferator-activated receptor (Ppar)-α and Ppar-γ, (encoding PPARα and –γ, respectively), two genes involved in many aspects of lipid metabolism (Supporting Information Figure S1).
In summary, in the liver, rhythms of clock genes as well as metabolic genes are affected by timing of food intake and diet composition. The effect of diet on clock gene expression becomes more apparent when food intake is limited to the light period. Differences in metabolic genes between fcHFHS and chow were more pronounced in both temporal restricted groups.
Discussion
In this study, we assessed the combined effects of meal timing and meal composition on body weight, fat accumulation, and rhythmic expression of hepatic clock and metabolic genes.
Our results show that consuming an fcHFHS diet during the normally inactive period resulted in significantly more hepatic fat accumulation than consuming the same diet during the normal activity period, whereas in chow-fed animals, no difference in hepatic fat accumulation between light- and dark-period feeding was observed. These findings show that the combination of diet and timing is important for the accumulation of ectopic fat in the liver, which was not explained by differences in caloric intake of the nutrient components. In humans, the adverse effect of the pathological accumulation of fat in the liver is associated with insulin resistance and metabolic syndrome and is a better predictor for type 2 diabetes mellitus than the amount of visceral adipose tissue. Our current results show that ingesting a diet rich in fat and sugar at the wrong time of day may further deteriorate the negative impact of a high-caloric diet on the metabolic profile.
Unexpectedly, the chow-light and fcHFHS-light diet did not lead to increased body weight gain or adiposity as compared with the ad libitum– or dark-fed diet. This is in contrast to previous studies, in which the light-fed rodents gained most body weight. This difference may be related to a species difference (rats vs. mice) or the fact that rats were allowed to eat over 12 hours ((14)), whereas the rats in this study had access to food for only 10 hours. Presumably, in our study, the expected obesity caused by feeding at the wrong time of day was counteracted by the positive effects of a relative long fasting period, which has been shown to prevent obesity and obesity-related symptoms. In humans, the existence of hepatic steatosis without increased waist circumference has been described ((28)).
In order to find a mechanism for the increased liver fat accumulation in the fcHFHS light-fed animals, we assessed whether this was the result of decreased fat oxidation or increased lipogenesis.
Diurnal variation in energy expenditure was strongly affected by feeding time. Restricting food to the light period resulted in weakening of the day-night variation in energy expenditure. This indicates that food availability is able to shift the normal rest-activity pattern, but that the influence from the SCN cannot be completely overruled. Interestingly, though chow light-fed animals at least partly reversed their activity pattern to match the period of food intake, fcHFHS light-fed animals completely lost their light/dark rhythm in locomotor activity and heat production, leading to a mismatch between energy intake and expenditure. Hence, the ratio of consumed calories over locomotor activity was highest in the fcHFHS light-fed group, which may explain the increase in hepatic fat accumulation.
Temporal food restriction altered 24-hour mean fat and carbohydrate oxidation in fcHFHS-fed animals. fcHFHS light-fed animals showed significantly higher 24-hour mean fat oxidation and significantly lower carbohydrate oxidation than the fcHFHS dark-fed animals, a difference that may contribute to the increased hepatic steatosis in fcHFHS light-fed animals compared with fcHFHS dark-fed animals. Interestingly, within the chow-fed animals, temporal food restriction did not significantly alter 24-hour mean fat and carbohydrate oxidation, although it did increase the daily amplitude of these rhythms.
Next, we assessed expression levels of genes involved in lipogenesis. In contrast to the hypothesis that lipogenesis was enhanced in the fcHFHS light-fed group, no major differences in expression levels were found between the differently timed fcHFHS groups (Figure 7). The apparent discrepancy between increased liver fat and absence of upregulation of genes involved in lipogenesis may be explained by hepatic TGs that were formed from the re-esterification of existing or ingested lipids and did not arise from de novo lipogenesis, as was shown in mice ((29)).
A remaining question is whether the increased hepatic steatosis in the fcHFHS light-fed animals is the result of altered TG excretion from the liver or augmented TG storage. Future studies are needed to assess the mechanism by which diet timing and composition can lead to this increased hepatic steatosis.
Hepatic clock gene expression was affected by diet but only when food access was restricted to the light period. In the light-fed groups, a 3-hour phase difference was apparent between the chow and fcHFHS groups, whereas no such diet-induced phase difference was found in the ad libitum– and dark-fed groups. This indicates a synergistic effect of diet composition and feeding time on hepatic clock gene expression and increased vulnerability of the liver clock when there is a combined desynchronization of light/dark signals from the central clock and feeding signals from a fcHFHS diet.
Insulin fluctuations are important entraining signals for the liver. In the light-fed fcHFHS animals, no clear (feeding-dependent) insulin pattern was observed, whereas the insulin peak in chow light-fed animals coincided with the period in which most food was ingested. The absence of a clear insulin rhythm in the fcHFHS animals may account for the shifted clock gene expression pattern between chow light-fed and fcHFHS light-fed animals.
The diet-induced apparent phase difference in clock gene expression in the light-fed groups cannot be explained by a difference in timing of food intake between chow and fcHFHS animals, as both groups started consuming their food immediately after it became available, and caloric intake was similar for both groups in the first 3 hours of the light period. Yet, in that period, 40% to 50% of the caloric intake of fcHFHS-exposed animals consisted of fat, pointing to a way diet may affect the phase of the clock in the light-fed groups. Further research should be aimed at disentangling the effects of the different macronutrients on clock gene expression.
In conclusion, in the present study, we show a synergistic effect of consuming a fcHFHS diet at the inappropriate time of day on hepatic fat content. This effect was not observed when a regular chow diet was consumed or when the fcHFHS diet was consumed during the regular dark (active) period. To our knowledge, we are the first to show an interaction effect of feeding time and diet composition on liver steatosis. This is an important finding, as hepatic steatosis is associated with insulin resistance and can lead to liver cirrhosis, potentially leading to liver failure. The proposed mechanism for this time of day–dependent diet effect is a mismatch between energy intake and energy expenditure as well as a mismatch in energy intake and plasma insulin levels. These results are important for the ongoing understanding of the unhealthy effects of shift work.
Acknowledgements
We acknowledge Unga A. Unmehopa and Bernadine Snell for their assistance and the quality control of RNA isolation and real-time quantitative polymerase chain reaction.
Funding agencies
JEO was supported by an Academic Medical Center PhD scholarship.
Disclosure
The authors declared no conflict of interest.
Author contributions
Concept and design: JEO, EF, AK, and SlF; experiments and procedures: JEO, LLK, LE, UU, EwF, and JV; data analysis: JEO and LLK; writing of the article: JEO, AK, and SlF; reviewing article: AK, SlF, EF, LLK, UU, EwF, LE, and JV; preparing figures: JEO.


