MicroRNA Profiling in Adipose Before and After Weight Loss Highlights the Role of miR-223-3p and the NLRP3 Inflammasome
Abstract
Objective
Adipose tissue plays a key role in obesity-related metabolic dysfunction. MicroRNA (miRNA) are gene regulatory molecules involved in intercellular and inter-organ communication. It was hypothesized that miRNA levels in adipose tissue would change after gastric bypass surgery and that this would provide insights into their role in obesity-induced metabolic dysregulation.
Methods
miRNA profiling (Affymetrix GeneChip miRNA 2.0 Array) of omental and subcutaneous adipose (n = 15 females) before and after gastric bypass surgery was performed.
Results
One omental and thirteen subcutaneous adipose miRNAs were significantly differentially expressed after gastric bypass, including downregulation of miR-223-3p and its antisense relative miR-223-5p in both adipose tissues. mRNA levels of miR-223-3p targets NLRP3 and GLUT4 were decreased and increased, respectively, following gastric bypass in both adipose tissues. Significantly more NLRP3 protein was observed in omental adipose after gastric bypass (P = 0.02). Significant hypomethlyation of NLRP3 and hypermethylation of miR-223 were observed in both adipose tissues after gastric bypass. In subcutaneous adipose, significant correlations were observed between both miR-223-3p and miR-223-5p and glucose and between NLRP3 mRNA and protein levels and blood lipids.
Conclusions
This is the first report detailing genome-wide miRNA profiling of omental adipose before and after gastric bypass, and it further highlights the association of miR-223-3p and the NLRP3 inflammasome with obesity.
Study Importance
What is already known?
- ► miRNAs are involved in obesity.
- ► miRNAs are differentially expressed in subcutaneous adipose after versus before weight loss (hypocaloric diet, gastric bypass, and exercise induced).
- ► The NLRP3 inflammasome is involved in obesity.
What does this study add?
- This is the first report of miRNAs in omental adipose before and after gastric bypass and associated weight loss, showing the downregulation of miR-223-3p and its antisense relative miR-223-5p.
- NLRP3 inflammasome protein increased in omentum following gastric bypass and associated weight loss.
- This study provides additional evidence for an association between obesity and miR-223-3p and the NLRP3 inflammasome.
Introduction
Obesity is a chronic inflammatory condition that can lead to the development of insulin resistance and type 2 diabetes (T2D). As an endocrine organ, adipose tissue is a major contributor to the metabolic dysfunction observed in obesity (1). There are two main categories of white adipose tissue in humans: subcutaneous and omental (intra-abdominal). These have distinct structural and biochemical properties (2); both body fat distribution and their different biological functions influence metabolic risk.
Microarray profiling of microRNAs (miRNAs) in human adipose tissue has compared different subcutaneous adipose depots (3) and subcutaneous and omental adipose tissues (4). Targeted analyses of miRNAs in omental (5) and subcutaneous adipose tissues have identified miRNAs implicated in obesity (6, 7) and related metabolic disease (8). miRNAs in adipose tissue also have been shown to regulate, or be regulated by, obesity-related genes, such as leptin (LEP) (9) and peroxisome profliferator-activated receptor gamma (PPARG)(10). However, there is limited information on miRNA changes following weight loss in humans. Recently, differential miRNA expression in subcutaneous adipose tissue following hypocaloric diet- and exercise-induced weight loss was reported (11), and two studies have profiled miRNAs in subcutaneous adipose tissue before and after bariatric surgery (12, 13).
The composition of adipose tissue is complex, including a matrix of extracellular proteins, endothelium, adipocytes (20%-40% of cellular content), fibroblasts, stem cells, preadipocytes, and immune cells (14). Obesity involves a low-grade activation of the innate immune system, and a set of innate intracellular sensors and receptors known as inflammasomes have been recognized as key contributors to the chronic inflammatory state observed in obesity (15). Once inflammasome proteins are stimulated by a ligand, they associate with apoptosis-associated speck-like protein (ASC) and activate the caspase-1 enzyme cleaving pro-interleukin (IL)-1 and pro-IL-18 cytokines into their active forms. The NLRP3 (NACHT, LRR, and PYD domains-containing protein 3) inflammasome is associated with obesity, providing a mechanistic link between obesity, inflammation, and the development of insulin resistance (15).
Roux-en-Y gastric bypass surgery (shortened to gastric bypass hereafter), which is used to treat severe obesity, results in marked weight loss and a significant decrease in metabolic dysfunction, including T2D. We hypothesized that given both the regulatory role of miRNAs and the importance of adipose tissue in obesity, miRNA expression levels would differ in adipose tissue before and after gastric bypass and associated weight loss. We reasoned that these changes might provide insights into the regulatory role of miRNAs in the metabolic dysregulation, including impact on the inflammasome, observed in obesity. Here we report genome-wide miRNA profiling before and after gastric bypass in subcutaneous and, to the best of our knowledge, for the first time in omental adipose tissue.
Methods
Patient population and samples
This study is approved by The Health and Disability Ethics Committee, New Zealand, and conducted in accordance with the Declaration of Helsinki. All participants provided written informed consent. Fifteen females with obesity underwent gastric bypass (single surgeon) and returned for a second operation (incisional hernia repair, n = 8; incisional hernia repair and abdominoplasty, n = 4; ring removal, n = 2; or Roux loop lengthening, n = 1). Adipose tissue biopsies were taken at the time of surgery, immediately snap frozen in liquid nitrogen, and stored at −80°C.
miRNA array profiling was performed on paired subcutaneous and omental adipose samples from all 15 individuals. Subsequent analyses were performed on a subset as sample availability allowed. Of the original samples, 14/15 and 13/15 were available for reverse transcription-quantitative polymerase chain reaction (RT-qPCR) analyses and 9/15 and 11/15 were available for protein analyses for subcutaneous and omental adipose, respectively.
Nucleic acid extraction and analysis
RNA
Total RNA was extracted (100 mg of adipose tissue) using TRIzol (Invitrogen) as per the manufacturer’s protocol, with an additional chloroform extraction. RNA quantity and quality were assessed using a NanoDrop (Thermo Fisher Scientific) and Agilent Bioanalyzer.
miRNA arrays
A total of 200 ng of total RNA was analyzed using the Affymetrix GeneChip miRNA 2.0 Array as per the Affymetrix protocol, and arrays were scanned with a Hewlett Packard G2500A GeneArray Scanner (Hewlett Packard). Affymetrix miRNA QC Tool version 1.1.1.0 (Affymetrix) was used for data summarization and initial quality control. Data are available at European Bioinformatics Institute (EBI) array database: E-MTAB-8594.
Differential expression analysis of miRNA arrays
Data were analyzed using Bioconductor Affy (16) and Limma (17) packages. Raw probe level data were parsed in Affy, background corrected, and normalized (using rma2 [robust multichip average]). Probes were filtered for “Homo sapiens” (Affymetrix). A linear model with array weights correction was fitted, and an empirical Bayes method was applied (multiple testing correction, Limma). Paired analyses (sample before/after surgery) were used to identify differentially expressed miRNAs. Probes were considered robustly differentially expressed if they passed the following: Benjamini Hochberg (18) adjustment false discovery rate (FDR) < 0.05, absolute fold change ≥ 1.5, and positive B statistic.
Biomarker analyses of miRNA arrays
We applied a combination of statistical tools and graph theoretical algorithms to identify putative biomarkers indicative of tissue time point (before/after gastric bypass). miRNAs were initially scored by maximizing the difference between intraclass mean values, less the sum of the SD within each class. A finite, simple, and undirected graph was then constructed, treating individuals as vertices and weighting edges by a similarity metric using the highest scoring sites. The graph was thresholded and cliques isolated to check for homogeneity. Planar red/blue dominating set was employed to eliminate miRNAs best covered by others (19). Specifically, we first calculated a merit value for each miRNA based on the miRNA’s apparent utility in separating sample sets. We then employed graph theoretical algorithms (primarily clique and dominating set) to identify those sites that best covered others and a Wilcoxon rank test to apply a P < 0.001 threshold. To estimate the potential effectiveness of this list, pairwise intersample scores were calculated using miRNA and expression values. If successful, homogeneous pairs should score highly, while inhomogeneous pairs should not, thus providing the desired separation.
RT-qPCR
For mRNA, 500 ng of total RNA was reversed transcribed (SuperScript III VILO cDNA Synthesis Kit, Life Technologies) as per the manufacturer. RT-qPCR was performed in triplicate per sample using 2 µL of 1/5 dilution complementary DNA (cDNA) and TaqMan gene expression assays (Life Technologies) as follows: NLRP3 (Hs00918082_m1 and Hs00366465_m1, mean cycle threshold [Ct] calculated), PKNOX1 (PBX/knotted 1 homeobox 1, Hs01007094_m1), GLUT4 (faciliated glucose transporter member 4; also known as solute carrier family 2 member 4, SLC2A4, Hs00168966_m1), LEP (Hs01084494_m1), and ADIPOQ (adiponectin, Hs00977214_m1). 18s (4319413E) and PPIA (cyclophilin A, 4326316E) were selected as endogenous controls based on previous gene expression studies in adipose tissue (20, 21). No significant difference was seen across time points in each tissue for these two controls. The combined mean expression (Ct) for 18s and PPIA was used to normalize target mRNA expression using the ΔCt method (ΔCt = CttargetmRNA − meanCtcontrols). Differential expression after compared with before gastric bypass was assessed using a paired t test. Fold change in expression between time points was calculated using 2−ΔΔCt.
For miRNA, 60 ng of total RNA was reverse transcribed with enrichment for miRNAs of interest (as per the manufacturer protocol, TaqMan MicroRNA Reverse Transcription Kit, Thermo Fisher Scientific). TaqMan assays were as follows: miR-223-3p (002295), miR-223-5p (002098), miR-23a-5p (002439), miR-27a-5p (002445), miR-1246 (462575_mat), miR-24-2-5p (002441), miR-421 (002700), and miR-22 (000398). miR-16 (000391) was selected as a control based on the literature (4, 5). RT-qPCR was performed in triplicate per sample using 1.6 µL of a 1/10 dilution cDNA. The mean Ct (triplicate) for miR-16 was used to normalize miRNA expression. No significant variation was observed across samples in this study for miR-16. Differential expression after compared with before gastric bypass was assessed using a paired t test. Fold change in expression between the two time points was calculated using 2−ΔΔCt.
DNA
DNA was extracted (100 mg of adipose tissue, QIAamp DNeasy Tissue Kit, Qiagen) as per the manufacturer’s protocol, including a 3-hour initial lysis step and RNase treatment. DNA was quantitated using a NanoDrop.
DNA methylation pyrosequence analysis
Genomic DNA was sent to EpigenDx (Hopkinton, Massachusetts) for analysis. Assays were designed to target CpG sites interrogated by the Illumina 450K platform and annotated within miR-223 (cg06701191, cg13716034, cg19127840) and NLRP3 (cg18126557). Pyrosequencing performs targeted sequencing of an amplicon and therefore can include additional CpGs in close proximity to the loci of interest. Assays were designed, optimized, and performed by EpigenDx.
Protein extraction and analysis
A total of 100 mg of adipose tissue was homogenized in 400 µL of protein lysis buffer (Tris HCl, NaCl, 10% NP-40, 10% sodium deoxycholate, 100nM ETDA, pH 7.4 with protease and phosphatase inhibitors), the soluble fraction quantitated (DC Lowry kit, Bio-Rad), and 20 µg of protein separated (4%-12% polyacrylamide minigels, NuPAGE system; Thermo Fisher Scientific). Paired (before/after gastric bypass) samples were run adjacently for a given individual and tissue type. Proteins were transferred to polyvinylidene fluoride membrane, immunoblotted, and visualized using enhanced chemiluminescence prime (Amersham; GE Healthcare). NLRP3, caspase, and ASC antibodies (Abcam ab91525; Invitrogen AHZ0082; and Novus Biologicals NB100-92442) were used at 1:1000 and a goat antirabbit secondary at 1:2000 (HRP sc-2004). Enolase 1 (ENO1, Abcam ab54979-100, 1:20000) was used as a control based on the literature (22) with a goat antimouse secondary (1:2000, Santa Cruz sc-2005). NLRP3, caspase, ASC, and the control ENO1 were assayed on the same blot, with a single stripping step where ASC was interrogated after stripping.
Immunoblot images were scanned, and protein band intensity was calculated. Values were normalized against control protein ENO1 (22). No significant difference was observed in ENO1 expression between time points.
Data analysis
All analyses were performed using R (R Foundation for Statistical Computing) and Bioconductor (23) packages and custom bash scripts.
Results
Study population characteristics
Clinical and anthropometric data (n = 15 females) were collected prior to each surgery. Mean time between surgeries was 17.6 (+/− 6.9) months. Mean loss of original body weight was 37% (± 7.9%), and mean decrease in BMI was 8.3 (± 7.8) kg/m2. Statistically significant decreases in systolic blood pressure, glucose, insulin, hemoglobin A1c (HbA1c), triglycerides, total cholesterol, and low-density lipoprotein concentrations were observed post gastric bypass (Table 1).
| Before weight loss | After weight loss | t | P | |
|---|---|---|---|---|
| Age | 44 (10) | 45 (10) | −7.64 | 1.16 × 10⁻⁶ |
| Weight, kg | 123.9 (33.3) | 76.2 (15.4) | 8.31 | 4.42 × 10⁻⁷ |
| BMI, kg/m2 | 47.6 (11.3) | 29.3 (5.5) | 9.10 | 1.48 × 10⁻⁷ |
| Glucose, mmol/L | 5.5 (1.2) | 4.6 (0.6) | 2.35 | 0.017 |
| Insulin, pmol/L | 176.2 (168.1) | 33.4 (19.3) | 3.04 | 0.006 |
| HbA1c | 6.0 (0.6) | 5.5 (0.5) | 2.42 | 0.018 |
| Triglycerides, mmol/L | 1.6 (0.7) | 1.0 (0.3) | 3.00 | 0.005 |
| Total cholesterol, mmol/L | 5.3 (0.8) | 4.6 (0.6) | 4.23 | 4.48 × 10⁻⁴ |
| HDL, mmol/L | 1.4 (0.4) | 1.8 (0.9) | −1.46 | 0.083 |
| LDL, mmol/L | 3.2 (1.1) | 2.6 (0.6) | 2.71 | 0.009 |
| Systolic blood pressure, mmHg | 135 (18) | 115 (9) | 3.37 | 0.003 |
| Diastolic blood pressure, mmHg | 78 (13) | 73 (9) | 1.67 | 0.061 |
- Data expressed as mean (SD) based on paired t test and one-tailed P values (given that gastric bypass is known to result in a marked reduction in weight and metabolic risk).
- HbA1c, hemoglobin A1c; HDL, high-density lipoprotein; LDL, low-density lipoprotein.
miRNAs are differentially expressed in adipose before and after gastric bypass
miRNA expression was profiled using the Affymetrix GeneChip miRNA 2.0 Array (1,105 human RNA targets) in subcutaneous and omental adipose tissues at baseline (gastric bypass) and after significant weight loss (second surgery). Paired analyses were performed (before/after gastric bypass) for each tissue (n = 15). For subcutaneous adipose, 13 miRNAs (miR-23a-5p, miR-27a-5p, miR-200c-3p, miR-223-3p, miR-1246, miR-24-2-5p, miR-128, miR-421, miR-3178, miR-1224-5p, miR-221, miR-22, miR-762) were significantly downregulated after gastric bypass (absolute fold change ≥ 1.5, FDR-adjusted P ≤ 0.05, positive B statistic; Table 2).
| miRNA | Adipose tissue | Fold changea after vs. before weight loss | FDR-adjusted P value | B statistic | Fold changea (technical replication) | P (technical replication)b |
|---|---|---|---|---|---|---|
| miR-23a-5p * | Subcutaneous | −8.1 | 9.5 × 10⁻⁵ | 8.8 | −8.1 | 3 × 10⁻⁵ |
| miR-27a-5p * | Subcutaneous | −6.8 | 0.0001 | 8.1 | −6.8 | 1.4 × 10⁻⁶ |
| miR-200c-3p | Subcutaneous | −6.6 | 0.03 | 1.2 | ||
| miR-223-3p | Subcutaneous | −5.6 | 0.05 | 0.8 | −2.1 | 0.01 |
| miR-1246 * | Subcutaneous | −5.4 | 0.002 | 5.3 | −2.8 | 0.004 |
| miR-24-2-5p * | Subcutaneous | −2.7 | 0.002 | 5.2 | −1.6 | 0.001 |
| miR-128-3p | Subcutaneous | −2.3 | 0.04 | 0.9 | ||
| miR-421 * | Subcutaneous | −2.2 | 0.01 | 2.8 | −1.3 | 0.006 |
| miR-3178 | Subcutaneous | −2.1 | 0.01 | 2.7 | ||
| miR-1224-5p | Subcutaneous | −1.6 | 0.05 | 1.0 | ||
| miR-221 | Subcutaneous | −1.5 | 0.03 | 1.4 | ||
| miR-22-3p * | Subcutaneous | −1.5 | 0.006 | 3.6 | −0.8 | 0.02 |
| miR-762 | Subcutaneous | −1.5 | 0.04 | 1.0 | ||
| miR-223-3p | Omentum | −9.6 | 8.0 × 10⁻⁶ | 7.3 | −1.5 | 0.005 |
- Array data for miRNAs with absolute fold change ≥ 1.5, FDR P ≤ 0.05, and positive B statistic, along with associated RT-qPCR technical replication data if performed. Negative fold change indicates less miRNA detectable after compared with before gastric bypass and weight loss.
- a Fold change in expression observed using RT-qPCR (fold change = 2−ΔΔCt).
- b P value for paired t test.
- * Indicates miRNAs that best discriminated between time points for biomarker analysis of subcutaneous adipose.
One miRNA, miR-223-3p, showed significant downregulation following gastric bypass in omentum (9.6-fold less).
miRNA biomarker analysis
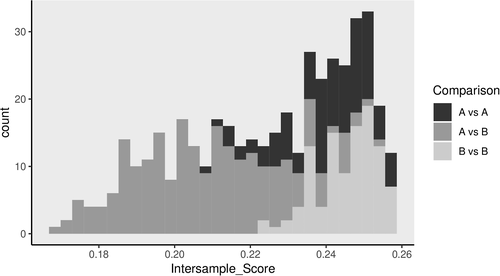
In addition to traditional differential expression analyses, we explored the power of miRNAs to separate the tissues before and after gastric bypass. Therefore, we applied a combinatorial approach to identify miRNA signatures that discriminated the time points. We have previously applied this methodology to both mRNA expression and DNA methylation data (24, 25). In subcutaneous adipose, 6/13 miRNAs identified as significantly differentially expressed (miR-1246, miR-22-3p, miR-421, and the miRNA cluster miR-23a-5p, miR-24-2-5p, and miR-27a-5p) passed filtering and had positive merit scores (estimates the relative ability of a miRNA to distinguish among sample classes) and a strong ability to separate between time points through the distribution of pairwise calculated intersample scores (Figure 1). The equivalent analysis for omentum identified only one miRNA, miR-223-3p, with a positive merit score and a relatively poor ability to separate time points.
We chose to technically validate the six miRNAs identified with both analysis approaches in subcutaneous adipose. In addition, given that miR-223-3p was differentially expressed in both adipose tissues, we investigated this miRNA and its antisense relative miR-223-5p. RNA was available for 14/15 subcutaneous and 13/15 omental of the original paired adipose samples. RT-qPCR revealed significant downregulation for all miRNA species (Table 2) after gastric bypass and associated weight loss.
mRNA expression analyses and miR-223 targets
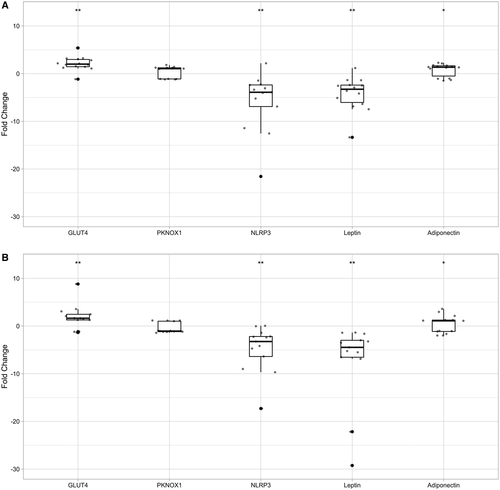
We chose to concentrate further analyses on miR-223 because it was the only miRNA for which differential expression was observed in both adipose tissue types. We selected experimentally validated miR-223-3p targets NLRP3, GLUT4, and PKNOX1 because of their roles in inflammation and obesity signalling pathways, and we included the adipokine genes LEP and ADIPOQ as positive controls. Expression was evaluated by RT-qPCR in available RNA samples. NLRP3 (fold change: −5.8 and −4.8 in subcutaneous and omentum, respectively) and LEP (fold change: −4.2 and −7.2 in subcutaneous and omentum, respectively) were significantly downregulated (paired t test; P < 0.01; Figure 2) in both tissues following gastric bypass. Conversely, GLUT4 mRNA was significantly upregulated in both tissues (fold change: 2.1 and 1.8 in subcutaneous and omentum, respectively; P < 0.05), and ADIPOQ was significantly upregulated in subcutaneous adipose only (fold change: 0.8; P < 0.05). No significant changes in PKNOX1 expression were observed.
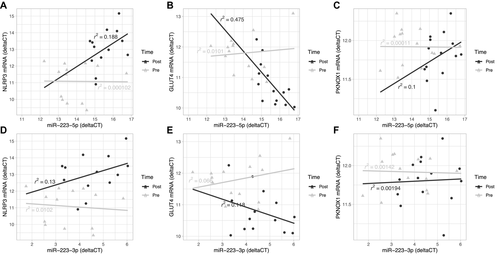
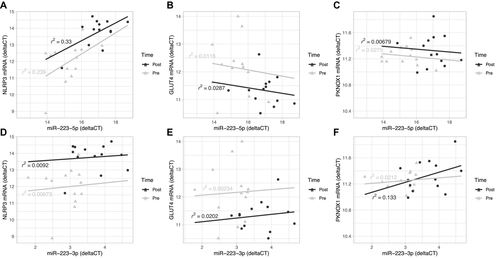
An investigation of correlations between the levels of miR-223-3p and its antisense miR-223-5p with the mRNA levels of its targets NLRP3, GLUT4, and PKNOX in subcutaneous adipose (Figure 3) and omentum (Figure 4) revealed no significant associations, except between miR-223-5p and GLUT4 in subcutaneous adipose after surgery (R2 = 0.48).
Protein analysis of NLRP3 inflammasome
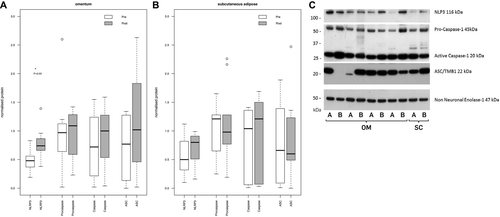
NLRP3 is an experimentally validated target of miR-223-3p, and given the importance of inflammation in metabolic dysfunction and the role the inflammasome plays in this (15), we focused on NLRP3 and measured protein expression for this gene and the inflammasome-related proteins caspase-1 and ASC by Western blot analysis. Paired protein samples were available for 9/15 subcutaneous and 11/15 omental paired adipose samples from the original cohort. NLRP3 was significantly increased in omental adipose following gastric bypass (fold change: 1.7; P = 0.02; Figure 5) but not in subcutaneous adipose. The other inflammasome proteins did not show significant changes in expression.
Correlations between mRNA, miRNA, protein, and clinical variables
Correlations (significance threshold: P < 0.05, R > 0.6) between miRNA, mRNA (RT-qPCR data), protein, and clinical variables were investigated using Spearman correlation analyses in each tissue at each time point. Data for all variables were available for 9/15 subcutaneous and 11/15 omental paired adipose samples from the original cohort.
miR-223
In subcutaneous adipose before surgery, miR-223-5p expression correlated strongly with glucose (R = 0.90, P = 0.001), insulin (R = 0.83, P = 0.006), and HbA1c (R = 0.71, P = 0.03), while miR-223-3p expression correlated with glucose (R = 0.74, P = 0.02) and weight (R = 0.68, P = 0.04; Figure 6A). Following gastric bypass, positive correlations between miR-223-5p and high-density lipoprotein (HDL) (R = 0.86, P = 0.006) and GLUT4 RNA (R = −0.7, P = 0.03) as well as between miR-223-3p and miR-23a-5p (R = 0.9, P = 0.002) (Figure 6B) were observed.
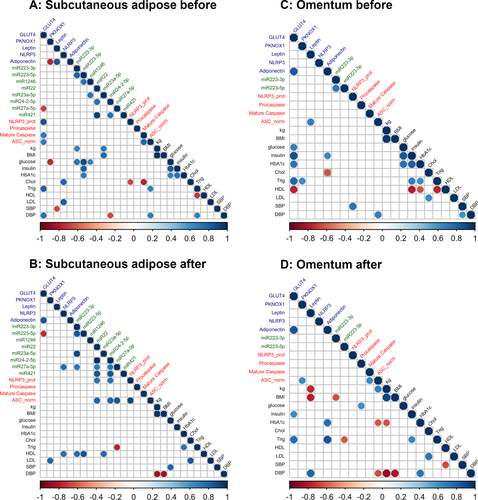
In omentum following gastric bypass, there was a significant negative correlation between miR-223-3p and BMI (R = −0.64, P = 0.03; Figure 6D).
Inflammasome
At baseline, NLRP3 mRNA correlated positively with blood lipid concentrations (low-density lipoprotein: R = 0.79, P = 0.001; cholesterol: R = 0.79, P = 0.01), while NLRP3 protein expression correlated positively with GLUT4 RNA levels (R = 0.87, P = 0.002) but negatively with cholesterol (R = −0.66, P = 0.05) in subcutaneous adipose tissue (Figure 6A). Similarly, there were strong positive correlations between protein levels of the inflammasome components ASC and mature caspase-1 with GLUT4 RNA levels (R = 0.7, P = 0.04 and R = 0.73, P = 0.03, respectively) and a negative correlation between mature caspase-1 and cholesterol (R = −0.76, P = 0.02). There were also positive correlations between ASC and triglycerides and diastolic blood pressure (R = 0.68, P = 0.04 and R = 0.70, P = 0.04, respectively; Figure 6A).
After weight loss, NLRP3 mRNA levels in subcutaneous adipose tissue showed positive correlations with miR-27a-5p (R = 0.76, P = 0.02) and HDL (R = 0.75, P = 0.03), and NLRP3 protein levels showed positive correlations with ASC (R = 0.9, P = 0.002), miR-22 (R = 0.74, P = 0.04), and miR-24-2-5p (R = 0.74, P = 0.04; Figure 6B).
In omentum at baseline, NLRP3 protein levels correlated significantly with systolic blood pressure (R = 0.75, P = 0.008), and, as seen in subcutaneous adipose tissue, ASC protein levels correlated with diastolic blood pressure (R = 0.69, P = 0.02; Figure 6C). After weight loss, positive correlations were observed between ASC and mature caspase-1 (R = 0.64, P = 0.03), pro-caspase-1 and glucose (R = 0.62, P = 0.04), and ASC and weight (R = 0.68, P = 0.02), while ASC correlated negatively with HbA1c (R = −0.61, P = 0.05; Figure 6D).
Metabolic regulation
In subcutaneous adipose tissue, blood glucose correlated negatively with PNKOX1 expression (R = −0.75, P = 0.02) and positively with miR-1246 (R = 0.66, P = 0.05) before gastric bypass (Figure 6A).
At baseline in omentum, GLUT4 RNA levels correlated positively with glucose, insulin, HbA1c, triglycerides, and ADIPOQ mRNA (R ≥ 0.68, P ≤ 0.02) and negatively with HDL (R = −0.77, P = 0.006; Figure 6C). After gastric bypass, significant correlations between GLUT4 mRNA and insulin, triglycerides, and ADIPOQ RNA were retained (R = 0.62 and P = 0.04, R = 0.79 and P = 0.003, and R = 0.85 and P = 0.0008, respectively) but not for glucose (R = 0.74, P = 0.02) and weight (R = 0.68, P = 0.04; Figure 6D).
Following gastric bypass, there was a negative association between LEP mRNA levels and BMI and weight in omental adipose only (R = −0.78, P = 0.005 and R = −0.74, P = 0.009, respectively; Figure 6D). ADIPOQ mRNA levels in omental adipose positively correlated with HbA1c and triglycerides (R = 0.76, P = 0.007 and R = 0.84, P = 0.001, respectively; Figure 6D), whereas before gastric bypass, there was a positive correlation with insulin (R = 0.64, P = 0.03) and a negative correlation with cholesterol (R = −0.63, P = 0.03; Figure 6C).
DNA methylation of miR-223 and NLRP3
DNA methylation is involved in gene regulation, and we previously observed significant hypomethylation of NLRP3 in subcutaneous adipose following gastric bypass (26). We investigated DNA methylation of NLRP3 and miR-223 in more detail. Pyrosequencing of these two loci in paired samples from both adipose tissues (n = 15) was performed. Three NLRP3 CpGs were analyzed (hg19:Chr1: CpGs at 247611816, 247611829, and 247611842 [cg18126557]). We observed significant hypermethylation (paired t test) before gastric bypass in both omental (mean methylation change across three CpGs: 12.7%, P = 6 × 10⁻⁵) and subcutaneous (mean methylation change across three CpGs: 17.5%: P = 3.8 × 10⁻⁹) adipose.
We investigated a region upstream and another downstream from the miR-223 transcriptional start site (upstream: hg19:ChrX: 65238507 [−205], 65238616 [−86]; downstream: hg19:ChrX:65238732 [+21], 65238737 [+26]). We observed significant hypermethylation after gastric bypass compared with baseline. The upstream region mean methylation difference was 9.7% and 10.6% in omental (P = 0.0003) and subcutaneous (P = 4.6 × 10⁻⁶) adipose, respectively; the downstream region showed a 9% and 8.4% methylation difference in omental (P = 0.0002) and subcutaneous adipose (P = 1 × 10⁻⁵), respectively.
The analysis also revealed a single-nucleotide polymorphism (rs186354597) in miR-223 in 1/15 individuals. To date, this is a rare variant with an allele frequency of 0.003 (gnomAD, gnomad.broadinstitute.org).
Discussion
We evaluated miRNA levels in subcutaneous and, to the best of our knowledge for the first time, in omental adipose tissue before and after gastric bypass and associated weight loss. We identified 13 miRNAs downregulated following surgery, and we technically validated 7 of these using RT-qPCR. Eleven have been linked to obesity, while two (miR-421, miR-3178) have not. miR-23a-5p, miR-27a-5p, miR-22-3p, and miR-223-3p have been reported as upregulated in subcutaneous adipose tissue in obesity, suggesting that we may be observing a return to “baseline” expression levels after weight loss. Roles in adipogenesis and adipogenic differentiation have been reported for miR-200c-3p (27), miR-1246 (28), and miR-128-3p (29). This may reflect tissue remodeling of the subcutaneous adipose depot in line with the weight loss observed after gastric bypass. Omental adipose expression of miR-223-3p was shown to be increased in obesity (30); in line with this, we observed decreased miR-223-3p in omental adipose after gastric bypass and weight loss.
Two previous studies have reported miRNA expression in subcutaneous adipose tissue before and after bariatric surgery (12, 13). Fifty-eight miRNAs were downregulated post surgery, using RNA sequencing analysis in unpaired samples (n = 10 each time point) (12). In line with our observations, miR-223-3p was downregulated (12). However, caveats of comparing our findings with those of the RNA sequencing analysis are that they used unpaired samples and did not specify the bariatric surgery procedure. Different bariatric procedures result in different outcomes (31), which could affect the observed results. Nardelli et al. (13) profiled 377 miRNAs before and after laparoscopic banding in paired samples from three individuals, reporting significant differential expression of six miRNAs. Five out of six of these were on the Affymetrix array, but we did not observe significant differential expression of them. Again, comparison between studies is limited by the significantly different bariatric procedures used; it may be that some of the inconsistencies between the studies point to molecular differences underpinning the outcomes of the surgeries. They may also reflect the manner of postoperative tissue collection, which, in our case, was predicated by a second operation (see Methods), a factor that may have confounded our observations. Furthermore, these studies cannot differentiate between effects that result directly from the surgical procedure or from the weight loss.
We chose to concentrate further analyses on miR-223-3p because this was the only miRNA for which we observed significant differential expression in both adipose tissues, and downregulation in subcutaneous adipose after weight loss (12) and its known role in immune regulation (32) have previously been reported. We observed differential mRNA expression of two out of three previously validated targets of miR-223-3p, GLUT4 and NLRP3. When we explored the levels of miR-223-3p, its antisense miR-223-5p, and these mRNA, we did not observe strong correlations between miRNA and target mRNA (Figures 3 and 4), except for miR-223-5p and GLUT4 RNA, which showed a strong negative correlation post surgery and weight loss (R = −0.7, P = 0.03; Figures 3 and 6). miRNA regulation of mRNA is complex, with multiple miRNAs potentially targeting a given mRNA; for instance, 105 and 45 miRNAs are predicted to target GLUT4 and NLRP3, respectively (miRDB, http://www.mirdb.org/, accessed September 28, 2019) (33).
We also observed strong correlations in subcutaneous adipose after gastric bypass and weight loss between miR-27a-5p and GLUT4 and NLRP3 mRNA and between NLRP3 protein levels and miR-22 and miR-24-2-5p (Figure 6). miR-27a-5p has not been implicated in the regulation of NLRP3 to date, but miR-27a was reported to play a role in insulin resistance by regulating GLUT4 signaling along with miR-106b and miR-30d (34); a single-nucleotide polymorphism in the pre-27a miRNA is reported to be associated with T2D (35, 36).
Given the role of inflammation in metabolic dysfunction, we were particularly interested in exploring the obesity-associated inflammasome NLRP3 (15) as an experimentally validated target of miR-223-3p (37). We observed relative hypomethylation of NLRP3 and less mRNA expression post surgery; this contradicts the traditional paradigm that hypermethylation results in decreased gene expression. However, this relationship is most commonly observed when promoter regions are hypermethylated. Here, differential methylation is within the gene body, a phenomena that has more recently been observed to coincide with less expression and/or alternative splicing (38).
Upregulation of NLRP3 in both adipose tissues in obesity has been reported (15), and increased expression was seen in patients with obesity and metabolic syndrome compared with obesity alone (39). Decreased NLRP3 was reported in subcutaneous adipose after calorie restriction- and exercise-induced weight loss (40), whereas no change was observed in subcutaneous or omental expression following gastric banding–induced weight loss (41). Direct comparisons across studies are complicated by the different weight loss methods; procedures that substantially alter small intestinal nutrient delivery (e.g., gastric bypass) improve T2D significantly more than those that only restrict nutrient intake (e.g., gastric banding) (31).
In line with the gastric banding study, we observed no change in NLRP3 in subcutaneous adipose after gastric bypass and weight loss. However, we did observe a significant increase in protein levels in omental adipose following surgery. The changes in expression may reflect the relationship between miR-223-3p and NLRP3. miRNAs function by binding to their mRNA targets and either sequestering the mRNA and preventing its translation to protein or by targeting the mRNA for degradation. We observed decreased miR-223-3p expression and increased NLRP3 protein following weight loss. One possibility is that the decrease in NLRP3 mRNA could be driven by increased turnover of mRNA to protein, such that miR-223-3p sequesters NLRP3 mRNA rather than degrading it. miR-223-3p is highly expressed in immune cells; therefore, another possibility is that decreased adipose inflammation postoperatively would result in less immune cells and thus less miR-223-3p available to regulate NLRP3 expression. Tissue samples were not available for histological analyses to investigate this further.
NLRP3 protein expression increased in omental adipose post surgery, but associated proteins ASC and mature caspase-1 did not. While an increase in NLRP3 might suggest increased inflammasome activity, knockout animal studies have found that loss of any one of the inflammasome proteins (NLRP3, ASC, caspase-1, or IL-1β) results in nonfunctional inflammasome complexes, impaired inflammasome signaling, and reduced susceptibility to diet-induced obesity and metabolic dysfunction, particularly insulin resistance (15, 42). When we explored correlations between miRNA, mRNA, protein, and clinical measures (Figure 6), we observed that ASC correlated negatively and pro-caspase-1 positively with HbA1c and blood glucose, respectively, following weight loss, suggesting a possible link between blood glucose levels and reduced inflammasome machinery. Thus, despite the increase in NLRP3 protein, the absence of increased expression of ASC and caspase-1 protein would result in reduced inflammasome signaling and IL-1β and IL-18 production following gastric bypass–induced weight loss. IL-1β and IL-18 have been implicated in the development of metabolic dysfunction (41-43), and inhibition of these cytokines through reduced inflammasome complex formation could, in part, explain the effectiveness of gastric bypass surgery in reducing metabolic dysfunction.
In conclusion, to the best of our knowledge, this is the first report detailing miRNA profiling of omental adipose before and after gastric bypass. We observed significant downregulation of miR-223-3p and miR-223-5p levels in both omental and subcutaneous adipose tissues following gastric bypass and associated weight loss. We also report significant changes in NLRP3 and in omental tissue before and after gastric bypass as well as correlations between the protein levels of inflammasome proteins ASC and caspase-1 and HbA1c and blood glucose, respectively, in omentum post weight loss. These results further highlight a role for miR-223-3p and the NLRP3 inflammasome in obesity.
Acknowledgments
We gratefully acknowledge the expertise of Institute of Environmental Science and Research (ESR) staff Susan Lin and Paula Scholes, who performed the mRNA RT-qPCR analyses.
Funding agencies
The project was supported by ESR core funding; a pilot grant from the National Center for Medical Rehabilitation Research at Children’s National Medical Centre (5R24HD050846-08): NCMRR-DC Core Molecular and Functional Outcome Measures in Rehabilitation Medicine; Research for Life (Wellington Medical Research Foundation); and the US National Institutes of Health under grant R01AA018776.
Disclosure
The authors declare no conflict of interest.


