Numerical Study on the Thermo-Hydro-Mechanical Behavior of Energy Micropiles in Hypoplastic Soft Clay Under Cyclic Thermal Loading
ABSTRACT
Coupled nonlinear thermo-hydro-mechanical finite element simulations were carried out to investigate the behavior of energy micropiles subjected to thermal loading cycles. Two kinds of problems were analyzed: The case of an isolated micropile, for which comparison with previous research on medium-size isolated energy pile is provided, and the case of large groups of micropiles, with the aim of investigating the interaction effects. In both problems, micropiles were considered installed in a thick layer of very soft, saturated clay, characterized by isotropic or anisotropic hydraulic conductivity. Two advanced existing hypoplastic models, one incorporating the thermal softening feature, were used to describe the clay behavior in both problems. The settlements of the micropile head were found to increase during thermal cycles under constant mechanical load, showing a sort of ratcheting. For micropile groups, the settlement increase rate was faster as the spacing between micropiles was reduced. The excess pore water pressures developed at the micropile-soil interface played a significant role on the deformation and displacement fields of the soil-micropile systems, especially in the case of micropile groups, affecting the shear strength developed at the micropile-soil interface. The consolidation process was faster when the hydraulic conductivity was anisotropic, meaning that the development of excess pore water pressure was reduced in this case. As the spacing between the micropiles increased, i.e., as thermal interaction decreased, the heat flux exchanged by a micropile of the group during one cycle approached the heat flux exchanged by an isolated micropile in the same period.
1 Introduction
In foundation engineering, the term micropile is used to indicate bored piles of small diameter (not larger than 0.3 m) and relatively short length (up to 15 m), drilled with sufficiently small size rigs and used in close proximity of existing buildings or even inside them. These features make micropiles ideally suited for the retrofitting of existing structures needing to be upgraded to meet more stringent safety requirements—i.e., with respect to seismic loading conditions—or to restore buildings which may have experienced large absolute and differential settlements.
Recently, it has been suggested that micropiles can also be used as heat exchangers for geothermal heat pumps in heating, ventilation, and air conditioning (HVAC) systems [1-7], as it happens for other kinds of energy geostructures—i.e., structures that, in contact with the soil, also serve for the purpose of heat exchange [8]. Existing studies on the performance of energy micropiles focused either: (i) on the thermal problem, to investigate how different aspects of the heat exchanger system (e.g., micropile length and diameter, thermal conductivity of the material constituting the pile, velocity of the heat-carrier fluid, among other factors) affect the heat exchange process between the micropile and the surrounding soil, see, e.g., Ronchi et al. [2], Cecinato and Salciarini [5], Ciardi et al. [6, 9]; or, (ii) on the effects that the changes in micropile temperature may have on the stress and strain distributions in the micropile [3, 4]. From a geotechnical point of view, two main issues emerge from all previous numerical studies dealing with energy micropiles: (i) first, the lack of a proper description of soil behavior, that quite often has been described by simple constitutive laws such as linear thermo-elasticity, neglecting the thermo-mechanical coupling effects, or, at most, just considering thermal expansion/contraction; (ii) second, the focus on an isolated energy micropile, neglecting the thermo-mechanical interaction among adjacent micropiles deriving from possible group effects.
As for the first issue, it is well known that, in fine-grained soils, changes in temperature may give rise to thermo-mechanical coupling effects which go far beyond the volumetric thermal expansion/contraction. Generally speaking, the effects of temperature variations in fine-grained soils include the development of thermally-induced volumetric plastic strains under monotonic and cyclic loading conditions, as well as the modification in size and shape of the domain of admissible stress states, a phenomenon usually known as thermal hardening/softening [10-18]. Normally consolidated (NC) or slightly overconsolidated clay undergoes thermal contraction upon heating, while stiff clay tends to dilate upon heating [19, 20]. In soft soils, the development of excess pore water pressures may be larger than that caused by the difference in thermal expansion coefficients of the water and the solid grains, and can further be amplified when the temperature variation is cyclic [15, 19]—as it is expected, for instance, during the standard operation of energy geostructures. For conventional energy piles, the use of advanced constitutive models in fully coupled thermo-hydro-mechanical (THM) simulations for investigating the cyclic response of energy piles was reported, e.g., by Di Donna and Laloui [21], Iodice et al. [22, 23], while, to the authors' knowledge, similar investigations have not been still attempted for energy micropiles.
As for the second issue, it is well known that, in geotechnical engineering applications, micropiles are used in relatively large groups. In geothermal applications, this should allow to compensate for the limited heat exchange capacity of energy micropiles as compared to that of bigger and longer standard energy piles. In such conditions, however, it becomes essential to quantify the reduction in the thermal efficiency of the individual elements of the group caused by the presence of other thermally active elements working at a relatively close distance. Previous studies on this topic [3, 6] shed some light on this aspect for geothermal system design, addressing the heat transfer problem only, and further investigations are required.
In the present study an extensive series of axisymmetric, nonlinear, coupled THM finite element (FE) simulations was performed for an isolated energy micropile and for micropile groups embedded in saturated NC hypoplastic clay. The main goals of the present study are (i) investigating the effects of THM coupling on the micropile response over a number of thermal cycles representative of long-term operating conditions of geothermal heat pumps, i.e., evaluating the effects of thermally-induced strain and excess pore water pressure on micropile displacements, effective stress field in the surrounding soil and micropile bearing capacity; (ii) investigating possible scale effects, by comparing the response of an isolated micropile with that of an isolated medium-size energy pile under the same initial and boundary conditions, whose temperature response is discussed in a previous work by Iodice et al. [23]; (iii) evaluating the possible interference effects among adjacent energy micropiles, which may have a detrimental effect on the overall thermal efficiency of the heat exchanger system.
The study is divided into two parts, each addressing a distinct problem: The case of the isolated energy micropile (Problem 1) and the case of micropile groups (Problem 2). For Problem 1, the numerical model used was developed based on the one described in Iodice et al. [23]. The numerical models used for analyzing Problem 2—though extremely simplified and derived from those used for Problem 1—are aimed to capture the effects in the hypothetical case of a large micropiled group, assuming that the energy micropiles are arranged in a regular hexagonal array, and that the extension of the group in both the horizontal directions is much larger than the size of the hexagonal unit cell, as in Ciardi et al. [6]. The presence of the raft is neglected in this study, in order to highlight the main features, from a geotechnical point of view, of the THM coupled problem analyzed for energy micropiles. In both the considered problems, advanced hypoplastic models were used, as in Iodice et al. [23]. The simulations were performed adopting two different models: The hypoplastic model for clays presented in Mašín [24] and Mašín [25]—referred to in the following as “Hypo model”—in which the thermo-mechanical coupling is limited to the thermal expansion/contraction of the solid skeleton, and the recent thermo-hypoplastic model proposed by Ma et al. [26]—referred to in the following as “Hypo–T model”. In addition to the thermal expansion/contraction effects, the Hypo–T model incorporates an explicit dependence of the main constitutive functions on temperature, allowing the description of the thermal softening effects and of the accumulation of irreversible volumetric strains upon thermal loading cycles. As the Hypo–T model is a hierarchical evolution of the Hypo model, this choice allowed to evaluate the effects of the experimentally observed features of clay behavior in non-isothermal conditions on the mechanical performance of the energy micropile.
1.1 Notation
In the following, the sign convention of solid mechanics (tension and expansion positive) is adopted throughout, except where otherwise stated. Both direct and index notations will be used to represent vector and tensor quantities according to convenience. In direct notation, vectors, second-order tensors and tensors of higher order will be represented by boldface italic characters. Following standard practice, for any two vectors , the dot product is defined as: , and the dyadic product as: . Accordingly, for any two second-order tensors , and . The quantity denotes the Euclidean norm of the second-order tensor . The quantity denotes the positive part of the scalar function . The second-order identity tensor is denoted with the symbol , with components . The fourth-order identity tensor is denoted with the symbol , with components .
2 Problems Description
2.1 Geometry
The numerical models used in this study for analyzing Problem 1 (isolated micropile) and 2 (micropile groups) are built upon the numerical model reported in Iodice et al. [23] (also discussed in Iodice et al. [22]) for an isolated medium-size energy pile floating in saturated NC clay. The numerical model described in Iodice et al. [23] is an axisymmetric model of a single pile of diameter = 0.5 m and length = 25 m. The dimensions of the numerical domain are width = 50 m and height = 50 m. In this study, in Problem 1, an axisymmetric model of a single energy micropile of diameter = 0.2 m and length = 12 embedded in a homogeneous saturated NC clay layer of dimensions = 50 m was built. Figure 1a—not to scale—represents the micropile and soil domain geometry in a vertical plane containing the axis of the micropile.
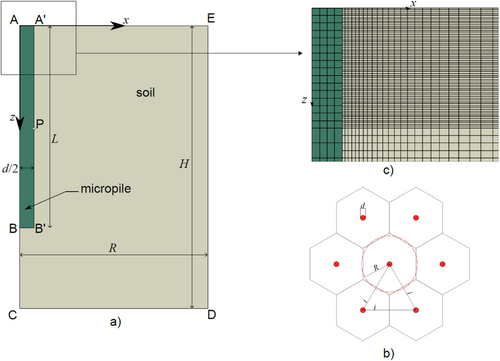
The numerical models used for Problem 2 are similar to the one employed for Problem 1, the only difference being the value of the outer radius , which now is proportional to the micropile spacing. A large number of identical energy micropiles ( = 0.2 m, = 12 m) are assumed to be installed in the same NC clay subsoil used for Problem 1, in a regular, hexagonal array layout, as shown in Figure 1b. The idealized conditions assumed for Problem 2 allow to concentrate the study on a single, hexagonal periodic cell with the energy micropile placed at its center. The distance between the micropile and the sides of the hexagon is equal to , where is the micropile spacing. In such conditions, it is possible to approximate the geometry of the elementary cell with a circular cylinder of external diameter : this relation is derived by enforcing the equality between the circular and hexagonal areas, see Figure 1b. The axisymmetric approximation has been validated, for the smaller value of adopted, by comparing the results obtained from the axisymmetric model with those of a full 3D model of the true hexagonal unit cell. The comparison showed that the results were practically coincident for all the unknown fields, but the simulation times could be reduced by a factor of 10 going from the 3D model to the corresponding axisymmetric one.
Two cases were analyzed, with the lateral boundary of the domain placed at a distance = 2 m or = 4 m from the micropile axis. The situation considered in this problem represents, in a very simplified way, the case of a large micropiled raft foundation, of dimensions much larger than the pile spacing [6].
In all models, the interface between the pile and the soil was assumed as purely frictional, with a friction angle equal to the critical friction angle of the soil. A unilateral contact condition was adopted for the normal interactions between the pile and the soil, so no tensile stresses can be transmitted. It is worth noting that Iodice et al. [23] assumed perfect adhesion between the pile and the soil at the soil-pile interface. Thermal conductance between contacting surfaces was ensured introducing the gap conductance as an additional property of the interface to enable heat transfer between the micropile and the surrounding soil.
2.2 Governing Equations
Equation (1a) is the balance of linear momentum for quasi-static deformation processes. In this equation, is the total stress tensor; is the gravity force per unit mass, while is the mass per unit volume of the saturated soil, determined from the densities and of the solid and liquid phases, respectively, and from the soil porosity . Equation (1b) is the balance of mass of the porous medium, in which is the Darcy's seepage velocity and is the volumetric thermal expansion coefficient of the porous medium, determined from the volumetric thermal expansion coefficients and of the solid and liquid phases, respectively. Finally, Equation (1c) is the enthalpy balance equation of the porous medium, in which is the heat flux vector and is the effective heat capacity of the porous medium, determined from the heat capacities and of the solid and liquid phases, respectively.
2.3 Constitutive Equations
In order to close the problem, the governing equations (1) should be integrated with the appropriate constitutive equations providing information on the mechanical, hydraulic, and thermal behavior of the porous medium.
| (kN/) | (m/s) | (m/s) | () | () | (W/m/) | (J/kg/) |
|---|---|---|---|---|---|---|
| 20 | 1.0e–10 | Variable | 4.5e–5 | 1.5e–4 | 1.5 | 1000 |
| (kN/) | (GPa) | (–) | () | (W/m/) | (J/kg/) |
|---|---|---|---|---|---|
| 25 | 30 | 0.2 | 2.55e–5 | 2 | 1200 |
The sets of material constants characterizing the two hypoplastic models are listed in Table 3. In the table, the constants of Group I define the soil behavior under monotonic loading conditions and are sufficient for the Hypo model in its basic version not including intergranular strains; the constants of Group II define the role played by the intergranular strain in controlling the cyclic response of the soil and its evolution with accumulated strains; finally, the constants of Group III control the thermo-mechanical coupling effects in the Hypo–T model, and therefore play no role in the standard Hypo model. Table 3 also provides the values of the material constants adopted for the two models. These were chosen equal to those calibrated by Iodice et al. [23] on London Clay, in order to make meaningful the comparison between the results obtained in the present study and those obtained by Iodice et al. [23] on a medium-size energy pile.
| Group | Constant | Hypo | Hypo–T | |
|---|---|---|---|---|
| I | () | 21.9 | 21.9 | |
| (–) | 0.23 | 0.23 | ||
| (–) | 0.10 | 0.10 | ||
| (–) | 0.02 | 0.02 | ||
| (–) | 1.26 | 1.26 | ||
| (kPa) | 1.0 | 1.0 | ||
| II | (–) | 5e–5 | 5e–5 | |
| (–) | 400 | 400 | ||
| (–) | 0.76 | 0.76 | ||
| (–) | 0.08 | 0.08 | ||
| (–) | 0.90 | 0.90 | ||
| (–) | 0.50 | 0.50 | ||
| (–) | 10 | 10 | ||
| III | (–) | n.a. | −0.009 | |
| (–) | n.a. | 0.0 | ||
| (–) | n.a. | 0.025 | ||
| (–) | n.a. | 0.45 | ||
| (–) | n.a. | 0.10 | ||
| () | n.a. | 15.0 | ||
2.4 Boundary and Initial Conditions
Boundary and initial conditions are required to solve the THM problem described in Section 2.2. These conditions, for Problem 1, are equal to those assumed for the medium-size energy pile by Iodice et al. [23]; for Problem 2, identical mechanical boundary and initial conditions were assumed, while different hydraulic and thermal boundary conditions were assumed just for the lateral side of the domain, as detailed below.
As for the mechanical boundary conditions of both analyzed Problems, with reference to Figure 1a, the radial component of the displacement, , was fixed, and the vertical component of the stress vector, , was zero on the axis of symmetry (line ABC). At the bottom of the clay layer (surface CD), the stratigraphic contact was assumed as perfectly rigid and rough (displacement vector ). The same conditions of the axis of symmetry were assumed on the fictitious vertical boundary DE at distance from the pile axis, where it is supposed that the radial displacement are zero and the vertical and radial directions are principal directions of . On the ground surface (surface ), the traction vector was zero, while on the pile head (surface ) , where is the axial load applied at the pile head (see Section 2.5) and is the area of the pile section, and .
The hydraulic boundary conditions of Problem 1 were assigned as follows. The axis of symmetry ABC was assumed as impervious. The same was done for the lateral surface and the base of the pile. The hydraulic head at the stratigraphic contact CD was assumed constant and equal to its initial hydrostatic value. The same condition was adopted for the vertical boundary ED and for the ground surface . For Problem 2, all hydraulic boundary conditions were identical except at side DE, assumed impervious due to symmetry.
Finally, the thermal boundary conditions of Problem 1 were assigned as follows. Zero heat flux was assumed at the axis of symmetry ABC. On the stratigraphic contact CD, on the vertical boundary ED, and on the ground surface , the temperature was assumed constant and equal to its initial value, . At all pile surfaces (top, bottom, and lateral), the temperature history was assigned as indicated in Section 2.5. For Problem 2, all thermal boundary conditions are identical except at side DE, assumed adiabatic due to symmetry.
As for the initial conditions for both Problems 1 and 2, the pore pressure distribution was assumed to be hydrostatic, with the piezometric surface at the ground surface, and the initial temperature was assumed constant and equal to = 15 in the entire domain. The initial stress distribution was geostatic, with a constant equal to 0.63.
2.5 Loading Conditions
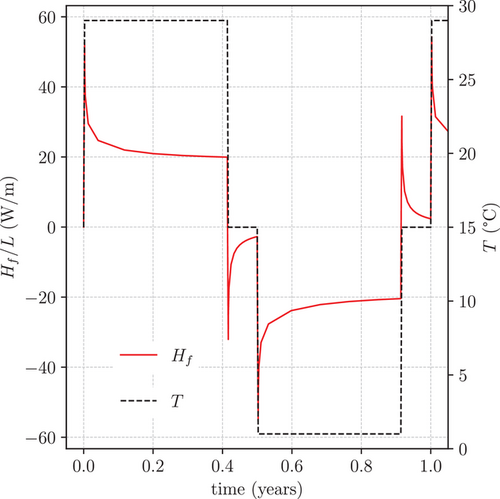
The loading conditions include both mechanical and thermal loads. In the first stage of the simulations, performed in isothermal and drained conditions, the pile was subjected to a monotonically increasing axial load at the pile head. The magnitude of the mechanical load was chosen to represent a typical operating condition for the micropile, conventionally chosen as 30% of the bearing capacity, , of the micropile. In order to have a rough estimate of the micropile bearing capacity, a preliminary isothermal and fully drained simulation of an axial load test, under pile head displacement control, was performed with the geometric configuration of Problem 1. The micropile axial bearing capacity obtained was 135 kN, assuming as failure condition an axial displacement of the pile head equal to 10% of the pile diameter . In the subsequent simulation stages, the axial load at the pile head was kept constant, while the micropile was subjected to heating-cooling cycles of given amplitude and period of 1 year. The temperature time history used in simulations (see Figure 2) matches, in shape and magnitude, those histories used in research dealing with energy piles and energy micropiles subjected to several thermal cycles [6, 22, 23]. At the beginning of each cycle, . The first half-cycle consists of a 5 months long heating period at constant temperature = 29 , followed by a 1 month long rest period at constant temperature . The remaining part of the cycle consists of a 5 months long cooling period at constant temperature = 1 , followed again by a 1-month long rest period at constant temperature . Between the heating, rest, and cooling phases, the temperature of the micropile's body was increased or decreased linearly over a 1-day duration ramp.
3 FE Simulations
A series of coupled nonlinear THM FE simulations was performed to solve both Problems 1 and 2 by means of the code Abaqus Standard v.2020 [30]. The micropile was discretized with 512 quadrilateral CAX4T elements with bilinear interpolation for both displacements and temperature. The soil was modeled as a water-saturated porous medium, discretized with CAX4PT quadrilateral elements with bilinear interpolation for displacements, pore pressure, and temperature. The soil spatial discretization was refined as the distance was reduced. For Problem 1, 8838 CAX4PT elements were employed, while in Problem 2 the discretizations adopted for = 2 m and = 4 m contained 28,614 or 58,446 CAX4PT elements, respectively. As an example, a magnified view of the discretization adopted for Problem 2, with = 2 m, is shown in Figure 1c. The complete program of numerical simulations performed in this study is detailed in Table 4. Six THM simulations were run. Simulations 1–4 refer to Problem 1 while simulations 5 and 6 refer to Problem 2. Simulations 1 and 2 were designed in order to be directly comparable to the simulations performed by Iodice et al. [23]. Simulations 3 and 4 aimed at investigating the effects of a possible anisotropy in soil permeability, assuming that the permeability is transversely isotropic about the axis, with an horizontal permeability two orders of magnitude larger than the vertical one. In the simulations referring to Problem 2, only the Hypo–T model was used for the clay layer.
| Simulation | Soil model | ||
|---|---|---|---|
| # | (–) | (m) | |
| 1 | Hypo | 1 | 50 |
| 2 | Hypo-T | 1 | 50 |
| 3 | Hypo | 100 | 50 |
| 4 | Hypo-T | 100 | 50 |
| 5 | Hypo-T | 1 | 2 |
| 6 | Hypo-T | 1 | 4 |
4 Results and Discussion
4.1 Problem 1
4.1.1 Thermal Performance
The evolution with time of the heat flux normalized by the micropile length during the first thermal cycle is shown in Figure 2. The plot also shows the periodic thermal boundary condition used in simulations (see Section 2.5). The main variations of the normalized follow the time history of the pile temperature: The heat flux changes very rapidly during the temperature ramps, to reach a maximum (or minimum, depending on the sign of ) at the beginning of the heating, cooling, and rest periods at constant temperature. During these stages, a transient heat flow process is observed, with the flux progressively decreasing (respectively, increasing) with time. This transient process is due to the progressive reduction with time of the temperature gradient (and thus of ) at the soil-micropile interface, as the temperature of the soil surrounding the pile progressively increases (respectively, decreases). Similar results are described, e.g., in Ciardi et al. [6].
The evolution of the heat flux with time for the isolated micropile over the first five cycles (0 5 years) is reported in Figure 3 (continuous lines), in terms of , where . It is worth noting that, in each cycle, the heat flux follows exactly the same pattern of the first cycle, and, therefore, that the thermal performance of the isolated micropile is periodic, with the same period of the temperature boundary conditions.
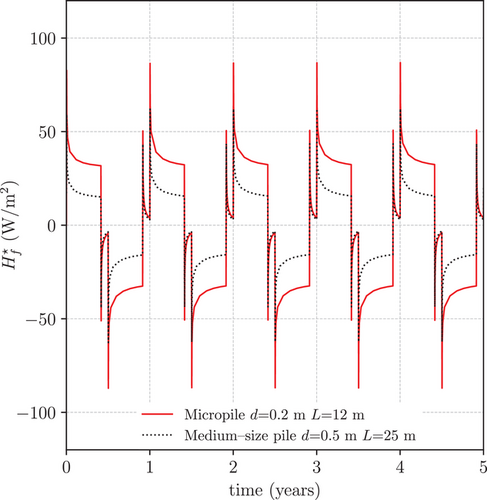
For comparing the thermal response of the energy micropile with that of the medium-size pile, an additional, purely heat transfer FE simulation—solving Equation (1c) with its thermal initial and boundary conditions—was carried out on a pile-soil system identical to that considered by Iodice et al. [23] ( = 0.5 m, = 25 m), with a total simulation time of 5 years (5 cycles), because these data are not available in that study. The results obtained for the single medium-size pile in terms of are superimposed to those of the single energy micropile in Figure 3 (dotted lines). It is shown that the heat flux per unit lateral surface was greater for the micropile than for the medium-size pile. This means that the thermal performance of the isolated micropile is comparable to the thermal performance of the isolated medium-size energy pile under the same input temperature, or even better in the specific case. Therefore, it appears possible to compensate the reduced surface area of the individual energy micropile with the larger number of micropiles typically adopted in foundations using this type of deep foundations. However, it is worth noting that this observation holds true provided that only limited or no thermal interaction occurs among neighboring energy piles see, e.g., [3, 6]. This possibility is explored with the simulations of Problem 2 in Section 4.2.
4.1.2 Hydro–Mechanical Behavior
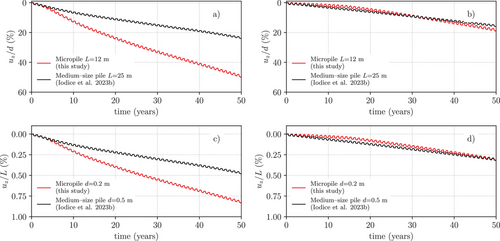
The time histories of the vertical displacement, , at the head of the micropile, computed for 50 thermal cycles with the Hypo–T or with the Hypo model, are shown in Figure 4a,b, respectively. In the same figures, the trends of the medium-size pile are also reported for comparison. The results obtained with the two hypoplastic models on the single micropile show that thermal expansion/contraction alone cannot account for all the thermo–hydro-mechanical coupling effects that control the pile head displacement. The prediction obtained with the Hypo–T model (Simulation 2) differs from the one of the Hypo model (Simulation 1) both in the final value of the accumulated vertical displacement at = 50 y (100 vs. 40 mm) and in the evolution of with time. In Simulation 2 (Figure 4a), the thermal volumetric collapse activated by the thermo-mechanical coupling mechanisms present in the Hypo–T model—mainly the dependence on temperature of the position of the Virgin Compression Line and the presence of the thermo-mechanical coupling term (see Appendix A)—is responsible for the high average settlement rates observed in the initial 10 years of operation. As this effect reduces with increasing number of cycles, the settlement rate reduces with time until it reaches a constant value in the last part of the simulation, with 30 years 50 years. The opposite occurs in Simulation 1 (Figure 4b), where the initially low average settlement rate start to increase after about 10 years of operation, to reach its maximum in the last part of the simulation. Both simulations reach an almost constant average settlement rate in the last 20 cycles, but the one predicted by the Hypo–T model (1.75 mm/year) is substantially larger than the one obtained with the Hypo model (1.0 mm/year). The comparisons of the two micropile simulations with the results of the medium-size isolated energy pile show that similar results are obtained in terms of pile head settlements history (with the maximum difference in not exceeding 20 mm) when the soil is modeled with the Hypo–T model. On the contrary, large differences are observed when the standard Hypo model was adopted.
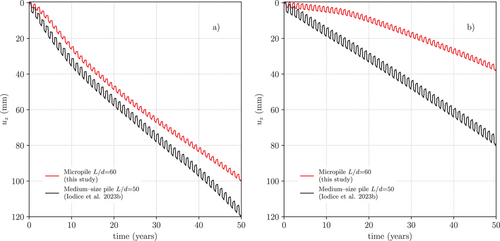
Figure 5 shows the same data of Figure 4 in terms of the normalized settlement ratios (Figure 5a,b) and (Figure 5c,d), noting that the slenderness ratios, , of the micropile and of the medium-size pile are not so different, providing a more meaningful comparison between the two different energy geostructures. When expressed in terms of ratio, the results obtained with the Hypo model for the two piles of different diameter appear very similar to each other (Figure 5b). This suggests that, when the only thermo-mechanical coupling effect considered is the thermal expansion/contraction of the soil and pile material, the mechanical performance of the energy pile and micropile can be scaled by their dimensions. On the contrary, when the Hypo–T model is used (Figure 5a), the cyclic performance of the micropile is much worse than that of the medium-size pile, since the pile head settlement of the micropile reaches an unacceptably high final value of about 50% of the pile diameter, while the maximum normalized settlement for the larger pile is 23%. Because the slenderness ratios of the micropile and of the pile are similar, similar trends are obtained when the displacements are normalized by or by . Therefore, the discussion about Figure 5a,b can be easily extended to Figure 5c,d.
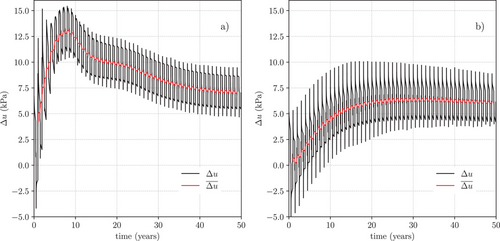
The time evolution of the excess pore pressure computed with both Hypo and Hypo–T models at a point P (at = /2 and = /2), located on the soil-micropile interface at micropile mid-height (see Figure 1), is shown in Figure 6. Data on the pore pressure evolution at a point located on the soil-pile interface at pile mid-height are reported just for 5 years of simulation in Iodice et al. [23]. In that study, it is thus not possible to evaluate the long-term hydrodynamic effect. In the two plots of Figure 6, the red lines provide, for each simulation, the time evolution of a moving average of the excess pore pressure, computed with a time window of size , with = 1 year. The moving averages allow to identify the overall trend of the excess pore pressure by filtering the short-term oscillations associated with yearly variation of the thermal load on the micropile. This short-term oscillation is mainly produced by the different thermal expansion behavior of the solid skeleton and the pore water. The progressive accumulation of registered by the moving averages in the two simulations is related to the inelastic mechanical response of the solid skeleton, which reacts with positive excess pore pressure build-up to a cyclic variation of the total and effective stress states. It is worth noting that the effects of the THM coupling on the solid skeleton response are significantly different for the two simulations considered. In the simulation performed with the standard Hypo model, increased quite slowly with time, reaching a maximum of about 10% of the hydrostatic value at = 30 years, and then decreased very slowly afterwards. On the contrary, computed with the Hypo–T model rapidly increased in the first 10 years, reaching a much larger peak value (about 22% of ), and then decreased at a progressively reduced rate, which over the last 5 years of simulation approached the decrease rate observed in the simulation with the standard Hypo model. The reason for such marked difference between the two simulations is to be found in the thermo-mechanical coupling effects introduced in the Hypo–T model which are not present in the standard model. It then appears that the effects of such thermo-mechanical coupling in simulation 2 on excess pore pressure disappeared after about 45 years. For the sake of completeness, limited to the 5 years of simulation reported in the study of Iodice et al. [23], it is observed that the Hypo–T model predicts larger excess pore pressure than the Hypo model, with maximum of about 30 and 10 kPa, respectively. Due to the reduced time span, however, only an increasing excess pore water pressure rate is shown.
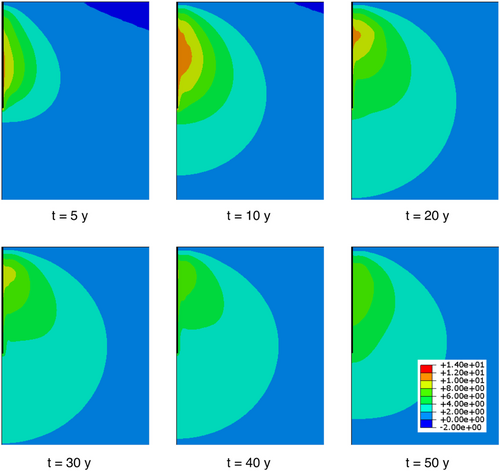
In the present study, an insight into the long-term hydrodynamic effects induced in the soil domain by the thermal cyclic loading can be obtained by examining the results in Figure 7, which shows the contour maps of excess pore water pressure at six different time stations (5, 10, 20, 30, 40, and 50 years, respectively) obtained in simulation 2, with the Hypo–T model. A process of progressive excess pore pressure build-up and dissipation was observed in the soil surrounding the micropile, confirming the trend observed for point P reported in Figure 6. Towards the end of the simulation ( = 50 years), the excess pore pressures did not appear to have reached a stationary state, for which a larger time span is probably necessary. A similar trend of excess pore pressure variation with time was obtained also for simulation 1, performed with the Hypo model.
The progressive excess pore pressure build-up and dissipation observed in simulations 1 and 2 over a very large number of thermal cycles is definitely a consequence of the low permeability of the clay soil. In order to investigate how the dynamics of the coupled consolidation process affects the overall response of the system in terms of and pile head settlements , two additional simulations were performed assuming that the clay permeability was transversely isotropic, with a ratio between the coefficient of permeability in the horizontal and in the vertical directions, , equal to 100. Permeability anisotropy of this kind is typically found in varved clays, for which Tavenas and Leroueil, [31] report values of as large as 10. In this study, the ratio was deliberately chosen to be unrealistically high (one-order of magnitude larger) to reduce to a minimum the duration of the pore pressure dissipation transients.
The excess pore pressures at point P computed in simulations 3 and 4 are compared with those of simulations 1 and 2 in Figure 8a,b. A striking result emerging from this Figure is that, in both simulations with anisotropic permeability, the magnitude of excess pore pressure at point P was very small—of the order of kPa—and no progressive accumulation of was observed. As expected, this result is due to the high value of adopted in simulations 3 and 4, and confirms the need of proper hydraulic conductivity characterization when addressing real cases of energy piles embedded in fine-grained soils.
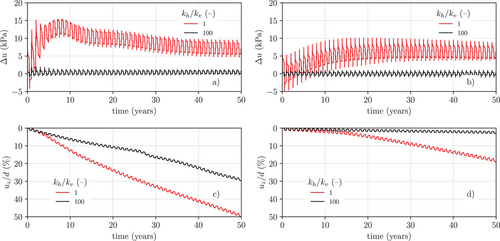
Finally, Figure 8c,d shows the results obtained in the reference simulations with isotropic permeability with those obtained with the anisotropic permeability in terms of normalized pile head displacement. For the simulations with the Hypo model (Figure 8d), when the excess pore pressure in the soil were negligible, the final pile head settlement reduced to a few millimeters, i.e., a small fraction of the final pile head settlement obtained in the case of isotropic permeability. Therefore, when the thermo-mechanical coupling is limited to the thermal expansion/contraction effects, the progressive accumulation of pile head settlements is to be attributed mainly to the transient water flow and soil deformation processes associated to the long-term pore pressure build-up and dissipation. When the Hypo–T model is used (Figure 8c), in the absence of a long-term consolidation process triggered by the thermal loading cycles (simulation 4, = 100), the pile head settlements accumulated over the time period considered are significantly lower than those computed in the corresponding reference case (simulation 2, = 1), with a 40% smaller final value of . Nonetheless, a progressive accumulation of settlements was clearly visible in this case, a consequence of the thermo-mechanical coupling mechanisms incorporated in the model formulation.
4.2 Problem 2
4.2.1 Thermal Performance
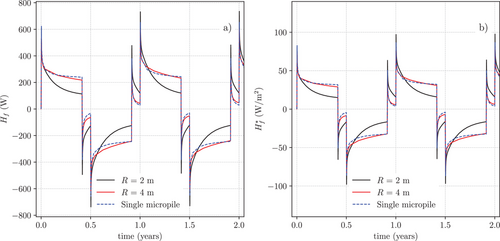
The thermal performance of the energy micropiles in group can be assessed by looking at the time evolution of the total heat flux of the micropile in the unit cell, and at the corresponding heat flux per unit area, , calculated as in Section 4.1.1 and shown in Figure 9.The results in the Figure refer to the first 2 years of operation, for both pile spacings considered. The figure also reports, for comparison purposes, the total and specific heat fluxes obtained in the case of the single isolated micropile. For the case of widely spaced micropiles ( = 4 m) the time evolution of and are almost coincident with those of the isolated micropile, indicating that the thermal performance of each pile of the group is not affected by the presence of the other active energy piles. On the contrary, when the radius of the periodic cell is reduced to 2 m, both and reduce with time at a much faster rate, resulting in significantly lower average values over the single thermal cycle. This is due to the interference between neighboring piles, which causes a faster heating/cooling of the soil surrounding each micropile, with a consequent reduction of the temperature gradient at the soil-micropile interface during both the heating and cooling stages of the cycle. The presence of thermal interference among energy micropiles, which are expected to be closely installed in practical applications, poses some concerns about the overall thermal performance of energy micropile systems employing several active elements in a closely spaced configuration [3, 6].
4.2.2 Hydro–Mechanical Behavior
The behavior of the energy micropiles in group, in the arrangement assumed for Problem 2, was addressed in simulations 5 and 6, characterized by different pile spacing. Having recognized from the investigation of Problem 1 that the thermo-mechanical coupling effects cannot be reduced to the sole presence of thermal expansion/contraction (of the soil, the pore water, and the pile), only the Hypo–T model was used for the soil for both the simulations of this group (see Table 4). The time histories of the vertical displacement at the pile head are shown in Figure 10 for different pile spacing.
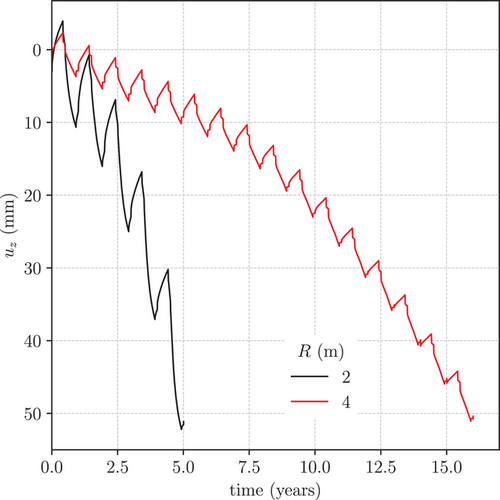
A striking result emerging from both simulations is that the progressive accumulation of permanent vertical displacements was, in both cases, much faster than for the isolated micropile of Problem 1. Moreover, none of the simulations reached the final target time of 50 years, as they stopped due to the lack of convergence in the global equilibrium and flow iterations at about = 5 years (simulation 5) and 16 years (simulation 5). In both cases, the maximum value of , reached when the simulation stopped, was about 50 mm. This value was much larger than the pile head settlement computed at the same time station in simulations 2 for the isolated micropile (see Figure 4a). It is worth observing that such large displacement values are also a consequence of the simplifications of the used numerical model (the micropile head is not constrained). However, as previously stated, the goal of this study is to qualitatively highlight the most significant features of the analyzed systems from a geotechnical point of view.
A detailed assessment of the results obtained in simulations 5 and 6 was made in terms of temperature and excess pore pressure evolution in time and space, as well as of the stress state along the micropile-soil lateral interface. The attention was focused on the distribution of the different fields along two verticals: vertical A, located at a distance from the micropile axis, and vertical B, located at a distance m from the micropile axis.
Figure 11 shows the isochrones of soil temperature along vertical A, at a number of selected time stations during the first year of thermal loading. To facilitate the reading of the data, the isochrones referring to the two different micropile spacings are provided in separate plots for each time station. For comparison purposes, the isochrones of soil temperature computed for the single isolated micropile during the same time period and at the same location are also shown in Figure 11. The bottom part of each plot displays the position of the corresponding time station in the time history of the temperature at the pile. The initial conditions at the beginning of the cycle, identical for the three simulations, are shown in the leftmost plot on the top row represents the initial temperature state, which is the same for all simulations.
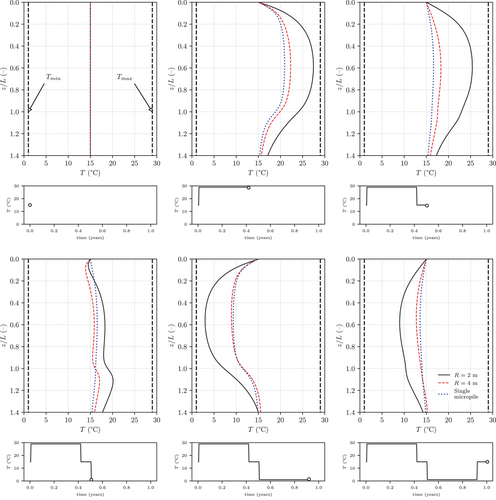
During the heating stage ( years), the temperature in the soil increased, with larger temperature increments observed for the smaller value of . This is clearly due to the smaller volume of soil involved in the heating/cooling process in this case. It is worth noting that the largest increase in temperature was not reached at the end of the heating stage ( years), but rather before the start of the first rest period. This is due to the heat flux towards the ground surface, which is active during the entire half-cycle, but whose effects are more noticeable during the rest period ( years). During the cooling stage the trend was reversed, with the temperature rapidly decreasing below its initial value. Again, the largest absolute variations in were observed for the case with = 2 m instead of for = 4 m. It is worth noting that at the end of the full cycle ( = 1 years), the temperature did not return to its initial value of 15; a permanent decrease of temperature, as large as about 7 in absolute value for the = 2 m case, was observed at the pile mid-height.
When the spacing of the micropiles in the group is sufficiently large ( = 4 m) the isochrones of are similar to the ones computed for a single isolated micropile. Therefore, the thermal interaction among the different micropiles is minimal. The absence of thermal interaction is also reflected in the heat flux trends, as previously shown in Figure 9. However, group effects are visible in terms of settlements: in fact, the pile head settlement accumulated over 15 years of operation is about 40 mm for the isolated single micropile (see Figure 4a), and about 50 mm for the micropile group with = 4 m (Figure 10). This is due to the fact that the zero water flow condition at the external vertical boundary of the elementary cell reduces significantly the possibility of excess pore water pressure dissipation in the radial direction, as compared to the case of the isolated micropile.
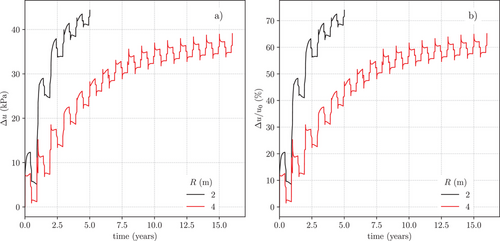
The response of the soil to the thermal loading in terms of the time evolution of the excess pore water pressure at point P, is shown in Figure 12. The curves relative to the two different pile spacings considered were qualitatively similar to the one obtained for the isolated micropile with the Hypo–T model over the first 10 years of operation of the system, with a small yearly cyclic variation superimposed to a long-term monotonic increase of the average value of (see Figure 6a). The most striking difference between the isolated micropile and the micropile group responses is in the magnitude of the time-averaged excess pore water pressures. In fact, at the end of both simulations 5 and 6, the maximum values reached about 42 kPa (about 70% of the initial hydrostatic pressure ) for the case = 2 m and about 36 kPa (about 60% of ) for the case = 4 m, while for the case of the isolated micropile, the maximum value of , reached after about 9 years of operation, was about 12 kPa, i.e., about three times smaller.
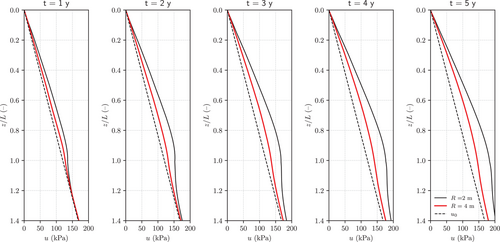
To get more insight on the excess pore water pressure distributions within the soil mass, specifically at the micropile-soil interface, the isochrones of the pore water pressure at five different time stations (1, 2, 3, 4, and 5 years) along the vertical B are shown in Figure 13 for = 2 mand 4 m.In the same figure, the dotted lines represent the initial hydrostatic pore water pressure distribution. The previous observations made about the excess pore water pressure at point P can be extended to the entire micropile-soil interface. The values of obtained for the case = 2 m were larger than those obtained for = 4 m over the whole pile length. Below the micropile tip () the computed pore pressure converged to the hydrostatic distribution with increasing , as the temperature variations experienced by the soil decreased with the distance from the micropile tip. The observed tendency of the pore pressure to increase with time for a given depth was to be expected, given the observations made on averaged excess pore water pressures at point P. It is worth noting that the largest deviations from the hydrostatic pore water pressure distribution were obtained for the case with = 2 m, due to the larger temperature variations induced in the soil in this case, as compared with the case with 4 m.
The significant, progressively increasing excess pore pressures registered along the micropile lateral surface for both simulations 5 and 6 may have a dramatic impact on the normal effective stress (along the micropile-soil interface)—which controls the available shear strength at the interface—and on the shear stress on the same surface. To investigate this possibility, the time evolution of: The shear stress distribution with depth along the micropile-soil interface, and the absolute value of the shear strength at the interface, are shown in Figure 14a,b, respectively.
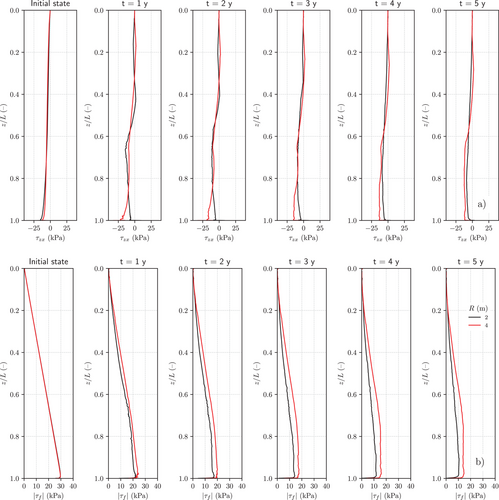
For the sign convention adopted, the shear stress acting on the pile is positive downwards, see the initial distribution at = 0 years in Figure 14a. From the plots corresponding to increasing operation times, it is apparent that, as increased, the shear stresses increased in the upper part of the pile shaft, eventually reaching a positive value in certain regions of the lateral surface, while they decreased (i.e., increased in absolute value) in the lower part of the pile shaft. From the results of Figure 14b it emerged clearly how the modulus of decreased progressively with time along the entire pile shaft, as a result of the progressive reduction of the normal effective stress on the lateral surface of the micropile.
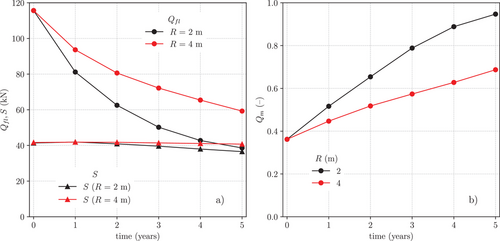
It can be noted from Figure 15a that, while the value of remained relatively stable with time, the micropile shaft resistance decreased dramatically with time, due to the progressive development of excess pore pressures at the soil-micropile interface. Since the development of was faster for the smallest pile spacing ( = 2 m, see Figure 13), the same held for the decrease of with time. At the end of the fifth cycle ( = 5 years), the micropile shaft resistance had decreased to a point in which it was equal to the resultant of the shear stresses at the soil-pile interface. This is clear from the time evolution of the mobilized shaft resistance shown in Figure 15b. For both the considered spacings, increased with time, with a faster rate for the case of the smaller pile spacing. While for the larger pile spacing the mobilized shaft resistance at = 5 years was about 70% of its failure value, an almost complete mobilization of the shaft resistance was obtained at the same time station for the smaller pile spacing. This means that, for = 2 m, the pile bearing capacity had reduced to a level at which it equaled the applied dead load at the pile head, thus the pile was very close to a limit equilibrium condition. Further reductions of the pile bearing capacity, due to the continued cyclic thermal loading, could not be allowed. The occurrence of such condition was signaled by the lack of convergence of the global equilibrium problem which, in fact, occurred at about = 5 years in simulation 5. In simulation 6, due to the slower excess pore pressure build-up at the micropile-soil interface, the bearing capacity failure of the micropile occurred much later on, at 16 years.
It is worth noting that, in all simulations, the axial load acting at the pile head was constant and equal to during the entire simulation. Therefore, if we neglect the (small) contribution of the vertical stresses acting at the pile tip, the resultant remains approximately constant and equal to the value assumed at the end of the isothermal loading stage, due to the global equilibrium condition of the pile in the vertical direction. This is approximately the case of the group with the largest pile spacing, while for the group with the smallest pile spacing a slight reduction in is observed starting from the third year of operation, most likely due to the changes in the resultant vertical load at the pile tip. Hence, for the case at hand, the variation observed in the axial bearing capacity of the micropile is mostly due to the development of excess pore water pressure.
5 Summary and Concluding Remarks
This study focuses on the THM response of energy micropiles embedded in a NC saturated clay layer, with the aim of providing a contribution towards the assessment of the effects of thermal cyclic loading on both isolated energy micropiles and micropile groups installed in fine-grained soils with relatively low shear strength and high compressibility. The numerical model taken as the reference was that one discussed in a previous work of Iodice et al. [23] for medium-size isolated energy piles embedded in hypoplastic clay.
As far as the thermal response of the micropile is concerned, the results obtained show that, as expected, the total heat flux exchanged by a single isolated energy micropile is lower than the one provided by an isolated medium-size pile, due to the smaller lateral surface area. However, in the same conditions, the heat flux exchanged by the energy micropile per unit lateral surface is greater than the one obtained for the medium-size pile. This indicates that a group of micropiles whose total exchanging surface was equal to that of a single medium-size pile could have a better thermal performance than the isolated pile, if no thermal interaction effects occur among the micropiles of the group. The thermal interaction effects were clearly visible when the cases of the groups of micropiles were analyzed. The presence of such thermal interference, which increases as the spacing is decreased, poses some concerns about the overall thermal performance of energy micropile systems that employs several active elements in a closely spaced configuration.
The comparison between the settlement at the pile head for the isolated micropile with the two different hypoplastic models Hypo and Hypo–T shows that the thermo-mechanical coupling mechanisms present in the Hypo–T model can be significant, in terms of both the final value of and its evolution with time. An accurate quantitative prediction of this aspect of the micropile behavior is not the scope of this work, but it can be stated that it cannot be obtained by limiting the thermo-mechanical coupling effects to thermal dilation/contraction. Thus, only the Hypo–T model seems appropriate for this goal. When this model was used, no scaling effects were detectable between the normalized head displacement of the isolated micropile and of the medium-size pile.
The development of excess pore pressures in the soil mass surrounding the isolated micropile plays a very important role in controlling the deformation and displacement fields of the soil-micropile system. At a single material point, the time evolution of the excess pore water pressure is characterized by short-term oscillations associated with the yearly variation of the thermal load, superimposed to a progressive accumulation of , related to the inelastic mechanical response of the solid skeleton. This long-term accumulation of excess pore pressure induces in the soil a slow consolidation process which is responsible for a significant part of the time-dependent micropile head settlement over the time period considered. The progressive accumulation of positive excess pore pressure increments over each thermal cycle is even more important in the case of groups of energy micropiles, where, due to the thermal interaction among neighboring micropiles, the long-term moving average values of are larger than in the case of the isolated micropile, and increase with reducing spacing. The build-up of excess pore water pressure can produce a significant decrease of the shaft resistance at the micropile-soil interface.
Acknowledgments
This research was funded by PON R&I 2014–2020 (FSE REACT–EU), DM 1062/2021 contract 23–G–15448–2 (J91B21003300006). Project: Geothermal micropiles for high-efficiency HVAC systems based on low-entalpy geothermal energy.
Open access publishing facilitated by Università degli Studi di Firenze, as part of the Wiley - CRUI-CARE agreement.
Appendix A: Constitutive Equations of the Hypo–T Model
Open Research
Data Availability Statement
All data are available from the corresponding author upon reasonable request.


