Evaluation of visible implant elastomer (VIE) tags for use in supplementation of an endangered estuarine fish
Abstract
Objective
Delta Smelt Hypomesus transpacificus are thought to be close to extinction in the wild, which has spurred multiagency conservation efforts to supplement their population. In conjunction with these recent efforts, monitoring is needed to assess the effectiveness of supplementation. Such monitoring often uses large-scale tagging of released fish to distinguish between hatchery-origin and wild-origin fish that are captured during later surveys.
Methods
In this study, we evaluated the use of visible implant elastomer tags in Delta Smelt to determine whether fish survival, fish growth, or tag retention were dependent on (1) tag color (blue, green, orange, red, yellow, and no-tag control) or (2) tagged body location (posterior-dorsal, anterior-dorsal, mid-lateral line, and no-tag control).
Result
Over 165 days of the first experiment, there was no difference in growth rate (mean = 0.073 mm/d, range = 0.072–0.075 mm/d) or survival (mean = 68%, range = 63–77%) among tag colors. Across all color groups, mean tag retention was 96% (range = 87–100%). Over 120 days of the second experiment, tag location had no influence on fish growth rate (mean = 0.064 mm/d, range = 0.062–0.067 mm/d) or survival (mean = 50%, range = 43–58%). For the surviving fish in experiment 2, the tags that were placed at the mid-lateral line were retained less (84% on day 120) than those at posterior-dorsal and anterior-dorsal locations (99% and 98%, respectively).
Conclusion
Our results suggest that visible implant elastomer tagging is a suitable method for marking adult Delta Smelt (>50 mm fork length) for up to 165 days and can be useful for conservation monitoring efforts.
INTRODUCTION
Anthropogenic stressors across marine, estuarine, and freshwater habitats have caused steep population declines and are threatening the survival of many fish species (Hutchings and Reynolds 2004; Deinet et al. 2020). Understanding how to reverse these declines through conservation efforts is a pressing research and management need. However, such efforts need to be conducted in conjunction with well-planned monitoring and management strategies (Allen and Gunderson 2011; Dark and Burgin 2017).
The San Francisco Estuary is representative of the increasing conservation challenges that face estuarine systems worldwide (Nichols et al. 1986; Lotze et al. 2006; Castillo et al. 2023). In response to the population collapse of imperiled Delta Smelt Hypomesus transpacificus (threatened, U.S. Fish and Wildlife Service 1993; endangered, California Fish and Game Commission 2009) and other native species that are endemic to the San Francisco Estuary (Sommer et al. 2007; Hobbs et al. 2017), several large-scale conservation efforts have been implemented, including habitat restoration and manipulating flow to manage salinity. Recently, efforts to supplement the Delta Smelt population have begun with experimental releases of genetically managed, hatchery-origin Delta Smelt into the wild (U.S. Fish and Wildlife Service 2021), with a target of 125,000 fish released yearly by 2025 (U.S. Fish and Wildlife Service 2019, 2020).
To monitor the effectiveness of this conservation effort, a marking method to distinguish between hatchery- and wild-origin Delta Smelt that are captured during monitoring surveys is required (California Department of Fish and Wildlife 2021). Ideally, the marking method should (1) not influence recapture, survival, or growth (Stott 1968; Guy et al. 1996); (2) be appropriate for Delta Smelt release size 50–70 mm fork length; and (3) remain identifiable for the expected recapture period (4–6 months after release based on adult longevity; Moyle et al. 2016). Furthermore, the tagging method that is required for such a large-scale operation must minimize tagging time and cost (Skalski et al. 2009). Thus, studies are needed to determine which tagging methods most effectively fulfill these requirements.
Several external tagging methods have been used in Delta Smelt, all of which have advantages and disadvantages (Sandford et al. 2019). Adipose fin clipping is commonly used to mark Delta Smelt (Pine et al. 2012; Lindberg et al. 2013; Sandford et al. 2019) and allows for a single, large batch of fish to be marked quickly and inexpensively. However, to adequately monitor supplementation efforts for Delta Smelt, multiple batch markings are needed to distinguish between experimental release methods, locations, and times, for example. Another commonly used tagging method for Delta Smelt is visible implant alphanumeric (VIA) tags, which are small, hard plastic tags with unique alphanumeric codes that are used to identify individual fish (Northwest Marine Technology [NMT] 2017). These tags are used in the management of the refugial Delta Smelt population, as they result in high fish survival (89.5%) and tag retention (40–100%, dependent on fish size; Lindberg et al. 2013; Sandford et al. 2019). Visible implant alphanumeric tags are small and relatively inexpensive, which makes them ideal for use in Delta Smelt in a hatchery setting (Sandford et al. 2019). In the case of supplementation, however, the time and cost of marking fish to an individual level may not be feasible or necessary. Instead, visible implant elastomer (VIE) tags may be a better tagging method for supplementation purposes than either adipose clipping or VIA tagging, as they provide a way to distinguish groups of batch-marked fish (Blankenship and Tipping 1993; Dewey and Zigler 1996; Sandford et al. 2019).
Visible implant elastomer tagging is performed by injecting a liquid elastomer into transparent tissue to form a biocompatible mark (Griffiths 2002), and VIE tags offer several advantages over VIA tags for batch-marking Delta Smelt. Because VIE tagging does not require reloading the syringe to tag each fish, tagging time is reduced relative to VIA tagging (e.g., Castillo et al. 2018). Hohn and Petrie-Hanson (2013) were able to tag 120 fish/h per person using VIE tags, which is higher than can be tagged when using VIA (L. Ellison, Fish Conservation and Culture Laboratory, personal communication). In a well-established supplementation program for Rio Grande Silvery Minnow Hybognathus amarus that uses VIE tags, an experienced tagger can mark 2000–3000 fish per day (Archdeacon et al. 2023). Also, VIE tags come in a variety of colors and cost less than VIA tags (US $0.06 vs. $0.90 per tag, ca. 2023) and VIE tagging uses a smaller-gauge needle so that fish can be tagged at smaller sizes with less chance of injury or trauma and shorter recovery times. Given the specific needs of supplementation monitoring in which group-level identification is required while minimizing labor and costs, VIE tagging may be the most appropriate method for marking Delta Smelt to be released. However, this method has not been validated in Delta Smelt and it is unclear how VIE may best be applied to minimize negative effects on fish health and maximize tag retention.
In this study, we conducted two laboratory experiments to evaluate the feasibility of using VIE tagging for large-scale marking in cultured Delta Smelt. With VIE, fish can be tagged using different combinations of colors and body locations to create unique batch-level markings. Therefore, we examined whether tag color and body location affected fish survival, fish growth, and tag retention. Testing the effects of VIE tagging is important before its use in large-scale releases (Knight 2006; Jungwirth et al. 2019), particularly for a species that is sensitive to handling stress like Delta Smelt (Swanson et al. 1996; Afentoulis et al. 2013; Pasparakis et al. 2022, 2023). Together, our experiments provide the basis for the initial tagging strategy for experimental releases of Delta Smelt into the San Francisco Estuary.
METHODS
Fish care and tagging
All the Delta Smelt were hatched and reared at the University of California, Davis Fish Conservation and Culture Laboratory in Byron, California, in accordance with facility standards (Lindberg et al. 2013; Tsai et al. 2022). They were held in 1100-L (1.5 m diameter) insulated fiberglass tanks and maintained at 12°C for the duration of the experiments. This temperature is the standard that is used for culturing Delta Smelt during March and April (Rahman et al. 2023), the period when the experiments began. Fish health and mortalities were monitored daily. The fish were treated for infections as needed following standard operating procedures. Oxytetracycline HCl (Pennox 343, Pharmgate Animal Health LLC, Omaha, Nebraska) was administered in response to any unusually high mortality rate of unknown cause, per standard facility protocol (dosage of 20 mg/L for 4 h per day). A formaldehyde (4.26%) and malachite green solution (Pond Rid-Ich Plus, Kordon LLC, Hayward, California) was administered at a dosage of 1.04 mL/L for 1 h per day in response to observations of Ichthyophthirius multifiliis infection. The number of days and frequency of treatment varied based on need.
At least 2 weeks prior to each experiment, fish were tagged with unique VIA tags (NMT, Anacortes, Washington) to allow for individual identification (Figure S1 available in the Supplemental Information in the online version of this article). The VIA tags were placed on the left side of the fish above the lateral line and below and anterior to the dorsal fin, following standard facility protocols. The fish were anesthetized using buffered MS-222 (0.1 g tricaine methanesulfonate +0.2 g sodium bicarbonate per L of water) and tagged after they lost equilibrium and no longer responded to external stimuli. After tagging, the fish were allowed to recover, returned to their source tank, and prophylactically treated with oxytetracycline HCl (20 mg/L for 4 h/day for 3 days).
Two or more weeks after the VIA tagging, the fish were tagged with VIE on the right lateral side following manufacturer protocols (NMT 2017) and based on the methods that are used by the U.S. Fish and Wildlife Service (2016). Both experiments included a no-tag control group in which the fish had VIA tags and were anesthetized but were not tagged with VIE. Further details regarding VIE tag color and placement for each experiment are outlined in the following sections. After VIE tagging, the fish were again treated with oxytetracycline HCl for 3 days to prevent infection.
At predetermined intervals, the fish were caught, individually identified by VIA code, measured (fork length, mm), and evaluated for VIE tag presence and color. For each evaluation, two people who were not color-vision deficient and were familiar with VIE tagging assessed all the fish. The same two people conducted all evaluations throughout both experiments. Tag presence and color were evaluated by sight under natural lighting conditions, as this most closely replicated the conditions in which tagged fish would be examined in the field. A tag was considered retained if it was detected during assessment or lost if not. On the last day of each experiment, the fish were humanely euthanized with a lethal dose of buffered MS-222 (1 g tricaine methanesulfonate +2 g sodium bicarbonate per liter of water). Final fork length measurements and tag evaluations were completed immediately after euthanasia.
Experiment 1—Tag color
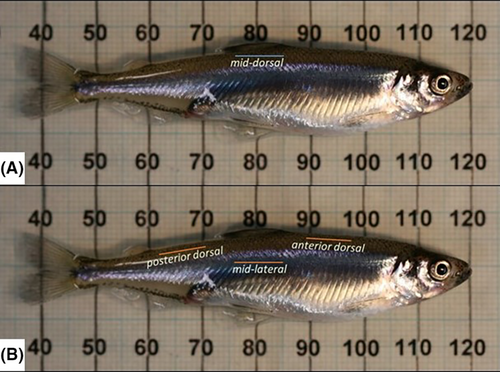
In experiment 1, we evaluated the effect of VIE color (blue, green, orange, red, yellow, and no-tag control; n = 30 fish each) on fish survival, fish growth, and tag retention. Experiment 1 started on March 10, 2021, when the fish were 282–397 days posthatch. The fish were tagged in groups of 30 by color treatment. The VIE tags were placed just below the dorsal fin and above the lateral line on the right side of the fish (Figure 1A). A single person tagged all 180 fish over two consecutive days. The fish were maintained in a single 1100-L tank.
During the assessments, we measured the fish for fork length and evaluated tag presence and color 14 days after tagging and then every 30 days thereafter for 165 days. Alhough we initially intended to measure fork length at each evaluation, high outdoor air temperatures on days 105 and 135 (28.3°C and 37.8°C, respectively) led to a modified sampling scheme in which we only assessed tag presence and color on those 2 days to minimize thermal-stress-related mortality.
Experiment 2—Tag location
In experiment 2, we evaluated the effect of tagging location (posterior-dorsal, anterior-dorsal, mid-lateral line, and no-tag control; Figure 1B) on fish survival, fish growth, and tag retention. Experiment 2 started on April 21, 2021, when the fish were 324–326 days posthatch. All the VIE tags were placed on the right lateral side. Each of four people with previous tagging and handling experience with Delta Smelt tagged 120 fish for a total of 480 fish. Each tagger was assigned a different VIE color (green, orange, red, and yellow) to facilitate the correction of errors made while reading the VIA tag numbers. For example, the VIA tags reading G10 and G70 were difficult to distinguish but because G10 had a red VIE tag and G70 had an orange VIE tag, no data were lost due to this possible confusion. Within each tagger, the fish were tagged at each body location in repeated, systematic order (n = 30 fish per treatment per person). The fish were tagged over 2 days (1 week apart) and were maintained in one 1100-L tank throughout the experiment.
To assess survival, growth, and tag retention, the fish were measured for fork length and evaluated for tag presence every 30 days for 120 days beginning after the last day of tagging. On day 60, tag assessment and fork length measurements were suspended after assessing 93 fish because the fish exhibited signs of severe stress (including light dorsal pigmentation and stiffening of the body during handling), likely due to high outdoor air temperatures (41.1°C). To complete our assessment, we evaluated all the fish 1 week later but excluded measurements of fork length to minimize stress for the fish. On day 90, the fish again showed signs of stress. We addressed this by increasing tank salinity, which allowed us to complete the assessment that day. Delta Smelt that are tagged for supplementation will be tagged during the fall and winter for winter releases, so such periods of high heat stress can be avoided.
Statistical analysis
All the statistical analyses were performed using R (version 4.3.1; R Core Team 2023). For each experiment, we compared sets of candidate models to explain fish survival, fish growth, and tag retention. For each group of candidate models, the final model was chosen based on having the lowest second-order Bayesian information criterion (BIC; Schwarz 1978), which was calculated using the BIC function (version 4.3.1; R Core Team 2023).
Fish survival
We performed logistic regressions to determine whether fish survival differed between treatment groups over time. For both experiments, the response variable was the proportion of live fish on a given day out of the total number of fish that were tagged at the start of the experiment. Possible explanatory variables were days since tagging and either tag color (experiment 1) or body location of tagging (experiment 2).
For experiment 1, the survival models were fit as generalized linear models, using the binomial family with a logit link. These models were fit using the glm function in the stats package (R Core Team 2023). We considered the following explanatory variables: the fixed effects of tag color (categories: blue, green, orange, red, yellow, and no-tag control), time (number of days from the start of the experiment), and the interaction between color and time.
For experiment 2, we fit a set of candidate generalized linear mixed models using the glmer function in the lme4 package (Bates et al. 2015). The explanatory variables that were considered for inclusion were the fixed effects of tagging location (posterior-dorsal, anterior-dorsal, mid-lateral line, or no-tag control), time, and the interaction between the two. The combined influence of tag color and tagger identity was modeled as a single, combined random-effect term. We centered and scaled the time variable (subtracted the mean and divided by the standard deviation) to improve model convergence. The estimated marginal means and associated confidence intervals were calculated using the emmeans function in the emmeans package (Lenth et al. 2022).
Fish growth
For both experiments, we examined growth using generalized linear mixed models with Gaussian distribution and identity links. For all the growth models, fork length was the response variable and fish identity (VIA code) was included as a random effect to account for repeated measurements on each fish over time. For experiment 2, we treated fish identity as nested within the combined tagger and tag color variable. This random-effects structure accounted for repeated measurements on fish and potential differences caused by different taggers and colors. Potential explanatory variables were treatment, time, and the interaction between the two. The treatment was tag color for experiment 1 and tag location for experiment 2.
A fish was excluded from the growth analysis if it lost its VIA tag and could not be reliably matched to the correct individual identity based on other indicators (e.g., it was the only fish missing a VIA tag). This occurred rarely, as only one VIA tag was lost in experiment 1 and four in experiment 2.
Tag retention
To determine whether tag retention differed across treatments, we used generalized linear models with a binomial family. For these models, the response variable was whether a fish was correctly identified as having a VIE tag. We used the data from both evaluators, with fish identity included as a random factor. Potential explanatory variables were treatment (tag color for experiment 1 and tag location for experiment 2), time, and the interaction between the two. Because tag loss was a rare event, maximum-likelihood methods for estimating group means and standard errors were unsuccessful. Instead, to fit the models for tag retention, we used Firth logistic regression methods (Firth 1993) to calculate finite standard errors and overcome the issue of quasiseparation. This was done using the brglm function in the brglm package (Kosmidis 2021; Kosmidis and Firth 2021).
RESULTS
Experiment 1—Tag color
Survival
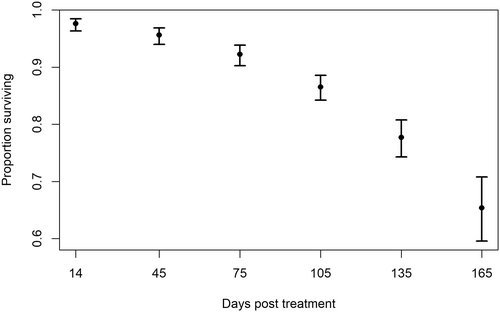
The best model included only time as a factor (Table 1). Survival within the first 14 days after tagging was high, with no more than one mortality in any treatment group (Figure 2). Survival decreased over time, but the rate of decrease in the mean number of surviving fish did not differ between treatments throughout the experiment (Figure 2).
| Fixed effects structure | Delta Smelt survival | Delta Smelt fork length | Delta Smelt tag retention | |||||
|---|---|---|---|---|---|---|---|---|
| df | BIC | df | BIC | df | BIC | |||
| Color × time | 12 | 875.539 | 14 | 4654.533 | 10 | 163.56 | ||
| Color + time | 7 | 843.0884 | 9 | 4588.789 | 6 | 132.0891 | ||
| Color | 6 | 979.4713 | 8 | 5385.227 | 5 | 143.0121 | ||
| Time | 2 | 815.254 | 4 | 4570.347 | 2 | 117.6418 | ||
Growth
The best model for growth in experiment 1 included only time (Table 1), meaning that growth rates were consistent across treatment groups. Using this model, the estimated growth rate with a 95% confidence interval for the fish in this experiment was 0.073 mm/d (range = 0.072–0.075).
Tag retention
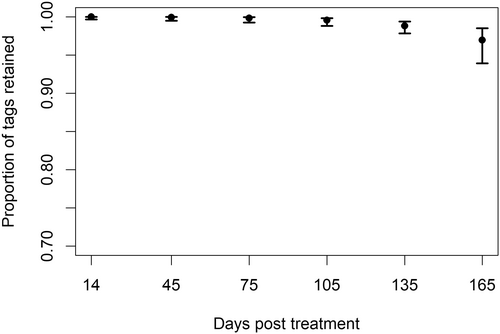
The best model for tag retention included only time (Table 1). Tag retention was >99% across all colors for the first 75 days of the experiment (Figure 3). Retention of blue and red tags was 100% for the duration of the experiment, and green and orange tags had 100% retention through day 135. On day 165, a single fish from each of the green and orange groups was not identified by one or both evaluators. Although not significantly different from the other colors, the yellow tags had higher tag loss, with one tag undetected as early as day 75 and three more by day 165.
The misidentification of tag color was rare (2 of 769 total observations, 0.3%) and thus precluded statistical analysis. For one fish, an evaluator recorded a green tag as being orange. However, the same evaluator correctly identified the same fish as orange at the next assessment 30 days later. In the other fish, both evaluators recorded a yellow tag as green on day 135 of the experiment. That same tag was not visible and recorded as missing by both evaluators on day 165. All other color identifications across all days and both evaluators were correct.
Experiment 2—Tag location
Survival
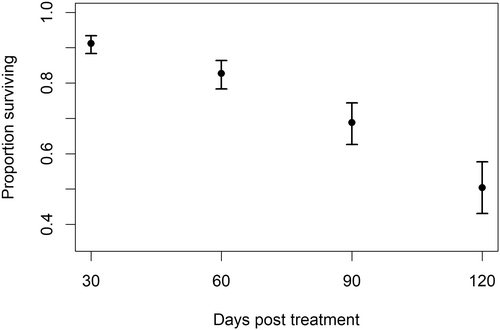
The best model for survival in experiment 2 included time as the main effect (Table 2). Survival decreased over time at a similar rate for all tagging locations and the no-tag control (Figure 4). None of the locations that was tested differed significantly from the no-tag control or from each other.
| Fixed effects structure | Delta Smelt survival | Delta Smelt fork length | Delta Smelt tag retention | |||||
|---|---|---|---|---|---|---|---|---|
| df | BIC | df | BIC | df | BIC | |||
| Location × time | 9 | 2231.425 | 11 | 8879.228 | 7 | 445.0155 | ||
| Location + time | 6 | 2211.202 | 8 | 8856.422 | 5 | 432.8286 | ||
| Location | 5 | 2591.47 | 7 | 9984.016 | 4 | 443.1602 | ||
| Time | 3 | 2196.935 | 5 | 8838.095 | 3 | 527.7128 | ||
Growth
The best model for growth included only time in addition to the random-effects structure that was common to all the models that we compared (Table 2). Using this model, the estimated growth rate with a 95% confidence interval for the fish in this experiment was 0.064 mm/d (range = 0.062–0.067) regardless of tag location.
Tag retention
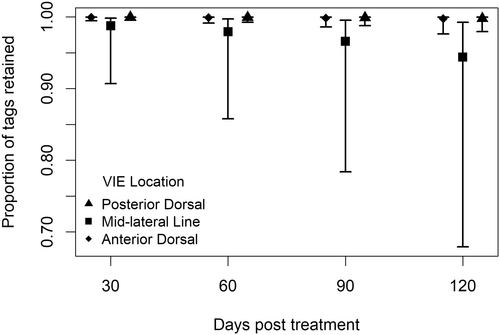
The best model for tag retention included time and body location as main effects (Table 2). Tag retention was high at the anterior-dorsal and posterior-dorsal locations (98% and 99%, respectively), with only four tags at these locations lost over the 120 days of the experiment. The mid-lateral line location had significantly more tag loss than either the anterior-dorsal or the posterior-dorsal locations (Figure 5). A few of these fish showed scarring at the mid-lateral line but no visible tag color. The taggers also reported that it was difficult to correctly position the mid-lateral mark during tagging due to its location on the lateral line, which lacked sufficient musculature for easy needle insertion. After seeing the large confidence intervals for mid-lateral tag retention in this model, we investigated further and found that most of the tag loss occurred with the yellow tags at that location. Of the 20 individual fish with missing mid-lateral line tags over the course of the experiment, 16 were yellow and 4 were orange.
DISCUSSION
The results of our two experiments show that VIE tags are a viable method for tagging adult Delta Smelt and provide guidance on the tag colors and locations that are associated with the best outcomes in terms of fish health and tag longevity. Experiment 1 showed that VIE tag color did not significantly affect the survival or growth of Delta Smelt, although yellow tags were less well retained than the other colors that were tested. Furthermore, fish survival and tag retention were both high in experiment 1, suggesting that the mid-dorsal tagging location was well tolerated. Experiment 2 showed that tag location did not affect growth or survival and the fish that were tagged at the mid-lateral line had lower tag retention rates than those that were tagged at the other locations. The observed levels of fish survival, tag retention, and tag identifiability appear to be sufficient for batch-marking hatchery-origin Delta Smelt and suggest that VIE tagging may be useful for monitoring supplementation efforts (U.S. Fish and Wildlife Service 2023).
Overall, VIE tags did not reduce the survival rate of Delta Smelt in our experiments, as survival in both of our experiments was consistent across treatment groups and did not differ from that for the no-tag control. Although Delta Smelt are susceptible to handling stress (Swanson et al. 1996; Afentoulis et al. 2013; Pasparakis et al. 2022), we observed high survival within the first 2 weeks after tagging. This is consistent with results that have been seen when using VIA tags on Delta Smelt (89.5% 1 week after tagging; Lindberg et al. 2013). The cumulative survival rates for the VIE-tagged Delta Smelt in our experiments (44.4–65.4%) were lower than those that have been reported for other similarly sized VIE-tagged fish (e.g., Bluegill Lepomis macrochirus, 99.0% over 6 months, Dewey and Zigler 1996; Rainbow Trout Oncorhynchus mykiss, 96.7% over 34 days, Leblanc and Noakes 2012; Zebrafish Danio rerio, 100.0% over 1 year, Hohn and Petrie-Hanson 2013), although these studies did not include fish that were marked with both VIA and VIE tags. The higher mortality rates that were observed in this study may be attributed in part to the high summer temperatures during which our experiments were conducted and in part to the natural life cycle of Delta Smelt. However, VIE tagging for supplementation releases will occur in winter, thereby mitigating these potential sources of mortality.
In addition to the overall effect of VIE tagging, the specific factors of VIE color and location did not significantly influence the survival rate. This is consistent with previous VIE studies that tested color and location and reported no differences in survival (Dewey and Zigler 1996; Hohn and Petrie-Hanson 2013). However, other studies of small-bodied fish have found an effect of body location on fish survival, with the dorsal side of the fish reported as being well tolerated (e.g., Skinner et al. 2006; Bushon et al. 2007). The three dorsal locations that we tested (mid-dorsal in experiment 1 and anterior- and posterior-dorsal in experiment 2) were all effective and may serve as preferred locations for use in supplementation efforts and future Delta Smelt studies.
We noted that the fish in experiment 1 had higher overall survival (65.4% survival across all treatments over 165 days, 95% CI = [59.5–70.8%]) than those in experiment 2 (51.0% survival across all treatments over 120 days, 95% CI = [43.7–58.3%]; Figure S2). When aligned by calendar date, we found that mortality rates for both experiments were indistinguishable during the first half of experiment 2 (Figure S3). However, during the second half of experiment 2, the survival rate of experiment 2 diverged from that of experiment 1. We believe that this difference is explained by health and environmental stressors. Specifically, the fish in experiment 2 showed symptoms of Ichthyophthirius multifiliis infection on the day that they were tagged and throughout the experiment. Although the fish were prophylactically treated, both the infection and the treatment itself may have induced stress and increased vulnerability to other stressors. Additionally, although maintained within facility standards, the fish in experiment 2 were kept at higher densities (480 fish/tank) than those in experiment 1 (180 fish/tank). Such stress-related factors likely contributed to the increased mortality in experiment 2 and potentially explain the difference in survival between experiments better than age (experiment 1 included fish that were older than those in experiment 2) or timing (experiment 2 started after and ended before experiment 1).
We found that growth rates were consistent across treatments within experiments, suggesting that any differences in growth were unrelated to the VIE tags. This is consistent with past studies that have showed that VIE tags do not affect fish growth in other small-bodied fish species (Leblanc and Noakes 2012; Hohn and Petrie-Hanson 2013). Growth rates were higher in experiment 1 than in experiment 2, but we attributed this difference to factors such as initial fish size, fish condition, and tank-stocking densities (see above).
Delta Smelt are short-lived—few survive a second year (Moyle et al. 2016)—and adult fish that are released in winter are unlikely to live for more than 4–6 months after their release. Thus, our experiments demonstrate sufficient tag longevity for the purposes of supplementation. Most VIE colors and tagging locations that were tested in our study were retained and identifiable over 95% of the time, remaining visible up to 4 months after tagging. This is consistent with previous studies of VIE tags in other small-bodied fish. For example, Zebrafish retained 100% of VIE tags for 1 year (Hohn and Petrie-Hanson 2013) and Daffodil Cichlid Neolamprologus pulcher retained 86% of VIE tags in a 1-year lab experiment (Jungwirth et al. 2019).
Understanding differences in retention and identifiability among tag colors and locations can inform a strategy for batch-marking fish for supplementation. For example, although tag retention did not differ significantly among colors, the evaluators noted that the yellow tags were more difficult to detect. This suggests that yellow VIE tags may be unsuitable for management applications (e.g., supplementation monitoring) in this species. Similarly, the blue tags were retained and identifiable throughout experiment 1 but evaluators reported that these could be difficult to see against the natural dark pigmentation of Delta Smelt and might be missed by someone who is unfamiliar with VIE marking methods. This is consistent with the study by Hohn and Petrie-Hanson (2013), who listed yellow and blue as the least visible colors, although all colors that were tested had high retention.
Experiment 2 showed significantly more tag loss at the mid-lateral line location, mostly in the yellow tags. With color and individual tagger effects confounded in this experiment, it is difficult to separate how much tag loss was from the tagging location and how much was due to the color or the individual tagger. The inconsistent results and the difficulties that were reported by the taggers in placing the tag render this location suboptimal. Nevertheless, the long retention time of the other VIE tag colors and tag locations provide sufficient options for batch-marking fish. More favorably, our results suggest that the mid-dorsal tag location that was used in experiment 1 is advantageous because survival and tag retention were high regardless of tag color.
MANAGEMENT IMPLICATIONS
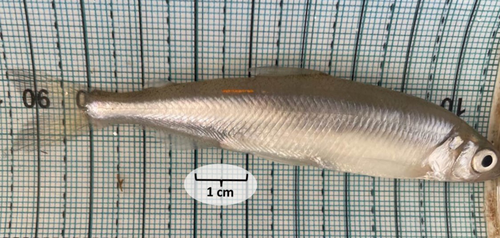
Our study shows that VIE tagging can be used effectively in species that are sensitive to handling stress, as is the case for Delta Smelt (Swanson et al. 1996; Afentoulis et al. 2013; Pasparakis et al. 2022). This tagging method has since been used to monitor the supplementation of the species. Briefly, VIE tags were successfully used in initial releases of Delta Smelt during 2021–2022 (5000 Delta Smelt marked with VIE out of ~56,000 fish released), followed by broader application during 2022–2023 (~41,000 VIE-tagged among ~44,000 fish released) and in 2023–2024 (~65,000 VIE-tagged among ~91,000 fish released). Since experimental release was implemented in 2021, we have observed 100% VIE tag retention among the hatchery-origin Delta Smelt that have been recaptured during monitoring surveys (total adult captures: 78 VIE-tagged, 91 adipose-clipped, and 9 wild-origin fish) based on tag status (presence/absence) and parentage analysis (M. Finger, University of California, Davis Genomic Variation Laboratory, personal communication). One of these fish showed a recognizable VIE tag 6 months after tagging (Figure 6), demonstrating the longevity of this marking method, its durability under wild conditions, and its effectiveness in monitoring supplementation efforts. In addition, the number of unique combinations of tag colors and locations that we tested has facilitated the evaluation of the effectiveness of various release methods, sites, and timing while minimizing interyear redundancy among the combinations that are used. Thus, VIE tagging can be a useful tool to support supplementation-monitoring efforts for Delta Smelt and other similar species and our study provides much-needed guidance in its use.
ACKNOWLEDGMENTS
We thank all U.S. Fish and Wildlife Service and Fish Conservation and Culture Laboratory staff who provided technical assistance throughout this study. The findings and conclusions of this study are those of the authors and do not necessarily represent the views of the U.S. Fish and Wildlife Service. Funding was provided by the U.S. Bureau of Reclamation under agreements R20PG00082 and R20AC00027.
CONFLICT OF INTEREST STATEMENT
The authors declare that there is no conflict of interest regarding the publication of this article.
ETHICS STATEMENT
All fish handling and care protocols were approved by the University of California, Davis Institutional Animal Care and Use Committee (#21610).
Open Research
DATA AVAILABILITY STATEMENT
The data and R code for this study can be accessed at https://github.com/USFWS/Delta-Smelt-VIE-Tags


