Effects of Ethanol Preservation on Larval and Fingerling Walleye and Gizzard Shad Body Size
Abstract
Characterizing larval fish dynamics helps identify factors contributing to poor or strong recruitment events and informs stocking practices. Growth is fundamental to fish ontogeny and survival, especially during critical early life stages, which can depend heavily on access to prey. However, obtaining accurate body size measurements of larval fish in the field can be challenging and often means samples must be preserved for later analysis. Importantly, this process can affect fish size. Here, we examined the effects of preservation in 95% ethanol on the total lengths (mm) and wet weights (mg) of larval and fingerling Walleye Sander vitreus and Gizzard Shad Dorosoma cepedianum collected from the field using pushed ichthyoplankton nets. We also estimated the time required for preservation effects to stabilize. Responses to preservation were similar between species, with consistent decreases in wet weights of ~40–70% depending on fish size, which took ~2 months to stabilize. Conversely, the response of total length was variable in direction, with lengths increasing or decreasing up to 5–10%. As a result, the average effect of preservation on total length was minimal (<2.5% decreases). Walleye and Gizzard Shad body size play an important role in understanding their dynamics early in life, and the effects of preservation should be considered to accurately and precisely characterize size metrics.
Accurate and precise morphometric measurements of larval fish are essential for understanding the interplay among feeding and growth (May et al. 2020), survival (Letcher et al. 1996), and recruitment success (Heath and Gallego 1997; Quist et al. 2003; Gostiaux et al., in press) during early life stages. For example, repeated measures of larval fish density and size in relation to food supply and environmental variables across seasons can help identify the extent and timing of potential ecological bottlenecks contributing to poor year-class strength (McDonnell and Roth 2014). However, collecting accurate and precise measurements of larval fish size can be challenging, especially in the field when poor conditions and time constraints are common (Shields and Carlson 1996; Paradis et al. 2007; Greszkiewicz and Fey 2018). The difficulty of accurately measuring larval fish in the field often requires that samples be preserved and transported for later analysis in a laboratory.
Fish are commonly preserved using ethanol, formalin, or freezing, and each preservation method can significantly alter the length and weight of larval fish (Korwin-Kossakowski 2014). In addition, preservation effects are highly variable among species, preservation types, and concentrations of preservative (Fey 1999). Despite extensive research documenting the effects of different preservation methods on larval fish (Theilacker 1980; Jennings 1991; Johnston and Mathias 1993; Shields and Carlson 1996; Fey 1999; Smith and Walker 2003; Paradis et al. 2007; Korwin-Kossakowski 2014; Greszkiewicz and Fey 2018), little is known about the effects of ethanol preservation on larval (<25 mm; Gostiaux et al., in press) and fingerling-sized (≥25 mm) Walleye Sander vitreus and Gizzard Shad Dorosoma cepedianum. The effects of preservation in formalin, in 70% ethanol, and by freezing on young Walleye have been previously studied (Glenn and Mathias 1987; Johnston and Mathias 1993). However, the effects of preservation in 95% ethanol have not, despite being used commonly in studies evaluating potential recruitment bottlenecks for Walleye (e.g., Gostiaux et al., in press). To our knowledge, evaluations of preservation effects on Gizzard Shad have not been conducted or have not been reported in an accessible peer-reviewed resource (e.g., Pitts 1992).
Walleye are a popular sport and food fish throughout North America (Hushak et al. 1986) and often co-occur with Gizzard Shad in Great Plains and western reservoirs (Wuellner et al. 2008). Understanding interactions between these two species and what influences their growth, survival, and recruitment is important for mangers to better balance predator–prey ratios and maintain or enhance recreational angling opportunities for Walleye, particularly in systems stocked to supplement natural reproduction (Quist et al. 2003). Here, we examine the effects of ethanol preservation on larval and fingerling Walleye and Gizzard Shad. The objectives of this study were to (1) test whether preservation in 95% ethanol affects the length and weight of larval and fingerling Walleye and Gizzard Shad and develop species-specific models enabling correction for preservation effects if present and (2) estimate the amount of time it takes for the effects of preservation in 95% ethanol to stabilize.
METHODS
Fish collection, measurement, and preservation
Larval Walleye and Gizzard Shad were collected from Chatfield and Cherry Creek reservoirs in Arapahoe County, Colorado, using an ichthyoplankton net with twin 75-cm-diameter rings each equipped with a 1,000-μm-mesh conical net constructed with a 4:1 length-to-mouth-diameter ratio (Sea-Gear Corporation). Fish were collected from surface waters after dark every 2 weeks throughout April, May, June, and July 2021. Larval Walleye were stocked into Chatfield and Cherry Creek reservoirs in single pulse events during mid-April, whereas Gizzard Shad naturally reproduce in both reservoirs. All samples were stored in 35-L containers filled with chilled lake water for transport back to the laboratory, and measurements were taken postmortem less than 12 h after capture. Premeasurement storage and transport methods followed those of other studies evaluating preservation effects on larval fish collected in the field (Shields and Carlson 1996; Fisher et al. 1998; Paradis et al. 2007) rather than being received from a hatchery or reared directly in the laboratory (e.g., Greszkiewicz and Fey 2018). There was one exception: both reservoirs were stocked with larger hatchery-pond-reared fingerling Walleye (25–40 mm) in June, and subsamples of these fish from the hatchery were transported live back to the laboratory for immediate measurement and preservation after euthanasia with Aqui-S.
Walleye and Gizzard Shad were selected haphazardly for analysis. The total length (TL) of all fish <14 mm was measured to the nearest 0.01 mm using a stereo microscope equipped with an Infinity X camera and corresponding Xfinity Analyze software (2021; Teledyne Lumenera). Fish ≥14 mm were measured to the nearest 0.01 mm using digital calipers. Wet weights (WWs) of all sizes of fish were measured using an Ohaus Pioneer digital balance with 0.1-mg precision. Individual fish were first blotted on Kimwipes and placed into a tared beaker of water on the balance to minimize dehydration. Once individual fish weights were recorded, they were removed from the scale, blotted again to remove water, and placed on a clear microscope slide for length measurements. After initial measurements were complete, individual Walleye and Gizzard Shad were stored in scintillation vials containing 95% ethanol and remeasured every 7–10 d following the same protocols as above until preservation effects stabilized. Blotting before and after weighing the fish minimized potential ethanol dilution, and ethanol was not replaced or exchanged inside vials between consecutive measurements. All individuals damaged during repeated measurements were removed from analyses (15.25% of all fish examined). To minimize bias and potential measurement error, only one observer was used to measure and record data.
Consideration of postmortem inflation in body size
We assumed some inflation in body size occurred before initial measurements were taken as a result of overnight storage in freshwater and the cessation of osmoregulation following death (Black 1957; Jennings 1991). Therefore, a subsample of Gizzard Shad (20–28 mm TL; 0.05–0.18 g WW; N = 14) and Black Crappie Pomoxis nigromaculatus (17–30 mm TL; 0.06–0.33 g WW; N = 15) were measured directly after capture in the field, stored in chilled lake water, and remeasured 12 h later to estimate the extent of inflation to correct for this bias in Gizzard Shad and Walleye. Black Crappie were included to broaden the TL and WW range of fish used for this correction and to incorporate a spiny-rayed fish as a surrogate for Walleye, which were no longer vulnerable to the ichthyoplankton nets at the time of sampling (June). Black Crappie were not included in any other component of this analysis. Both species exhibited similar levels of inflation, and data from each were combined. Inflation in TL and WW averaged 3.77% (SE = 0.45) and 15.42% (SE = 1.17), respectively. Inflation was not dependent on body size for either TL or WW (linear regression; R2 = 0.054–0.061; P = 0.223–0.235). Thus, we decreased all TL and WW measurements taken prior to preservation by their respective estimated percent inflation.
To test whether adjusting for inflation effectively removed bias in the initial TL and WW measurements, we compared the effects of preservation on Gizzard Shad requiring adjustment to those on Gizzard Shad not requiring adjustment. The latter group was collected from Chatfield and Cherry Creek reservoirs during daylight and transported live to the laboratory for immediate measurement after euthanasia. We used ANCOVA models implemented in R (R Core Team 2021) in conjunction with the R package “emmeans” (Lenth 2022) to examine whether the linear relationships between unpreserved (response variable) and preserved (once stabilized; independent variable) TLs and WWs differed between the adjusted (10.87–24.45 mm TL and 3.0–104.8 mg WW [N = 32 for both]) and unadjusted (9.46–27.83 mm TL [N = 34] and 1.8–110.0 mg WW [N = 25]) Gizzard Shad for overlapping size ranges of fish. Data for TL met the assumptions of normality (Shapiro–Wilk tests: P ≥ 0.196, α = 0.05), equal variance (Levene's test: P = 0.288), and equal slopes (P for interaction term = 0.066) between groups, and residual plots did not indicate that the data were heteroscedastic. The WW data met the assumptions of equal variance (P = 0.189) and slopes (P = 0.555) between groups, but residual spread increased with weight for both groups resulting in nonnormal residual errors. Therefore, we incorporated a fixed variance structure allowing variance to increase proportionally with weight using the “gls” and “varFixed” functions within the “nlme” (Pinheiro et al. 2018) package in R, which effectively eliminated the heteroscedasticity (Zurr et al. 2009).
Assessment of preservation effects
Estimating time to stabilization
To estimate time to stabilization, we linearly regressed values of (response variable) as a function of days postpreservation (independent variable). The resulting intercept along the horizontal, x-axis (i.e., x-intercept) derived from the fitted model reflected time to stabilization (i.e., days postpreservation when was effectively zero). We used a mixed-effects modeling approach to handle potential among-group variation (not all groups were measured on the same days postpreservation), lack of independence of samples within groups, and heterogeneity of residuals, following the guidance of Zurr et al. (2009). First, we linearized the data by taking the natural log of the independent variable, days postpreservation, which was the only fixed effect in the model (inclusion of species added no value). Next, we fit a model allowing the y-intercept to vary by group (random effects) using the “lme” function within the “nlme” package in R. Convergence was not achieved when also including random slopes, indicating negligible variation in slopes among groups. Note that the fitted random y-intercepts carried no intrinsic meaning (since change at postpreservation day 0 was 0% for all groups) but helped account for among-group variation observed over the first postpreservation interval (varied in duration from 4 to 11 d) and provided a range of plausible derived x-intercept values. Lastly, we incorporated an autoregressive process of order 1.0 (modeled separately for each group) to address temporal correlation within groups and a fixed variance structure to account for increasing residual spread with days postpreservation. This model formulation resulted in minimal patterning and equal spread among residual errors. Our primary estimate for time to stabilization was derived from the fixed-effect component of the model (i.e., x-intercept back-transformed from natural log space). We bounded uncertainty using the minimum and maximum x-intercept values derived from the random-effects component of the model.
RESULTS
Consideration of Postmortem Inflation
The ANCOVA models indicated that our adjustments for postmortem inflation in body size effectively minimized bias from the initial TL and WW measurements. Marginal means did not differ between Gizzard Shad requiring adjustment (GSDa) and Gizzard Shad not requiring adjustment (GSD) for TL (mean TL = 18.04 mm [95% CI = 17.87–18.21 mm] for GSDa and 18.24 mm [18.07–18.41 mm] for GSD; P = 0.094). Similarly, marginal means did not differ between groups for WW (mean WW = 27.0 mg [26.2–27.7 mg] for GSDa and 26.6 mg [25.8–27.4 mg] for GSD; P = 0.325].
Assessment of Preservation Effects
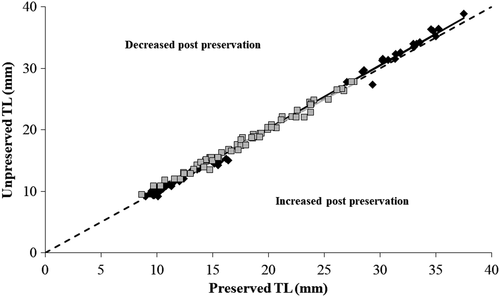
The effects of preservation in 95% ethanol on the TLs of individual fish were variable, and we observed both decreases and increases in TL postpreservation for Walleye (range = −5.90% to +9.76%) and Gizzard Shad (range = −10.47% to +9.70%) across the body sizes examined. However, preservation effects on TL were minimal when averaging across individuals by fitting the weighted linear regression models to unpreserved and preserved TLs. Although slope and intercept values were significantly different from 1.0 and 0.0, respectively (with one exception; Table 1), the relationship between unpreserved and preserved TLs followed a 1:1 line closely for both species despite variability observed at the individual level (Figure 1). For Walleye, a significant slope slightly >1.0 appeared to be driven by fingerling-sized individuals ≥25 mm, which were mostly above the 1:1 line. This indicated a more consistent reduction in length postpreservation by an average of 2.24% (SE = 0.55; range = −4.95% to +7.05% [only one individual's length increased]). Conversely, larval Walleye were more evenly distributed across the 1:1 line and only decreased in length by 0.20% (SE = 0.46) on average. This was less apparent for Gizzard Shad, which decreased in length postpreservation by an average of 1.31% (SE = 0.41) across all sizes of fish.
| Species and size-group | N | Mean ± SDa | Rangea | Slope | 95% CI (slope) | Intercept | 95% CI (intercept) | R 2 |
|---|---|---|---|---|---|---|---|---|
| Total length (mm) | ||||||||
| Larval Walleye <25 mm | 64 | 11.34 ± 2.16 | 9.02–16.43 | 1.024 | 1.009–1.040 | −0.226 | −0.463 to +0.012 | 0.995 |
| Pond-reared fingerling Walleye ≥25 mm | 20 | 32.05 ± 2.67 | 27.03–37.53 | |||||
| Gizzard Shad (all sizes) | 66 | 17.95 ± 4.66 | 8.67–27.70 | 0.961 | 0.934–0.987 | 0.891 | 0.424–1.357 | 0.988 |
| Wet weight (mg) | ||||||||
| Walleye ≤21 mg | 64 | 3.4 ± 3.1 | 0.7–11.9 | 2.465 | 2.337–2.592 | 1.797 | 1.473–2.121 | 0.959 |
| Walleye >21 mg | 20 | 140.2 ± 36.9 | 90.2–215.9 | 1.438 | 1.374–1.501 | 36.245 | 27.010–45.394 | 0.992 |
| Gizzard Shad ≤21 mg | 50 | 6.1 ± 5.3 | 0.3–20.4 | 2.724 | 2.602–2.845 | 2.143 | 1.714–2.572 | 0.976 |
| Gizzard Shad >21 mg | 16 | 54.1 ± 25.2 | 24.6–99.5 | 1.471 | 1.210–1.731 | 35.737 | 22.382–49.092 | 0.907 |
- a Summary of preserved measurements (once stabilized).

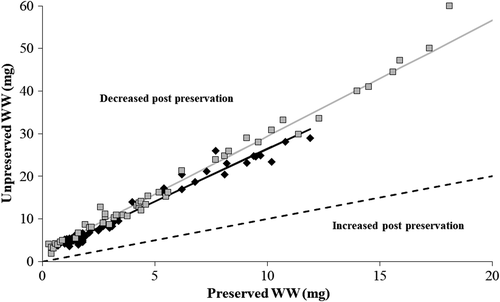
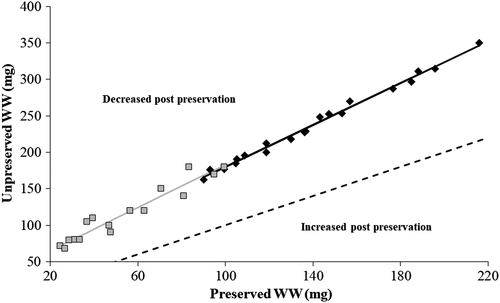
Unlike TLs, changes in WWs postpreservation in 95% ethanol were notable and in a consistent direction. The WWs of Walleye and Gizzard Shad ≤21 mg (preserved) decreased by an average of 69.61% (SE = 0.82; range = 56.46–83.45%) and 70.65% (SE = 1.02; range = 61.47–92.61%), respectively. As a result, the relationships between unpreserved and preserved WWs diverged significantly from a 1:1 line and exhibited slope and intercept values significantly greater than 1.0 and 0.0, respectively (Table 1; Figure 2). Decreases in WWs were less extreme for Walleye and Gizzard Shad >21 mg (preserved), but relationships between unpreserved and preserved WWs still deviated significantly from a 1:1 line (Table 1; Figure 3). Overall, decreases in WWs averaged 41.53% (SE = 1.47; range = 37.68–47.19%) for Walleye and 55.90% (SE = 1.72; range = 46.00–65.78%) for Gizzard Shad over the larger weight range.


Time to Stabilization
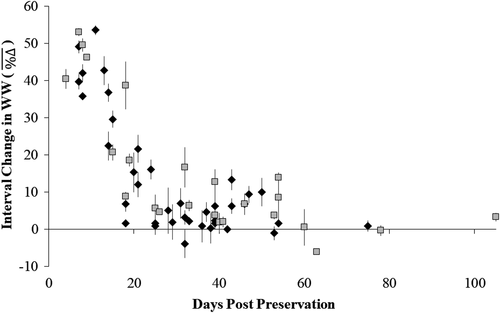
The effects of preservation in 95% ethanol on the WWs of Walleye and Gizzard Shad stabilized at similar rates. The rate of change in WW was most rapid during the first 15–30 d of preservation and then slowed (Figure 4). The fitted linear mixed-effects model between values and days postpreservation (dpost) indicated that Walleye and Gizzard Shad collectively displayed no further reductions in WW after approximately 50 dpost, based on the back-transformed x-intercept derived from the fixed-effect component of the model [; N = 63; P < 0.001]. Fitted random y-intercepts from each collection group ranged between 83.35% and 95.71% (N = 10; SD = 5.54). When combined with the estimated slope coefficient from the fixed-effect component of the model (−23.17), derived x-intercept values ranged from 37 to 62 dpost.

DISCUSSION
Changes in the TLs of individual Walleye and Gizzard Shad larvae and fingerlings after preservation in 95% ethanol were measurable (~5–10%) but occurred in both directions (decreases and increases observed), resulting in minimal effects when averaging across individuals. Conversely, we observed consistent, biologically significant reductions in WW ranging from ~40% to 70% depending on fish size (larger proportional reductions were observed in smaller fish). The magnitudes of decreases in WWs were similar between species and required at least 2 months to stabilize. Therefore, to appropriately use the size-dependent linear relationships between unpreserved and preserved WWs developed in this study to correct for the effects of preservation in 95% ethanol, we suggest taking postpreservation measurements after at least 62 d (estimated upper bound for time to stabilization) to ensure that preserved fish weights have stabilized. Without waiting for at least 62 d, our regression models may overcorrect for loss in weight. Because reductions in TL were <2.5% on average across species, using our regression models to estimate unpreserved TLs should be less sensitive to the timing of postpreservation measurements, and we leave it to practitioners to determine whether these reductions in length are biologically relevant. However, results from this study now provide the information needed to account for the effects of a common preservative when necessary.
The effects of preservation observed in our study generally aligned with those reported for several fish species, with some exceptions. Others observed that smaller fish exhibited greater reductions in length and weight postpreservation when compared with larger individuals (Theilacker 1980; Johnston and Mathias 1993; Fey 1999; Korwin-Kossakowski 2014). We observed this same pattern in the WWs of larval and fingerling Walleye and Gizzard Shad, but such patterns were not as pronounced in the TLs of Gizzard Shad and opposite in the TLs of Walleye (fingerling-sized fish exhibited slightly greater reductions in length on average than larvae). In addition, other studies reported the highest rate and magnitude of change in TL and WW within the first several days or hours of preservation, with limited changes thereafter (Fisher et al. 1998; Fey 1999; Smith and Walker 2003; Paradis et al. 2007). Although fish weights in our study changed most rapidly during early periods of preservation, we observed that significant changes could still occur weeks after initial preservation but may depend on the concentration or type of preservative used. To our knowledge, there has been no explicit statistical characterization of how long it takes preservation effects to stabilize in larval fish preserved in 95% ethanol. Similar responses observed from Walleye and Gizzard Shad suggest that time to stabilization in 95% ethanol could be general across species but requires further investigation to confirm.
The extent of changes in the TLs and WWs of larval Walleye and Gizzard Shad observed in this study were on the same order as other co-occurring species preserved in ethanol, but differences in methodology can complicate comparisons among studies and species. For example, larval Yellow Perch Perca flavescens sampled with a 500-μm-mesh push net and stored in 75% ethanol decreased in TL by 9.6% and in WW by 61.1% on average 15 d after preservation—some additional minor decreases were observed 8 months after preservation (Paradis et al. 2007). Fisher et al. (1998) observed 11.5–14.3% reductions in the TLs of larval Yellow Perch stored in 50–100% ethanol after capture in an ichthyoplankton net similar to that used by Paradis et al. (2007). These responses were relatively insensitive to the concentration of ethanol used and stabilized within 5–10 d, but measurements were not taken after 21 d. Similar to our approach, both studies took initial measurements prior to preservation on fish postmortem after storage and transport to the laboratory in lake water over a period of hours. However, neither tested or corrected for potential osmotic inflation or hydration (described in Methods), which may partially explain the greater reductions observed on the TLs of larval Yellow Perch when compared with Walleye in this study but does not discount the potential influence of other species-specific or methodological differences. Factors related to fish physiology (e.g., internal osmolarity or fat and lipid content), morphology (e.g., myomere count), size (i.e., surface area), and field sampling (e.g., trawls versus seines) or laboratory (e.g., mode of euthanasia) methodology could influence the effects of preservation and contribute to variability across individuals, species, and studies, but research on these topics is generally limited (but see Baltasar et al. 2021 for discussion of similar topics as they relate to fish freezing). Thus, we caution readers about applying our models to other species and encourage further species-specific research to contribute to the literature on these various topics.
Responses to preservation may depend on how experimental fish are collected. Interestingly, Glenn and Mathias (1987) reported consistent 4–11% decreases in the mean TLs of Walleye ranging from 9.6 to 31.6 mm after only 3 d postpreservation in 70% ethanol. Although responses observed in our study were on the same order at the individual level after approximately 2 months, changes consistently occurred in both directions so effects were minimal when averaging across individuals. Greszkiewicz and Fey (2018) observed a 3.4% decrease on average in the lengths of larval Northern Pike Esox lucius 90 d after preservation in 96% alcohol. These two studies used fish maintained live in laboratory tanks or beach seined live from hatchery ponds prior to preservation, rather than captured with a pushed or towed ichthyoplankton net in the field. Pushed or towed nets can influence the response of larval fish to preservation, perhaps due to damage or other physical changes that might occur during the towing or sample extraction process (Theilacker 1980; Fey 1999). Thus, practitioners should consider the methodological details of preservation studies before application of correction factors. Here, our field methods reflected those commonly used in studies evaluating recruitment bottlenecks in Walleye (Quist et al. 2003; Gostiaux et al., in press), and we accounted for potential artifacts arising during premeasurement storage and transport from the field to laboratory.
ACKNOWLEDGMENTS
We thank Bill Pate, Collin Farrell, and Lilliana Boyer-Rosales for assistance during field collections. We also thank the editors and reviewers for constructive comments that improved this manuscript. Project support was provided by Colorado Parks and Wildlife. There is no conflict of interest declared in this article.


