Northern Madtom Use of Artificial Reefs in the St. Clair–Detroit River System
Abstract
The St. Clair and Detroit rivers historically supported abundant fish populations. However, like many river systems, these rivers have been greatly altered through the creation of navigation channels and other anthropogenic disturbances, resulting in the loss of fish and wildlife habitat and declines in native fish populations. To ameliorate this environmental degradation, artificial fish spawning reefs were constructed in the St. Clair and Detroit rivers. One native species to potentially benefit from artificial reefs is the Northern Madtom Noturus stigmosus, a small ictalurid that is listed as endangered in the state of Michigan and the province of Ontario. Between 2016 and 2018, artificial reefs and nearby control sites were sampled in the St. Clair and Detroit rivers to compare the number of Northern Madtoms. In total, 171 Northern Madtoms were captured in 1,848 minnow traps with one of four bait types: cheese, dog food, worms, or control (no bait). Baited minnow traps successfully captured Northern Madtoms in the fast-flowing, deep water of the St. Clair–Detroit River system, and catch rates were significantly higher when traps were baited with worms. The number of Northern Madtoms captured was lower in the Detroit River than in the St. Clair River and increased with increasing water temperature and turbidity. Artificial reefs constructed in the St. Clair–Detroit River system are providing habitat for Northern Madtoms; however, use did not differ between reef sites and nearby control sites. This work provides insight regarding sampling strategies to target Northern Madtoms in large-river systems and highlights the importance of incorporating a temporal sampling strategy into survey design.
The St. Clair–Detroit River system (SCDRS) historically supported an abundant fishery (Baldwin et al. 2009); however, like many other river systems, these rivers have been greatly altered (Bennion and Manny 2011). Serving as the connecting waterways between Lakes Huron and Erie, deep channels were constructed in the SCDRS beginning in the late 1800s and continue to be maintained for large vessels (Bennion and Manny 2011). Dredging of these channels resulted in damage to natural limestone reefs and the loss of rocky habitat that is important for many native fish species, such as Lake Sturgeon Acipenser fulvescens and Lake Whitefish Coregonus clupeaformis (Caswell et al. 2004; Roseman et al. 2007, 2011; Fischer et al. 2018). Habitat loss and subsequent alterations in the fish assemblages contributed to the designation of both the St. Clair and Detroit rivers as Great Lakes Areas of Concern under the Great Lakes Water Quality Agreement (Manny 2003; Hartig et al. 2009; USEPA 2019). To remediate this environmental degradation and delist the St. Clair and Detroit rivers as areas of concern, large-scale habitat restoration efforts were initiated (Manny et al. 2015).
Artificial spawning reefs were constructed in the SCDRS to increase the amount of suitable habitat available for native fish species (Vaccaro et al. 2016). Since 2004, eight reefs have been constructed and have added more than 8.3 ha of habitat to the system. While the reefs were originally designed to increase spawning habitat for Lake Sturgeon, Lake Whitefish, and Walleye Sander vitreus (Roseman et al. 2011; Vaccaro et al. 2016; Fischer et al. 2018), other species, such as the native Northern Madtom Noturus stigmosus, could also benefit (Manny et al. 2014; Conard 2015).
The Northern Madtom is a small ictalurid that is listed as globally vulnerable and is endangered in the state of Michigan and the province of Ontario (Taylor 1969; Latta 2005; COSEWIC 2012; NatureServe 2019). Native to North America, Northern Madtoms can be found in waters of the Ohio River, Mississippi River, and Great Lakes basins (Taylor 1969; Parsons 1994; Scheibly et al. 2008). Northern Madtoms are naturally uncommon and are often found in small, isolated populations (MacInnis 1998; Scheibly et al. 2008). The Northern Madtom is considered extirpated from some of its range, and the species is in decline in the northern part of its range (Goodchild 1993; Holm and Mandrak 1998; Latta 2005). Northern Madtoms occupy a wide range of habitat and environmental conditions. They are found in small streams to large rivers and lakes with slow to strong currents (Taylor 1969; Goodchild 1993; Parsons 1994; Manny et al. 2014). Although Northern Madtoms are cavity nesters (Taylor 1969; MacInnis 1998), they have been documented using mud, sand, gravel, and rock substrates for spawning (Scheibly et al. 2008; Manny et al. 2014). Since much of the rocky substrate has been removed from the SCDRS, the construction of artificial spawning reefs may provide additional spawning habitat for Northern Madtoms.
A variety of gear types have been used to sample Northern Madtoms throughout their range. In the southern and eastern portions of their range, Northern Madtoms are found in small, shallow streams, and researchers have used backpack electrofishing, seines, dip nets, and gee-style minnow traps as capture techniques (Parsons 1994; Tzilkowski and Stauffer 2004; Wagner et al. 2019). Wagner et al. (2019) found backpack electrofishing to be the most efficient method for detecting five madtom species in shallow Mississippi streams, while minnow traps were the least efficient gear for detecting madtoms. In the northernmost part of the Northern Madtom’s range (i.e., the SCDRS), trawls, gill nets, boat electrofishing, and minnow traps have captured this species (COSEWIC 2012; Manny et al. 2014; Conard 2015). However, due to the nature of these large rivers, minnow traps were the most effective gear for catching Northern Madtoms (Manny et al. 2014; Conard 2015).
Little research has occurred to document habitat preferences, bait types used for collections, or other sampling strategies targeting Northern Madtoms in large riverine systems like the SCDRS (Manny et al. 2014; Conard 2015; Lamothe et al. 2020). To determine whether artificial reefs constructed in the SCDRS benefit Northern Madtoms, the objectives of this study were to (1) compare the CPUE of Northern Madtoms between reef sites and nearby control sites in the St. Clair and Detroit rivers, (2) evaluate whether the CPUE of Northern Madtoms is dependent upon environmental factors at reef and nearby control locations, and (3) determine whether Northern Madtom CPUE is dependent on minnow trap bait type (cheese, dog food, worms, or control [no bait]).
METHODS
Study area
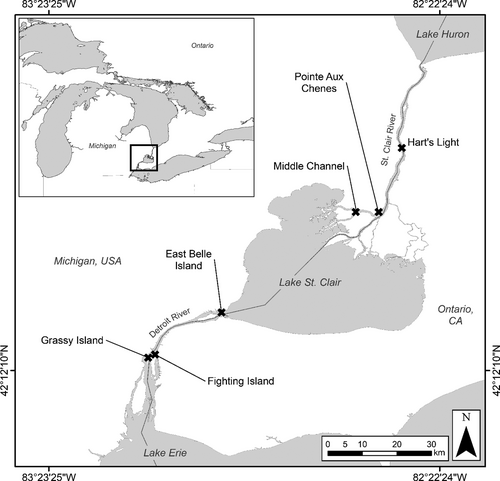
This study was conducted in the SCDRS, which represents the 140-km-long connecting channel between Lakes Huron and Erie and includes the St. Clair River, Lake St. Clair, and the Detroit River (Figure 1). Flow is primarily driven by the difference in water levels between Lakes Huron and Erie, resulting in relatively consistent discharge (5,300 m3/s) and flow rates over time (Derecki 1984; Edsall et al. 1988; Fischer et al. 2015). Currently, the U.S. Army Corps of Engineers maintains the shipping lanes in the SCDRS with periodic dredging to ensure depths between 8.2 and 9.1 m at the low-water datum. Sampling locations in the Detroit River included the East Belle Isle, Fighting Island, and Grassy Island reefs. Sampling sites in the St. Clair River included the Pointe Aux Chenes, Hart’s Light, and Middle Channel reefs (Figure 1; Table 1). The reefs are located in water greater than 5 m in depth; are composed of 10–20-cm-diameter, loosely piled limestone and cobble about 1 m thick; and range in size from 0.4 to 1.6 ha (Vaccaro et al. 2016).
| Artificial reef |
Year constructed |
Reef size (ha) | Water depth (m) |
Construction material |
|---|---|---|---|---|
| Detroit River | ||||
| East Belle Isle | 2016 | 0.4 | 5.0 | 10–20-cm limestone |
| Fighting Island | 2008, 2013 | 0.8 | 5.0–10.0 | 10–20-cm limestone and rounded fieldstone |
| Grassy Island | 2015 | 1.6 | 7.3–8.2 | 10–20-cm limestone |
| St. Clair River | ||||
| Pointe Aux Chenes | 2014 | 0.6 | 12.2–15.2 | 10–20-cm limestone |
| Hart’s Light | 2014 | 1.5 | 11.3–14.6 | 10–20-cm limestone |
| Middle Channel | 2012 | 0.4 | 7.6–9.1 | 10–20-cm limestone and rounded fieldstone |
Minnow trapping
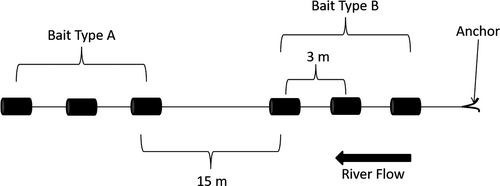
Baited, galvanized gee minnow traps with 30-mm openings were used to compare the Northern Madtom CPUE between artificial reefs and control sites in the St. Clair and Detroit rivers during three sampling events in summer (August) 2016. In 2017 and 2018, sampling was expanded to once per month for 5 months (May, June, July, August, and October) to cover a longer temporal scale and identify potential differences in seasonal habitat use. Each year, three artificial reef sites and three nearby control sites were sampled in each river (a total of six sites per river). Located in close proximity to the reef sites, control sites were chosen to mimic the water conditions (water depth and water velocity) of each corresponding reef. Twelve traps were set overnight at each site using four different bait types (cheese, dog food, worms, and control [no bait]). Three minnow traps of a given bait type were clipped to a main line approximately 3 m apart from one another. Approximately 15 m separated minnow traps with different bait types. The main line was anchored to the river bottom at both the upstream and downstream ends, and all anchors were attached to buoys. All gear was fished parallel to the river flow (Figure 2).
Traps were baited with five to six Colby-Jack cheese cubes, 170.1 g (6 oz) of dry kibble dog food, three worms (nightcrawlers), or no bait (control) to determine the bait preference of Northern Madtoms. The cheese and dog food were placed directly into the traps. The worms were cut into three pieces and placed into a mesh bait bag. The order of bait placement on each line was determined using a random number generator, and the order of bait varied by site and sampling event.

Habitat sampling
Due to high water velocity, the Quanta Hydrolab (OTT Hydromet, Loveland, Colorado) could not reach the bottom of the river; therefore, water quality data (temperature, pH, conductivity, dissolved oxygen, and turbidity) were collected at each site 1 m below the surface. Water velocity (m/s) at each site was measured at a depth of six-tenths of the water column using an OTT MF Pro flowmeter (OTT Hydromet). When water velocity was not recorded, the average of measurements collected at a site was used. In total, 32 of 151 water velocity measurements were predicted using the average. Due to the low variability and consistent flow rates in the SCDRS, we feel that the predicted measurements accurately represented the water velocity at each site during each sampling period (Derecki 1984; Edsall et al. 1988; Fischer et al. 2015). Secchi depth (nearest 0.25 m) was recorded as a measure of water turbidity.
The substrate at each site was determined by underwater video. A HERO3 GoPro camera (GoPro, San Mateo, California) was attached to a 23-kg weighted bullet and was lowered to the bottom using a davit and winch. Video began at the upstream-most minnow trap and continued to the downstream-most minnow trap. As the boat drifted downstream, the winch was raised and lowered to ensure that the camera remained slightly (<1 m) above the river bottom. To determine the type and amount of substrate at each reef and control site, a random number generator was used to select 20 time points (images) within each video. Each time point was analyzed within ±5 s to capture a clear image of the substrate. The types and percentages of substrates within each clear image were visually estimated by two readers. Using a calibration tool on the top of the bullet, the substrate in each image was categorized based on a modified Wentworth classification system: fine sediment (<2 mm in diameter), gravel (between 2 and 64 mm), cobble (between 64 and 256 mm), boulder (>256 mm), and dreissenids (living or dead shells of dreissenid mussels). These categories were then averaged for each image to determine the dominant substrate at each site. At sites where dreissenids were listed as the dominant substrate, the images nearly always indicated that the site was completely covered with shells. Underwater video of the substrate at each reef and control site was collected in 2016 and 2017. However, due to high turbidity and low visibility in fall 2018, video could not be collected during that period. Because the dominant substrate type at each site did not change from 2016 to 2017, we used the 2017 data as the dominant substrate type for 2018.
Statistical analysis
Counts of Northern Madtoms at each site were analyzed using generalized linear mixed models. Due to a high number of instances in which Northern Madtoms were not detected (62%) in this count data, we evaluated whether a Poisson distribution, a negative binomial distribution, or zero-inflated versions of these distributions were best suited to the data. Continuous factors were Z-transformed to help compare the magnitude of effect between factors and to increase the likelihood of model convergence. A chi-square test was performed on the most parameterized model, and an offset, log(minnow trap effort), was added to account for differences in effort (i.e., time [trap-hours] for which minnow traps were fished). The goodness-of-fit test indicated that the Poisson model did not adequately fit the data (χ2 = 250.4, P < 0.001; dispersion ratio = 1.83). When fitting zero-inflated negative binomial models, the models would not converge, indicating overparameterization. As a result, the negative binomial distribution was used.
In total, 35 candidate models were developed with water temperature (°C), Secchi depth (m), water velocity, substrate, Round Goby Neogobius melanostomus CPUE, spawning period, river, month, site, and reef/control as factors in the analysis. Month and site were treated as random effects, while all other factors were treated as fixed effects. River was treated as a fixed effect because there were only two levels (St. Clair and Detroit rivers) and estimating the variance on two levels of a random effect would likely be very imprecise (Hodges 2016). Northern Madtoms have been documented as spawning from mid-June to early August at water temperatures ranging between 23°C and 25°C (MacInnis 1998; Scheibly et al. 2008). However, since the spawning temperature window may change depending on the system and given evidence of spawning-ready females at water temperatures less than 23°C during this study (our unpublished data), we defined the presumed spawning period as occurring when water temperatures were between 21°C and 26°C. Northern Madtoms are nocturnal and were caught in a variety of water clarity conditions (Parsons 1994; COSEWIC 2012); therefore, Secchi depth was assessed to determine whether catch rates increased during times of higher turbidity. Water velocity was included as a factor in the models even though Northern Madtoms have been found in a range of flow conditions (Parsons 1994; Scheibly et al. 2008). As Northern Madtoms are crevice spawners (Taylor 1969; MacInnis 1998; Scheibly et al. 2008), we included substrate type as a factor in the candidate model set to determine whether the number of Northern Madtoms increased on the rocky substrate of the reefs. To assess whether substrate use was dependent upon spawning period, we added a substrate × spawning period interaction factor in the analysis. Round Goby CPUE, calculated using the same equation defined above for Northern Madtoms, was included because the presence of this invasive species has been negatively associated with the presence of Northern Madtoms in the St. Clair River (Lamothe et al. 2020). Reef/control and river were included in the models to determine whether the number of Northern Madtoms was related to effects not accounted for by the physical factors sampled.
An information theoretic approach was used to compare models. Models were ranked according to a bias-corrected version of Akaike’s information criterion (AICc). Models were then compared using the difference between AICc(i) and AICc(min) (ΔAICc) and AICc weights (Wi); (Burnham and Anderson 2002). The Wi values for each factor were summed over all models to determine the importance of each in the candidate model set. Model-averaged coefficients, SEs, and 95% CIs were calculated using the subset of models with ΔAICc values less than 7. Model-averaged coefficients were calculated by multiplying the Wi of each model by the model coefficient. These results were then summed across all models to obtain a weighted average of the coefficient. Since the model weights summed to 1.0, they were not renormalized (Burnham and Anderson 2002). The significance of individual factors was tested by examining the 95% CIs of the regression coefficients. When the model-averaged 95% CI of an individual factor’s regression coefficient did not contain zero, the factor was considered to significantly predict the number of Northern Madtoms (Anderson 2008). All data analyses were performed in program R (R Foundation for Statistical Computing, Vienna) by using the packages glmmTMB (Brooks et al. 2017), performance (version 0.4.7; Lüdecke et al. 2021), and MuMIn (version 1.43.17; Barton 2020).
Statistical tests were performed to compare the Northern Madtom CPUE between bait types. Shapiro–Wilk tests revealed that the data were not normally distributed, thus warranting the use of nonparametric tests. Kruskal–Wallis tests were used to compare CPUE among bait types. When significant differences were detected, Dunn’s multiple comparison test was conducted. An α of 0.05 was used for all tests.
RESULTS
Northern Madtom CPUE Comparisons
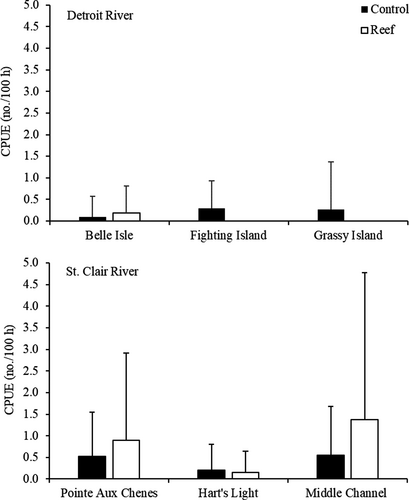
A total of 30 Northern Madtoms (range = 32–144 mm TL; average = 98 mm TL; Figure 3) were captured in 936 minnow traps that were fished in the Detroit River between August 2016 and October 2018, with a total effort of 22,491 trap-hours. Water temperature ranged from 7.7°C to 25.4°C during the sampling period (Table 2). Northern Madtoms were captured at all three control sites (Belle Isle: n = 3; Fighting Island: n = 12; Grassy Island: n = 10) and at only one reef site (Belle Isle: n = 5; Figure 3). At least one Northern Madtom was captured during each of the 5 months sampled in 2017 and 2018 in the Detroit River. However, the majority (60%) of Northern Madtoms in the Detroit River were collected during October (n = 18; Figure 4).
| Site | Type | Depth (m) | Water velocity (m/s) | Secchi depth (m) | Temperature range (°C) | Substrate |
|---|---|---|---|---|---|---|
| Detroit River | ||||||
| East Belle Isle | Control | 8.56 | 0.38 | 2.75 | 9.13–25.33 | Dreissenids |
| Reef | 6.70 | 0.60 | 2.77 | 7.71–24.73 | Cobble | |
| Fighting Island | Control | 9.23 | 0.56 | 2.35 | 9.60–25.76 | Fine sediment |
| Reef | 8.69 | 0.81 | 2.27 | 9.65–25.69 | Cobble | |
| Grassy Island | Control | 8.12 | 0.30 | 2.12 | 9.43–27.73 | Fine sediment |
| Reef | 8.60 | 0.62 | 2.48 | 8.63–25.85 | Cobble | |
| St. Clair River | ||||||
| Pointe Aux Chenes | Control | 11.99 | 0.47 | 2.82 | 10.24–23.96 | Fine sediment |
| Reef | 13.19 | 0.72 | 3.02 | 10.24–24.15 | Cobble | |
| Hart’s Light | Control | 10.70 | 0.94 | 3.58 | 10.10–23.72 | Dreissenids |
| Reef | 14.83 | 1.22 | 3.64 | 10.10–23.72 | Dreissenids | |
| Middle Channel | Control | 12.14 | 0.50 | 2.92 | 10.40–24.10 | Dreissenids |
| Reef | 10.60 | 0.50 | 2.94 | 10.40–24.10 | Fine sediment | |
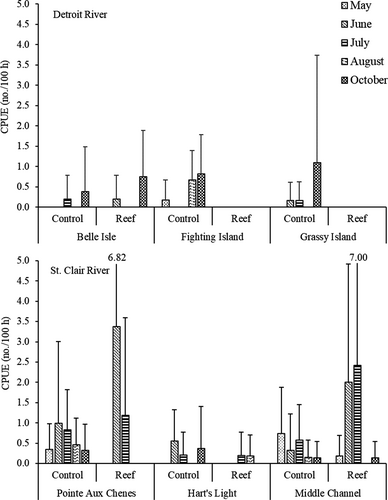
A total of 141 Northern Madtoms (range = 52–138 mm TL; average = 106 mm TL) were captured in 912 minnow traps in the St. Clair River between August 2016 and October 2018, with a total effort of 21,675 trap-hours. Water temperature ranged from 9.6°C to 23.8°C during the sampling period (Table 2). Northern Madtoms were captured at all reef sites (Middle Channel: n = 56; Pointe Aux Chenes: n = 33; Hart’s Light: n = 4) and control sites (Middle Channel: n = 22; Pointe Aux Chenes: n = 19; Hart’s Light: n = 7) in the St. Clair River, with reef sites capturing more individuals except at Hart’s Light (Figure 3). Northern Madtoms were captured during each of the 5 months sampled in 2017 and 2018 within the St. Clair River. The majority of the Northern Madtoms were captured in June (n = 43), followed by July (n = 34; Figure 4). Water temperature during the June sampling events ranged from 16.2°C to 17.7°C. July water temperature ranged from 21.1°C to 21.8°C (Table 2).
The model that best explained the number of Northern Madtoms was the full model, which included the factors water temperature, Secchi depth, water velocity, substrate, Round Goby CPUE, spawning period, river, and reef/control (Table 3). Site and month were included as random effects in each model. However, since the top-10 models all had ΔAICc values less than 7, all factors within these models were evaluated. The Wi summed across the top-10 models was highest for river (0.91), followed by Secchi depth (0.81) and then substrate (0.60; Table 3). Model averaging revealed that water temperature, Secchi depth, spawning period, and river were significant predictors of Northern Madtom catch rates (Table 4). However, the relative importance of spawning period (0.38) and water temperature (0.41) was low compared to the other significant factors when ranked by Wi. River was present in the top-five models and Secchi depth was a factor in eight models, while water temperature was only present in three models and spawning period was present in one model.
| Model | Factors | K | AICc | Log likelihood | ΔAICc | Wi |
|---|---|---|---|---|---|---|
| 1 | Water temp, Secchi, Water velocity, Substrate, Round Goby CPUE, Spawning period, Spawning period × Substrate, River, Reef/control | 15 | 385.51 | 175.98 | 0.00 | 0.38 |
| 2 | Secchi, River | 6 | 386.23 | −186.82 | 0.72 | 0.27 |
| 3 | Substrate, River | 7 | 387.96 | −186.59 | 2.45 | 0.11 |
| 4 | Secchi, River, Reef/control | 7 | 388.26 | −186.74 | 2.74 | 0.10 |
| 5 | Substrate, River, Reef/control | 8 | 389.67 | −186.33 | 4.15 | 0.05 |
| 6 | Water velocity, Substrate, Secchi | 8 | 391.07 | −187.03 | 5.55 | 0.02 |
| 7 | Water temp, Substrate, Secchi | 8 | 391.29 | −187.14 | 5.78 | 0.02 |
| 8 | Secchi, Substrate | 7 | 391.40 | −188.31 | 5.89 | 0.02 |
| 9 | Water temp, Secchi | 6 | 392.01 | −189.71 | 6.50 | 0.01 |
| 10 | Secchi | 5 | 392.50 | −191.04 | 6.98 | 0.01 |
| Factor | Estimate | SE | 95% CI |
|---|---|---|---|
| Water temperature* | 1.20 | 0.46 | 0.30 to 2.10 |
| Secchi depth* | −0.56 | 0.19 | −0.93 to −0.18 |
| Water velocity | 0.00 | 0.24 | −0.48 to 0.47 |
| Substrate–dreissenids | −0.61 | 0.72 | −2.02 to 0.81 |
| Substrate–fines | 0.50 | 0.60 | −0.68 to 1.68 |
| Round Goby CPUE | 0.05 | 0.24 | −0.42 to 0.51 |
| Spawning period–yes* | −2.27 | 0.79 | −3.81 to −0.73 |
| Spawning period–yes × Substrate–dreissenids | 0.40 | 0.84 | −1.25 to 2.05 |
| Spawning period–yes × Substrate–fines | 0.48 | 0.74 | −0.98 to 1.93 |
| River–St. Clair River* | 2.21 | 0.59 | 1.05 to 3.37 |
| Reef/control–reef | −0.27 | 0.52 | −1.29 to 0.74 |
Bait Type
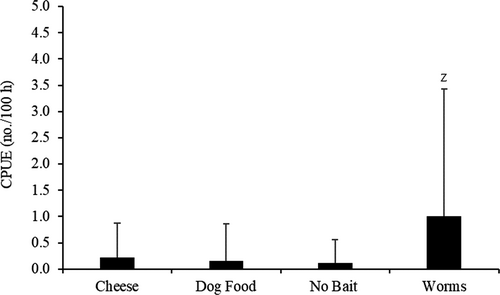
Northern Madtoms were captured with each of the four bait types (Figure 5). However, worms captured significantly more Northern Madtoms than any other bait type (H = 44.823, df = 3, P < 0.001; worms versus cheese: Z = −4.398, P < 0.001; worms versus dog food: Z = −5.753, P < 0.001; worms versus no bait: Z = 5.783, P < 0.001). Of the 171 Northern Madtoms that were captured in minnow traps, 115 (67%) were captured in traps baited with worms (CPUE = 1.010 fish/100 trap-hours). Minnow traps baited with cheese captured 26 fish (CPUE = 0.223 fish/100 trap-hours), traps with dog food captured 17 fish (CPUE = 0.155 fish/100 trap-hours), and traps with no bait captured 14 fish (CPUE = 0.118 fish/100 trap-hours). There was no statistical difference in Northern Madtom CPUE between any other bait types (cheese versus dog food: Z = 1.355, P = 0.088; cheese versus no bait: Z = 1.385, P = 0.083; dog food versus no bait: Z = 0.030, P = 0.488).
DISCUSSION
Northern Madtoms may not use artificial spawning reefs more than the control sites. This result was surprising given that Northern Madtoms are cavity nesters and the 10–20-cm limestone at each of these reefs would seemingly provide adequate spawning and refuge habitat (MacInnis 1998; Scheibly et al. 2008). However, this result may be attributable to the spatial scale at which our study took place. Each of the control sites sampled were within 1.0 km of the corresponding reef site. Manny et al. (2014) documented Northern Madtoms moving 2.0 km across the channel in the Detroit River. If more areas of the SCDRS had been sampled, a decrease in Northern Madtoms might have been observed with increasing distance from the artificial reefs. Conard (2015) used minnow traps to determine the presence and abundance of Northern Madtoms at rocky habitats within the SCDRS. However, no sites in the Detroit River and only one similar site in the St. Clair River (Middle Channel reef) were sampled in the current study. Contrary to our study, Conard (2015) found that Northern Madtoms were only captured in rocky habitats; however, sampling in other habitat types was limited to 2 d, suggesting that increased effort could have improved the detection of Northern Madtoms in other areas. It should be noted that the rocky substrate at the Middle Channel reef site has been filled in by sediment since reef construction in 2012 and is now characterized by fine sediment (this study; Fischer et al. 2018). A total of 56 Northern Madtoms were captured at the Middle Channel reef site—more than at any other location. Although spawning was not observed at the Middle Channel reef site, spawning in other systems has been observed to take place in cavities of fine sediment under rock and artificial substrates (MacInnis 1998; Scheibly et al. 2008). Since no relationship was observed between the number of Northern Madtoms and substrate or location type (reef/control), our data suggest that the use of artificial reefs is similar to the use of control sites in the SCDRS.
Results comparing Northern Madtom use of artificial reefs between months and relative to the spawning period were difficult to interpret. Overall, more Northern Madtoms were captured in the St. Clair River and their use of artificial reefs in that river varied by month. The average CPUE of Northern Madtoms was greater at the Pointe Aux Chenes and Middle Channel reef sites in June and July compared to control sites (Figure 4). Conard (2015) also found that Northern Madtom catch rates were highest during June and July even though those rates were not statistically different from the catch rates in May and August, the other two months sampled in that study. These months were within the reported spawning period for Northern Madtoms (MacInnis 1998; Scheibly et al. 2008); however, when specifically testing for a relationship between spawning period and Northern Madtom CPUE, there was a significant negative association. We hypothesized that the number of Northern Madtoms captured would increase during the spawning period, especially at reef sites, where they may use the large rocky substrate for spawning. It is possible that the water temperature range used as a predictor of Northern Madtom spawning in the current study was not appropriate. We observed spawning-ready Northern Madtoms at water temperatures less than 21°C; therefore, spawning may be taking place at cooler water temperatures than reported. Water temperature during Northern Madtom spawning should be evaluated in this system. Furthermore, the spawning period factor was only present in the top model containing 0.38 of the weight (Wi), and the Northern Madtom CPUE was 0.40 fish/100 trap-hours (SD = 0.95; n = 96) during the spawning period compared to 0.37 fish/100 trap-hours (SD = 0.74; n = 75) during the nonspawning period. These results suggest that spawning period was acting as a pretending variable, and the negative association between spawning period and the number of Northern Madtoms captured should be viewed cautiously.
Catch rates at the Hart’s Light reef site were similar to those at the control location. The overall catch rates at Hart’s Light were also generally lower than those at other locations in the St. Clair River. While Northern Madtoms have been detected in a wide range of water velocities, the average values of water velocity at the Hart’s Light reef and control sites were 1.22 and 0.94 m/s, respectively. The water velocity at the control site was 0.22 m/s greater than the velocity observed at any other site in the St. Clair River. Although water velocity was not a significant predictor of the number of Northern Madtoms, one possible explanation for the lower catch rates at Hart’s Light is that Northern Madtoms avoid water velocities in this range (Scheibly et al. 2008; COSEWIC 2012). Another possible reason for the lower catch rates at Hart’s Light could be sampling inefficiency. The gee-style minnow traps used in this study were not weighted. Therefore, at higher water velocities, the minnow traps could have been bouncing off the bottom and may not have fished as effectively as they did at other locations with lower water velocities. Further evidence of sampling inefficiency was indicated by the low numbers of other fish species captured at Hart’s Light.
Contrary to the spawning period results, water temperature had a significant positive relationship with the number of Northern Madtoms captured. These results are similar to those observed by Dextrase et al. (2014) and suggest that sampling during the summer months will lead to increased Northern Madtom catch rates. Secchi depth was also a significant predictor of Northern Madtom catch. The number of Northern Madtoms decreased as Secchi depth increased, indicating a greater number at more turbid sites or increased activity during periods of lower water clarity (Parsons 1994; COSEWIC 2012). When conducting bottom trawls in the St. Clair River, French and Jude (2001) found that Northern Madtom catch rates were higher at night.
Despite the negative effects observed in previous studies, Round Goby CPUE was not a significant factor influencing the number of Northern Madtoms captured in the current study. Negative associations have been observed between Round Goby and Northern Madtoms in the St. Clair River (Lamothe et al. 2020). Additionally, French and Jude (2001) showed that diet overlap between Northern Madtoms and Round Goby was dependent on the water depth of the St. Clair River, with little diet overlap in the deeper areas from 5 to 7 m in depth, corresponding to the depths at which all of our study sites were located.
To our knowledge, this is the first study to examine how bait type influences Northern Madtom catch rates in minnow traps. More Northern Madtoms were captured with worms than any other bait type used in this study. Bait type should be considered when developing sampling strategies for madtom species in areas where minnow traps are an appropriate sampling gear. Wagner et al. (2019) found that CPUE and detection rates were lower for minnow traps baited with dog food than for backpack electrofishing, seining, and dipnetting in Mississippi streams. However, in many areas of the SCDRS, these sampling techniques are not feasible due to water depth. Conard (2015) and Manny et al. (2014) also sampled sites in the SCDRS using minnow traps baited with dog food and cheese; however, comparisons were not made between bait types.
In addition to minnow traps, Northern Madtoms have previously been collected via gillnetting and bottom trawling in the SCDRS (French and Jude 2001; Burkett 2013; Manny et al. 2014; Lamothe et al. 2020). Although a study comparing gear types for sampling Northern Madtoms in deepwater systems has not been conducted, benefits and drawbacks can be associated with each method. All three methods (minnow traps, gill nets, and trawls) allow for sampling at night, when Northern Madtom activity is likely highest (COSEWIC 2012). Minnow traps can be deployed in areas of high and low vegetation and at any water depth; however, at high water velocities, the traps may have to be weighted in order to stay in contact with the bottom to capture benthic fish species. To our knowledge, gill nets have not been deployed to target Northern Madtoms, but they have been collected as gill-net bycatch. When captured in gill nets, Northern Madtoms are typically entangled by their serrated pectoral spines. In some cases, mortality has been documented; however, it is unknown whether the mortality was a result of entanglement or represented the incidental catch of a previously dead madtom drifting downstream (our unpublished data). Bottom trawling successfully captured Northern Madtoms in the SCDRS during the daytime and nighttime (French and Jude 2001; Burkett 2013; Lamothe et al. 2020); however, Burkett (2013) observed higher CPUE at night. The capture efficiency of bottom trawling may also be lower when sampling large rocky substrates, therefore leading to biased catch rates and potentially misleading information regarding habitat associations.
Our data suggest that the artificial reefs constructed in the SCDRS are providing habitat for Northern Madtoms, but the use of these sites does not differ from the use of nearby control sites. Catch rates were lower in the Detroit River than in the St. Clair River and increased with increasing water temperature and turbidity. Baited minnow traps successfully captured Northern Madtoms in the fast-flowing, deep water of the SCDRS, and catch rates were significantly higher when traps were baited with worms. This work provides insight on sampling strategies that can be used to target Northern Madtoms in large-river systems and highlights the importance of incorporating a variety of sampling strategies, such as different bait types and seasonal sampling, into survey design.
Acknowledgments
We appreciate the contributions of Jason Fischer, Lisa Fischer, Gabrielle Herin, Robert Hunter, Aaron Mettler, Brian Schmidt, Maddie Tomczak, and Paige Wigren to various aspects of this project. Handling of fish followed the Guidelines for the Use of Fishes in Research (Use of Fishes in Research Committee 2014). The findings and conclusions in this article are those of the authors and do not necessarily represent the views of the U.S. Fish and Wildlife Service. Reference to trade names does not imply endorsement by the U.S. Government. There is no conflict of interest declared in this article.


