

Prognostic ability of the neoadjuvant rectal (NAR) score in long-course concurrent chemoradiotherapy for patients with locally advanced rectal cancer: a retrospective cohort study
Siyi Lu, Ran Peng, and Xianan Li contributed equally to this study.
Abstract
Background
The aims of this study were to evaluate the prognostic ability of the neoadjuvant rectal (NAR) score and to develop and validate a nomogram based on the NAR for patients with locally advanced rectal cancer (LARC) treated with neoadjuvant chemoradiotherapy (nCRT).
Methods
In total, 307 patients, including 230 patients from the primary cohort and 77 from the external cohort, were enrolled across the two centers. The associations of the NAR score with the tumor response, tumor control, and clinicopathological parameters were analyzed. Survival analysis was performed in the primary and external cohorts using Kaplan‒Meier curves. Univariate and multivariate analyses were performed to evaluate the prognostic factors. The NAR-based nomogram was developed in the primary cohort and validated in the external cohort using the concordance index (C-index), calibration plots, and decision curve analyses (DCAs).
Results
Kaplan‒Meier survival analysis revealed that the disease-free survival (DFS) and overall survival (OS) of the NAR > 16 group were significantly lower than those of the NAR ≤ 16 group (p < 0.001). Multivariate Cox regression analysis identified the NAR score as an independent prognostic factor for both DFS (hazard ratio [HR] = 2.484, 95% confidence interval [CI]: 1.159−5.323, p = 0.019) and OS (HR = 4.633, 95% CI: 1.076−19.941, p = 0.04). Calibration plots and DCAs showed that NAR-based nomograms for DFS and OS were consistent and useful in clinical practice. Moreover, the C-indexes of the NAR-based nomograms were better than those of the other variables in both the primary and external cohorts.
Conclusion
Our study validates the prognostic role of the NAR score for DFS and OS. The NAR-based nomogram for OS could accurately predict the outcome of LARC patients by stratifying the risk score accordingly.
Highlights
-
We validated the prognostic efficacy of NAR scores with data from two centers.
-
We construct novel NAR-based nomograms for locally advanced rectal cancer patients.
INTRODUCTION
Colorectal cancer (CRC) is the third most common and second deadliest type of cancer worldwide [1]. Rectal cancer (RC) accounts for approximately 50% of all CRC cases in China [2, 3]. At the time of diagnosis, nearly 70% of RC patients present with locally advanced disease [4]. The currently recommended treatments for locally advanced rectal cancer (LARC) are total mesorectal resection and neoadjuvant chemoradiotherapy (nCRT) [5]. For a long time, the estimation of survival prognosis and adjuvant chemotherapy depended only on pathological findings, such as tumor-node-metastasis (TNM) staging and pathological complete response (pCR) [6, 7]. Clinical TNM staging, however, is inaccurate, and only a small number of patients achieve pCR (15%−27%), indicating that these findings fail to predict survival in the majority of patients. Therefore, a more precise and convenient method to predict prognosis is to evaluate the individual outcomes of nCRT and guide the subsequent tailored treatment for LARC patients.
The neoadjuvant rectal (NAR) score was recently developed by Yothers et al. [8] as a novel scoring system to predict prognosis for LARC patients undergoing nCRT. This scoring system takes into consideration the clinical T stage (cT), pathological T stage (ypT), and pathological N stage (ypN), and it mainly reflects the tumor response to neoadjuvant treatment. The NAR score's prognostic role has been confirmed in several studies [9-12]. Although some clinical trials have been using the NAR score as a surrogate end-point of disease-free survival (DFS) and overall survival (OS) in LARC patients [13-15], whether the NAR score is a better prognostic indicator than ypT, ypN, or pCR is controversial, correlating with superior ability in some studies and inferior ability in others [11, 16, 17]. Thus, verifying the predictive power of the NAR score through multicenter cohorts is urgent. In addition, Weiser et al. [18] showed that prognostic nomograms comprising clinical parameters have achieved satisfactory predictive results, with a concordance index (C-index) greater than 0.7 for DFS and OS in patients treated with long-course concurrent chemoradiotherapy (CRT). Therefore, establishing a model combining the NAR score with clinicopathological characteristics to predict the prognosis of patients with LARC may provide new guidance for clinical management.
In this study, we aimed to investigate the prognostic value of NAR in LARC patients undergoing long-course CRT from two independent retrospective cohorts. Furthermore, nomograms based on the NAR score and other prognostic factors were developed to predict survival in LARC patients who received long-course CRT, and the findings were verified using external validation.
MATERIALS AND METHODS
Study population
Medical records of 230 and 77 patients with LARC undergoing radical surgery after nCRT at Peking University Third Hospital and Peking University People's Hospital, respectively, were collected. The exclusion criteria in this study were as follows: (1) patients managed by the watch and wait method or local excision; (2) patients with second cancer diagnoses; (3) patients operated on in other centers; and (4) patients with incomplete information.
Treatment and follow-up
All patients received long-course concurrent CRT before total mesorectal resection according to the institutional protocols. The nCRT regimen was as follows: oral capecitabine at a dose of 1650 mg/m2 per day was administered concurrently with radiotherapy (radiation doses ranged from 45 to 50 Gy given across 25 fractions) [19]. Patients were followed-up at 1 and 3 months after surgery and every 6 months thereafter. The brief follow-up strategy was described previously [20]. OS refers to the period following radical surgery until death, and DFS refers to the period following radical surgery until recurrence occurs locally or distally. Local recurrence was defined as radiologic or digital rectal examination or endoscopy evidence of recurrent disease in the remnant rectum, surgical bed, or locoregional nodes. Distant metastasis was defined as metastasis to other organs, the abdomen, or extrapelvic lymph nodes.
NAR score and tumor regression grade (TRG)
The NAR score was calculated using three clinical parameters: cT, ypT, and ypN. The calculation formula was as follows: 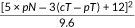 [8]. According to the validation results of the NSABP R-04 and CAO/ARO/AIO-04 trials, score values of the current study population were grouped into low [8], intermediate (8−16), and high (>16) groups [8, 13]. Pathologic TRG scores were ascertained according to the American Joint Committee on Cancer (AJCC) guidelines: TRG0, no residue tumor cells; TRG1, single tumor cell or small groups of tumor cells can be detected; TRG2, residual cancer cells outgrow fibrosis; and TRG3, no regression. In this study, TRG0 was defined as pCR, while TRG1-3 was defined as a non-pCR.
Statistical analysis
Using the Kolmogorov‒Smirnov test, continuous variables were checked for normal distribution. According to the data distribution, Student's t-test or the Wilcoxon rank sum test was used for continuous variables. The mean ± SD is shown for normally distributed continuous variables, while the median and interquartile range (IQR) are shown for nonnormally distributed continuous variables. To compare categorical variables, the chi-square test or Fisher's exact test was used. Survival analysis was conducted using Kaplan‒Meier curves. To identify independent prognostic factors, variables with a p value less than 0.1 in univariate analysis were included in multivariate Cox models. Using Cox proportional hazard regression, nomograms for predicting DFS and OS were constructed. Validation of the nomogram was performed using calibration curves, decision curve analysis (DCA), and the C-index. All statistical analyses were conducted using SPSS Statistics 24.0 (IBM Corporation) and R version 4.0. A p value of <0.05 was recognized as statistically significant.
RESULTS
Patient characteristics
Among the 307 patients enrolled in our study, 230 were from the primary cohort, and 77 were from the external cohort. The patients enrolled in our study underwent a series of selections described in Figure 1 in detail. Among the 230 patients from the primary cohort, 67 patients were female (29.1%), and 163 were male (70.9%). The median age of the 230 patients was 61 years (IQR: 54–69). The cT stages were cT2-3 in 184 (80%) patients and cT4 in 46 (20%) patients. The clinical N (cN) stages were negative in 53 (23%) patients and positive in 177 (77%) patients. The ypT stages after nCRT were ypT0-1 in 68 (29.6%) and ypT2-4 in 162 (70.4%) patients, and the ypN stages were negative in 167 (72.6%) and positive in 63 (27.4%) patients. The tumor response of patients was as follows: 47 (20.4%) achieved pCR, while 183 (79.6%) were non-pCR. The 230 patients were categorized into three groups based on their calculated NAR score. Seventy-two patients (31.3%), 103 patients (44.8%), and 55 patients (23.9%) were divided into NAR < 8, NAR 8 − 16, and NAR > 16 groups, respectively. Other detailed information about the patient characteristics is listed in Supporting Information: Table S1.

Tumor control and tumor response
We further evaluated the relationship between the NAR score and tumor response and control, which are valuable indicators of the pathological characteristics of tumor patients. As shown in Figure 2a, the higher the NAR score, the higher the proportion of patients with local recurrence and metastasis, suggesting a positive correlation between the NAR score and the rate of local recurrence and metastasis. The interval week refers to the period from the end of radiotherapy to surgery. The interval weeks in our primary cohort ranged from 5 to 22, with a median value of 10 (IQR 9−11). Figure 2b demonstrates the association of the length of the interval week with both the cumulative rate of pCR and the NAR score. As Figure 2b indicates, a rising trend in the pCR rate with increasing interval weeks can be observed. Non-pCR was observed in patients with interval weeks 5 or 6, while the rate of pCR began to rise from Week 7 and stayed the highest in weeks > 12. Figure 2b also demonstrates that the NAR score presents an apparent decreasing trend with the increase in interval week and pCR rate, suggesting a negative correlation between the NAR score and interval week and pCR rate.

Survival analysis of NAR score
Survival analysis was conducted to evaluate the prognostic value of the NAR score in predicting DFS and OS. We first conducted survival analysis based on the three categories of NAR scores, as shown in Supporting Information: Figure S1. The NAR > 16 group had a significantly lower probability of DFS (p < 0.001) and OS (p < 0.001) than the NAR 8−16 group, and the NAR > 16 group also had a significantly lower probability of DFS (p < 0.001) than the NAR < 8 group. However, no statistically significant difference in DFS was observed in the comparison between the NAR 8−16 and NAR < 8 groups (p = 0.986), in OS between NAR > 16 and NAR < 8 groups (p = 0.163), and in OS between NAR 8−16 and NAR < 8 groups (p = 0.116). In addition, we conducted a survival analysis based on the binary categories of the NAR score. The NAR score distribution of DFS and OS in primary cohort was shown in Figure 3a,b. According to Figure 3c,d, patients with NAR > 16 had significantly lower DFS (hazard ratio [HR] = 0.23, 95% confidence interval [CI]: 0.10−0.53, log-rank p < 0.001) and OS (HR = 0.21, 95% CI: 0.07−0.62, log-rank p < 0.001) than patients with NAR ≤ 16. Based on these results, we chose binary classification as the better method to stratify high-risk patients based on the NAR score.

To validate our findings, survival analysis was also conducted in the external cohort. As shown in Supporting Information: Figure S2, patients with NAR > 16 were more likely to have shorter DFS (HR = 0.24, 95% CI: 0.07−0.90, log-rank p = 0.005) and OS (HR = 0.27, 95% CI: 0.05−1.48, log-rank p = 0.049) than patients with NAR ≤ 16.
The relevance of the NAR score to clinicopathological parameters
Table 1 lists the clinicopathological parameters of the NAR > 16 and NAR ≤ 16 groups. The NAR > 16 group was more likely to be positive for perineural invasion (PNI) (30.9% vs. 4.6%, p < 0.001) and lymphovascular invasion (LVI) (20% vs. 1.7%, p < 0.001) than the NAR ≤ 16 group. In addition, the NAR > 16 group was more likely to have carcinoembryonic antigen (CEA) > 5 ng/mL than the NAR ≤ 16 group (34.5% vs. 9.1%, p < 0.001). However, no statistically significant difference was observed between these two groups based on other parameters.
| Characteristic | Levels | NAR > 16 | NAR ≤ 16 | p value |
|---|---|---|---|---|
| n | 55 | 175 | ||
| Gender, n (%) | Female | 17 (30.9%) | 50 (28.6%) | 0.871 |
| Male | 38 (69.1%) | 125 (71.4%) | ||
| cN, n (%) | Negative | 7 (12.7%) | 46 (26.3%) | 0.058 |
| Positive | 48 (87.3%) | 129 (73.7%) | ||
| PNI, n (%) | Negative | 38 (69.1%) | 167 (95.4%) | <0.001 |
| Positive | 17 (30.9%) | 8 (4.6%) | ||
| LVI, n (%) | Negative | 44 (80%) | 172 (98.3%) | <0.001 |
| Positive | 11 (20%) | 3 (1.7%) | ||
| CEA, n (%) | >5 | 19 (34.5%) | 16 (9.1%) | <0.001 |
| ≤5 | 36 (65.5%) | 159 (90.9%) | ||
| Age, years, median (IQR) | 58 (54, 70) | 62 (53.5, 69) | 0.539 | |
| Interval, weeks, median (IQR) | 9.57 (8.21, 10.86) | 10 (9, 11.07) | 0.072 | |
| Tumor size, median (IQR) | 5.3 (4.45, 6.2) | 4.9 (4.1, 5.95) | 0.069 | |
| BMI, kg/mm2, mean ± SD | 23.74 ± 2.94 | 24.07 ± 3.11 | 0.488 | |
| DTAV, median (IQR) | 6 (5, 8) | 6 (4.1, 7.55) | 0.359 |
- Abbreviations: CEA, carcinoembryonic antigen; cN, clinical N stage; DTAV, distance to the anal verge; Interval, interval between NCRT and surgery; IQR, interquartile range; LVI, lymphovascular invasion; NAR, neoadjuvant rectal score; PNI, perineural invasion; SD, standard deviation.
NAR score as an independent risk factor for DFS and OS in patients receiving long-course CRT
Cox regression analysis was performed to further address the prognostic value of the NAR score. Univariate analysis indicated that cT, ypT, ypN, PNI, LVI, CEA, pCR, and NAR scores were significantly associated with DFS, while cT, ypN, PNI, and NAR scores were significantly associated with OS (Table 2). Further analysis was performed based on multivariate Cox regression, which suggests that a high NAR score is an independent prognostic factor for both DFS (HR = 2.484, 95% CI: 1.159−5.323, p = 0.019) and OS (HR = 4.633, 95% CI: 1.076−19.941, p = 0.04). Other independent prognostic factors for DFS and OS are shown in Table 2.
| DFS | OS | |||||||
|---|---|---|---|---|---|---|---|---|
| Univariate | Multivariate | Univariate | Multivariate | |||||
| Variables | HR (95% CI) | p value | HR (95% CI) | p value | HR (95% CI) | p value | HR (95% CI) | p value |
| Gender (female vs. male) | 0.746 (0.352−1.584) | 0.446 | - | - | 0.238 (0.054−1.042) | 0.057 | 0.253 (0.057−1.122) | 0.071 |
| Age (years) | 1.012 (0.984−1.04) | 0.411 | - | - | 1.035 (0.992−1.079) | 0.108 | - | - |
| Interval, weeks (≥8 vs. <8) | 0.786 (0.326−1.896) | 0.592 | - | - | 3.837 (0.496−29.658) | 0.197 | - | - |
| Tumor size (cm) | 1.177 (0.992−1.397) | 0.062 | - | - | 1.122 (0.866−1.454) | 0.384 | - | - |
| BMI (kg/mm2) | 1.016 (0.917−1.126) | 0.758 | - | - | 0.889 (0.767−1.031) | 0.118 | - | - |
| DTAV (cm) | 1.102 (0.989−1.228) | 0.078 | - | - | 1.075 (0.919−1.258) | 0.363 | - | - |
| Clinical T stage (cT) (cT4 vs. cT2-3) | 2.833 (1.436−5.589) | 0.003 | 1.991 (0.997−3.977) | 0.051 | 4.229 (1.705−10.491) | 0.002 | 2.788 (1.026−7.577) | 0.044 |
| Clinical N (cN) (+ vs. −) | 2.795 (0.99−7.894) | 0.052 | 2.816 (0.989−8.02) | 0.053 | 5.903 (0.788−44.232) | 0.084 | 4.745 (0.629−35.796) | 0.131 |
| Pathological T stage (ypT) (ypT0-1 vs. ypT2-4) | 2.748 (1.069−7.063) | 0.036 | - | - | 1.114 (0.4−3.103) | 0.836 | 0.262 (0.061−1.128) | 0.072 |
| Pathological N stage (ypN) (+ vs. −) | 3.875 (2.027−7.408) | <0.001 | - | - | 4.842 (1.889−12.412) | 0.001 | - | - |
| PNI (+ vs. −) | 5.187 (2.634−10.214) | <0.001 | 2.913 (1.293−6.56) | 0.01 | 5.922 (2.364−14.834) | <0.001 | 2.704 (0.801−9.132) | 0.109 |
| LVI (+ vs. −) | 5.211 (2.131−12.747) | <0.001 | - | - | 9.255 (3.262−26.261) | <0.001 | - | - |
| CEA (>5 ng/mL vs. ≤5 ng/mL) | 2.167 (1.069−4.391) | 0.032 | - | - | 2.048 (0.773−5.426) | 0.149 | - | - |
| PCR (Yes vs. no) | 0.206 (0.049−0.857) | 0.03 | - | - | 0.696 (0.202−2.4) | 0.566 | - | - |
| NAR score (>16 vs. ≤16) | 4.3 (2.253−8.209) | <0.001 | 2.484 (1.159−5.323) | 0.019 | 4.934 (1.968−12.367) | 0.001 | 4.633 (1.076−19.941) | 0.04 |
- Abbreviations: CEA, carcinoembryonic antigen; CI, confidence interval; HR, hazard ratio; LVI, lymphovascular invasion; NAR score, neoadjuvant rectal score; PNI, perineural invasion.
Development and external validation of NAR-based nomograms
The comparison between the primary and external cohorts was conducted based on sex (p = 0.06), cT (p = 0.345), cN (p = 0.140), ypT (p = 0.498), PNI (p = 0.212), and NAR score (p = 1.000), indicating that the two data sets exhibited no significant difference in the data distribution of these parameters. Detailed information on this comparison is listed in Supporting Information: Table S2. The NAR-based prognostic nomogram for DFS and OS was constructed according to the Cox regression analysis of the primary cohort (Figure 4a,b). Calibration curves were used to evaluate the NAR-based nomograms’ clinical application. The calibration curves showed good calibration for DFS and OS in both the primary and external cohorts (Supporting Information: Figure S3a−d). Decision curve analysis was performed to evaluate the clinical relevance of these models in primary and external cohorts (Figure 5a−d). DCA of NAR-based DFS and OS models showed the best result compared to other models. Of note, the C-indexes of the NAR-based prognostic nomogram for DFS in the primary and external cohorts were 0.707 and 0.709, respectively, which were higher than those of the other variables (Figure 6a). A similar phenomenon was observed for OS, yielding a C-index of 0.826 in the primary cohort and 0.84 in the external cohort (Figure 6b). The detailed C-index is shown in Supplementary Table S3.


DISCUSSION
In the present study, the effect of NAR on survival outcomes was confirmed, which provides more accurate prognostic information than ypT/N staging and pCR. We first demonstrated that the NAR score is positively correlated with the rate of both local recurrence and metastasis but negatively correlated with the pCR rate and the interval week. Then, we conducted survival analysis based on DFS and OS, which suggested that the NAR score was significantly associated with prognosis, and this finding was also validated in the external cohort. Furthermore, we demonstrated that the NAR score is an independent prognostic factor for the OS and DFS of LARC patients treated with nCRT. Finally, we developed NAR-based nomograms that are qualified to predict DFS and OS in LARC patients from the primary cohort and validated them in the external cohort.
In clinical practice, long-course CRT has been increasingly used in the treatment of LARC to downstage tumors and to improve outcomes of subsequent localized treatment. Thus, tumor response and control are important elements for evaluating the effect of nCRT regimen. Based on the findings of the current study (Figure 2a,b), the NAR score has a positive relationship with local recurrence and metastasis, while being negatively related with pCR rate, suggesting that higher NAR score is correlated with poorer tumor response and control. Our findings are consistent with the results of NSABPR-04 trial [21] and CAO/ARO/AIO-04 trial [13]. In addition, some retrospective studies provided the same conclusion [9-12]. Increasing numbers of clinical trials, such as the E-LARC Study [22], NRG-GI002 [23], and NCT02935309 [24], have used the NAR score as a surrogate end-point for tumor response and control. However, to the best of our knowledge, it remains unknown whether the NAR score has a better predictive ability for survival than ypT/N staging or pCR [11, 16, 17].
The current gold standard primary endpoints for evaluating clinical outcomes under specific interventions are DFS and OS [25]. However, these two indicators require follow-up over long periods, which is time-consuming and costly. Studying indicators over an extended period of follow-up time is associated with a series of obstacles, for example, the loss of contact with patients and the various unrelated factors that influence patient survival. Early surrogate endpoints have been extensively studied to combat the drawbacks of DFS and OS as the end-points of clinical trials [26]. A significant limitation of the rectal cancer ypTNM staging system is that it does not account for biological features known to have predictive and prognostic value, including tumor downstaging, which can be regarded as the sensitivity to treatment, because it can reflect tumor biology [27]. In addition, the TNM category system cannot differentiate patient prognosis from the same stage, while the prognosis tends to vary within the same stage in the real-life scenario [28]. For pCR, the grading systems, including AJCC-TRG, Memorial Sloan Kettering Cancer Center (MSKCC), and Dworak, have not been unified, making it difficult to use this parameter to predict prognosis [29]. Hence, there is controversy over whether these surrogate end-points reflect true clinical benefit. The results of the associated prognostic factors in the present study revealed that the NAR score was an independent prognostic factor in patients with LARC in the univariate and multivariate analyses, suggesting that it is the most powerful prognostic factor of long-course CRT in patients with LARC.
In this study, the C-indexes of the NAR score in predicting DFS from both the primary and external cohorts were 0.645 and 0.679, respectively. For OS, the C-indexes were 0.676 and 0.603, respectively. Our findings are basically consistent with a large sample size study from the Netherlands Cancer Registry database [30], which reported a C-index of 0.655 for the NAR score in predicting OS. Recently, a multicenter study of 1400 LARC patients from MSKCC and Siteman Cancer Center [18] reported that clinical calculators (consisting of clinicopathological parameters) resulted in a C-index > 0.7 in both the training and validation cohorts, which performed better than the NAR score (C-index < 0.7) alone in predicting survival, suggesting that clinicopathological parameters are also important predictors of survival. Therefore, we combined the NAR score and clinicopathological parameters by creating nomograms. The results showed that in both the primary cohort and the external cohort, the performance of the NAR-based nomograms was steady and robust (Figure 6a,b).
We would like to acknowledge that our study has some limitations. First, this is a retrospective study, and its retrospective nature cannot avoid the risk of selection bias. Second, patients enrolled in this study all received long-term CRT, and the prognostic effect of the NAR score in patients receiving short-course CRT and total neoadjuvant therapy could not be evaluated. Third, the number of enrolled patients in both cohorts was relatively low, especially the number of patients from the external cohort. In our future study to further explore the prognostic value of the NAR score, we intend to expand the number and group of patients and may design a randomized trial. Furthermore, the confidence and accuracy of the NAR score also rely on multiple aspects, including the standardized surgical procedure, the quality of magnetic resonance imaging, the comprehensive assessment of the surgical specimen, and other human influences, and all these factors may limit the applicability of the ultimate nomogram.
Despite the limitations in our study, we demonstrated the prognostic value of the NAR score in LARC patients treated with long-course CRT and developed a nomogram, which may be applied in future clinical evaluation. Our findings further verified the potential of the NAR score as an early surrogate end-point in the scenario of LARC patients treated with long-course CRT. As indicated before, the advantage of the NAR score to prevent the need for long-term follow-up may provide more accurate evaluation and guide tailored treatment for LARC patients, such as whether or not to continue CRT postoperation. Additionally, we validated our nomograms in the external cohort, suggesting that it may be applied to the general population based on the same selection criteria.
In conclusion, this study indicates that the NAR score predicts DFS and OS for LARC patients treated with long-course CRT followed by radical surgery. NAR-based nomograms have the potential to be used in clinical practice.
AUTHOR CONTRIBUTIONS
Siyi Lu, Ran Peng, and Xianan Li analyzed data and wrote the manuscript. Ran Peng and Xianan Li contributed to data collection. Zhaoyu Chen and Ruize Qu contributed to data curation. Yi Zhou contributed to visualization and formal analysis. Xianan Li and Yuxia Wang contributed to the follow-up. Xin Zhou, Qiuxiang Zhang, and Hao Wang provided intellectual contributions. Tao Sun, Hao Wang, and Wei Fu supervised the project, discussed data analysis, and reviewed the manuscript.
ACKNOWLEDGEMENTS
This work was supported by grants from Peking University Third Hospital ‖ United-Imaging Research Institution Intelligential Imaging Joint Research & Development Centre Foundation (H79462-07), the National Natural Science Foundation of China (62173005), the Natural Science Foundation of Beijing (7204324), the special fund of the National Clinical Key Specialty Construction Program, China (2021), and the National multidisciplinary cooperative diagnosis and treatment capacity building project for major diseases: comprehensive diagnosis and treatment of gastrointestinal tumors.
CONFLICT OF INTEREST STATEMENT
Professor Wei Fu, who is Co-editor-in-Chief of Malignancy Spectrum, was excluded from the peer-review process and all editorial decisions related to the acceptance and publication of this article. Peer-review was handled independently by the other editors to minimize bias. The remaining authors declare no conflict of interest.
ETHICS STATEMENT
Ethical approval of the study was obtained from Peking University Third Hospital ethics committees (IRB00006761-M2019387), and this study adhered to the Declaration of Helsinki. The Institutional Review Board of the Third Hospital of Peking University granted an informed consent waiver.
Open Research
DATA AVAILABILITY STATEMENT
The raw data supporting the conclusions of this article will be made available by the authors, without undue reservation. The data that support the findings of this study are available from the corresponding author upon reasonable request.

