Mapping magnetization transfer saturation (MTsat) in human brain at 7T: Protocol optimization under specific absorption rate constraints
Abstract
Purpose
To optimize a whole-brain magnetization transfer saturation (MTsat) protocol at 7T, focusing on maximizing obtainable MTsat under the constraints of specific absorption rate (SAR) and transmit field inhomogeneity, while avoiding bias and keeping scan time short.
Theory and Methods
MTsat is a semi-quantitative metric, obtained by spoiled gradient-echo MRI in the imaging steady-state. Optimization was based on an established 7T dual flip angle protocol, and focused on MT pulse, readout flip angle, repetition time (TR), offset frequency (Δ), and correction of residual effects from transmit field inhomogeneities by separate flip angle mapping.
Results
A 100% SAR level was reached at a 180° MT pulse flip angle, using a compact sinc main lobe (4 ms duration) and minimum TR = 26.5 ms. The use of Δ = +2.0 kHz caused no discernible direct saturation, while Δ = −2.0 kHz resulted in 45% higher MTsat in white matter (WM) compared to Δ = +2.0 kHz. A 4° readout flip angle eliminated bias while yielding a good signal-to-noise ratio. Increased TR yielded only a little increase in MTsat, and TR = 26.5 ms (scan time 04:58 min) was thus selected. Post hoc transmit field correction clearly improved homogeneity, especially in WM.
Conclusions
The range of MTsat is limited at 7T, and this can partly be overcome by the exploitation of the asymmetry of the macromolecular lineshape through the sign of Δ. To reduce scan time, a compact MT pulse with a sufficiently narrow frequency response should be used. TR and readout flip angle should be kept short/small. Transmit field correction through separate flip angle mapping is required.
1 INTRODUCTION
Magnetization transfer (MT) is a unique contrast mechanism enabling detection and quantification of otherwise MR-invisible macromolecules.1, 2 MT is highly correlated with myelination3 and thus used to study white matter (WM) diseases, most notably multiple sclerosis.4, 5 Contrast is induced by applying high-energy, off-resonance radiofrequency (RF) pulses, targeting the broad absorption line of the rotationally restricted protons bound to macromolecules. This magnetic saturation is then transferred to the free water, where it manifests as a tissue-specific decrease in signal amplitude.
At 7T, the application of MT pulses is curtailed by safety limits of the specific absorption rate (SAR) which increases quadratically with field strength. This limits the achievable signal reduction and the range of any derived metrics. In addition, the more pronounced RF inhomogeneities at 7T may impose a spatial bias. Further, because of the increased Larmor frequency at 7T, it must be avoided that chemical exchange saturation transfer (CEST) resonances overlap with the saturation profile of the off-resonance RF pulse.6 Due to these challenges, MT-mapping is still relatively uncommon in an ultra-high field (≥7T) in vivo setting, although it has been performed using either a two-pool model7-10 or through measurement of the Z-spectrum and subsequent multiple-pool analysis at 7T11 and 9.4T.12 Nevertheless, the signal reduction by MT-weighting benefits from higher field strength due to the longer T1.2, 13 Further, the shift of the macromolecular absorption line with regard to the free water resonance will also increase at higher field strengths.14 This warrants further investigation of the feasibility of in vivo MT at 7T.
From the MT-weighted (MT-w) signal, semi-quantitative metrics can be derived to describe the MT effect. The MT saturation (MTsat) represents the fraction of free water saturated by a single MT pulse during repetition time (TR)15 and care must thus be taken to minimize contributions that confound MT when implementing it. MTsat is obtained from an empirical signal equation of an MT-w spoiled gradient echo, which is supplemented by two spoiled gradient-echo acquisitions with T1- and proton density (PD)-weighting (forming a dual flip angle [DFA] experiment). Because of this, MTsat is unbiased by T1 relaxation (for a small flip angle [FA] and TR << T1) unlike the conventional magnetization transfer ratio (MTR) where T1 relaxation will counteract MT and reduce contrast. Also unlike MTR, the quadratic dependence of MT on the transmit field16 cancels out in the algebraic derivation of MTsat, thus inherently compensating for FA inhomogeneities to a large extent. MTsat thus provides a time-efficient alternative to fully quantitative techniques but with increased specificity and contrast compared to MTR. MTsat is mostly used in a multi-parameter mapping (MPM) context,17, 18 for which dedicated processing tools have been developed.19 Thus far, MTsat has mainly been implemented at 3T where it has been used in a variety of clinical studies. These include research on spinal cord injury,20, 21 effects of aging22-24 as well as multiple sclerosis to assess the g-ratio25, 26 and to discriminate between disability levels.27
In this study, the steps of optimizing MT-weighting in the context of an MPM protocol for whole-brain imaging are described, explicitly addressing the 7T specific issues of increased SAR and compromised transmit field homogeneity. The developed MT-w sequence was added to an established 7T DFA protocol28 to obtain MTsat. The choices of MT pulse shape, TR, readout FA and offset frequency are discussed based on separate experiments. Correction for residual effects of transmit field inhomogeneities was also addressed, and efforts were made to maintain a clinically feasible scan time (~5 min) with sub-millimeter resolution. Last, the repeatability of the suggested protocol was tested on a single subject.
2 THEORY
2.1 MTsat
 , is approximated:
 (1)
(1) denotes MTsat,
  is the readout FA in radians,
  and
and  is the signal amplitude under fully relaxed conditions, ie, TR >> T1. Using maps of
  and
and  obtained from a DFA experiment,
  is calculated from
  :
:
 (2)
(2) , where
  is the transmit field bias and
  is the nominal FA (set in the user interface). Using this substitution in the equations for
  and
and  in a DFA experiment, one obtains
  and
and  , where
  and
and  are the corresponding estimates obtained with nominal FAs.29 Equation (2) can be re-written in a similar way:
 (3)
(3) , is reduced by the MT pulse,
  of duration
  . This is described by differential absorption16:
 (4)
(4) is the super-Lorentzian macromolecular absorption lineshape,
  is the MT pulse offset frequency and
  is the transverse relaxation time of the macromolecular pool. Direct saturation of
  can also be described by Equation (4), except with a Lorentzian lineshape governed by
  . If no other confounding contrast mechanism is present and the decrease of
  during
  can be ignored, the ensuing transfer renders
  to the macromolecular pool size fraction,
  :
:
 (5)
(5) will depend not only on macromolecular content, but also on lineshape and transmit field inhomogeneities as well as the apparent transfer rate.15 However, the square of
  is mirrored by
  in Equation (3). This means that by using
  one gets a reflection of the macromolecular content, which is inherently compensated for transmit field inhomogeneities, motivating the use of nominal FAs for calculation of MTsat:
 (6)
(6)MTsat henceforth refers to the metric calculated using nominal FAs (Equation (6)).
2.2 RF energy and pulse shape
 is often used as a surrogate parameter in SAR models. As described above, this integral also governs the energy and induced
  (Equation (5)) of the MT pulse through the differential absorption law (Equation (4)). The power integral can be expressed as:
 (7)
(7) is the maximum amplitude of the RF pulse and the rightmost normalized integral depends solely on the normalized RF shape
  . By using
  , the power integral is expressed in terms of
  and
and  , which can be controlled experimentally:
 (8)
(8) (9)
(9) for a rectangular pulse.
2.3 Noise propagation into the MTsat map
 .30 For a fixed TR and MT pulse, noise propagation from
  into
into  is minimized for an optimal readout FA31:
 (10)
(10) yields the highest signal in the MT-w acquisition and can be obtained by a variable FA experiment and a linear fit to the signals.29 The full derivation is given in Supporting Information, which is available online. As in the DFA experiment,28 a global optimization of
  is not possible.
2.4 Residual effects of transmit field inhomogeneities
 -dependence in Equation (3) and the
  -dependence in Equation (5), it is clear that
  should be compensated for FA inhomogeneities. However, the decrease in
  under the duration of the MT pulse (
 ) will render induced saturation and hence MT smaller than what would be expected from differential absorption (Equation (4)). Thus,
  will be somewhat overcompensated by the inherent
  -correction, leading to an underestimation when
  and an overestimation when
  . This
  dependence of
  can be described empirically by a linear dependence32:
 (11)
(11) and
and  are phenomenological parameters specific to the MT pulse shape and duration. Equation (11) explicitly contains the nominal FA of the MT pulse, hence
  and
and  can be obtained by varying
  and performing a linear regression of
  versus
  . Given that the final transmit field-corrected estimate is
  , the correction takes the form:
 (12)
(12) forms a pulse-specific parameter, which is used for post hoc transmit field correction of MTsat.
3 METHODS
Experiments were performed on an actively shielded 7T MR system (Achieva, Philips Healthcare, Best, NL) with a head coil of 32 receive and 2 transmit channels with fixed phase setting (Nova Medical, Wilmington, MA). Eight healthy adult subjects (six females, 19 to 37 y old) were scanned after giving informed written consent as approved by the regional Ethical Review Board.
To map MTsat, an MT-w sequence was run in conjunction with a DFA experiment, thus forming an MPM protocol. For all three series, a non-selective 3D RF-spoiled multi-echo gradient-echo sequence was used with in-plane phase encoding anterior-posterior. Isotropic voxels of (0.9 mm)3 were defined within FOVFH,AP,RL = 230 × 230 × 200 mm3 (with some variation to match head size). Eight equidistant echoes with fat and water in-phase (multiples of TE = 1.97 ms) were acquired, with alternating readout gradient polarity at a bandwidth of 670 Hz/px. To reduce measurement time, an elliptical k-space coverage was combined with SENSEAP,RL = 2 × 2. The readout RF pulses had a 700 μs asymmetric Gauss-filtered sinc shape to reduce sensitivity to B0 inhomogeneities and incidental MT effects.28, 33 Other parameters unique to the DFA experiment were α1/α2 = 16°/4° and TR = 18.1 ms.28 After default automatic adjustment based on the DFA sequence with higher FA, the transmit and receive gain calibration was kept constant throughout the experiment.
Dedicated experiments were performed to study the effect of different sequence parameters on MTsat to obtain the maximum range of MTsat at the 100% SAR level while avoiding bias and keeping scan time short.
FA-mapping was performed using Dual Refocused Echo Acquisition Mode (DREAM)34 and optimized for the prolonged T1 at 7T through a slice thickness ratio of 2.0 and a shot interval of 12 s.35 Acquisition of 48 transverse slices with FOVAP,RL = 240 × 240 mm2, voxel size 3.75 × 3.75 × 3.50, slice gap 0.25 mm was accomplished at 4796 Hz/px readout bandwidth. Three separate DREAM acquisitions with preparation FAs αSTEAM,nom = 25°, 40°, 60° were combined offline.36
Offline processing was performed using MATLAB and FSL.37 Volumes were averaged across TEs to boost SNR38 and co-registered using FLIRT.39, 40 MTsat was calculated using Equation (6) and transmit field-corrected using Equation (12) with C as determined below (see Results 4.6) over a common brain mask obtained by BET.41
Whole-brain histograms were used to evaluate the MTsat maps. Histograms facilitate an intuitive assessment of global changes, where the separation of modes reflects contrast and the broadness reflects SNR. The histograms were typically between −0.5 and 2.5 p.u., using a bin size of 0.01 p.u. For more specific analysis of tissue types, automatic segmentation of WM, gray matter (GM), and cerebrospinal fluid (CSF) was favorably performed on the MTsat maps using FAST.42 Only pixels with a tissue probability of 1 were evaluated to avoid partial volume effects. CSF was analyzed only within the ventricles.
3.1 Shape of MT pulse
The choice of MT pulse was motivated by previous 3T implementations where a Gaussian with tsat = 4 ms and αsat,nom = 220° was used.43, 44 This MT pulse yields a good compromise between frequency response and short tsat. Since a Gaussian was not available on the system, a similar Gaussian-filtered sinc main lobe was used.
The 4 ms sinc main lobe pulse and a consecutive spoiler added 8.4 ms to the TR of the DFA acquisitions. If αsat,nom = 220° were to be used, the TR would be increased by an additional 13 ms due to SAR limitations. To ensure the shortest possible scan time, αsat,nom was reduced to 180° (the maximum value compatible with TR = 26.5 ms), resulting in a scan time of 4:58 min. This decrease in scan duration will come at the expense of induced MT (see Equation (8)).
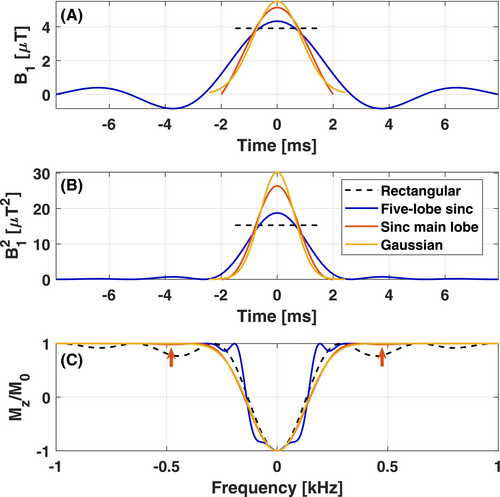
To illustrate the choice of pulse shape, four MT pulses with different shapes were compared for identical αsat = 180° and energy (ensuring same MTsat, and same SAR). The compared pulse shapes were (a) a five-lobe sinc (Q = 5.26, tsat = 15.8 ms, B1,rms = 1.70 μT), which is the default MT pulse shape on the system (b) the implemented sinc main lobe (Q = 1.33, tsat = 4.0 ms, B1,rms = 3.37 µT), (c) a Gaussian with cutoff at 2% of maximum (Q = 1.61, tsat = 4.8 ms, B1,rms = 3.10 µT), and last, for reference, (d) a rectangular pulse (Q = 1.00, tsat = 3.0 ms, B1,rms =3.91 µT). The frequency response profiles were simulated by numerically solving the Bloch equations, ignoring relaxation effects, using the RF Pulse Wizard tool as provided with a copy of Ref. 45.
3.2 Readout FA
To empirically adjust the readout FA, αnom was varied through 2°, 4°, 6°, 8° in one volunteer (34-year-old female, αsat,nom = 180°, tsat = 4 ms, Δ = +2.0 kHz). TR was slightly increased to 27 ms for all series to accommodate the slight increase in SAR for αnom = 8°.
The nominal αE,MT was determined through pixelwise linear fitting of the four FAs in the brain parenchyma (segmented WM+GM).46 Thereafter, the median was used to calculate the nominal αopt in Equation (10). The behavior of MTsat in WM, GM, and CSF was studied to identify the occurrence of bias.
3.3 TR
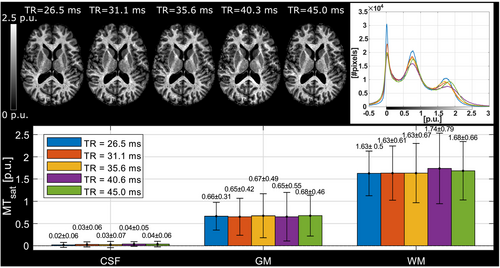
To corroborate the choice of the shortest possible TR = 26.5 ms at tsat = 4 ms, TR was varied through 26.5, 31.1, 35.6, 40.3 and 45.0 ms on one volunteer (24-y-old male, αsat,nom = 180°, tsat = 4 ms, Δ = −2.0 kHz). It was of interest to assess whether MTsat increased at higher TR, and if so, how much. Resulting acquisition times were 04:58, 05:49, 06:40, 07:33, and 08:26 min, where 08:26 min was deemed to be the maximum acceptable.
3.4 Offset frequency
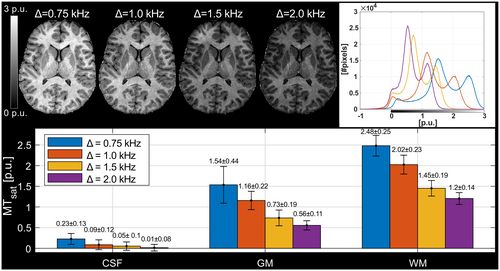
With RF pulses and timings established, the offset frequency of the MT pulse needs to be determined. On one hand, a strong increase in saturation and thus in MTsat is expected at smaller offsets due to the super-Lorentzian lineshape of the macromolecules.47, 48 On the other hand, care must be taken to limit direct saturation and CEST. Thus, Δ was varied through 0.75, 1.0, 1.5, and 2.0 kHz on one subject (19-y-old female, αsat,nom = 180°, tsat = 4 ms). Settings of Δ < 0.75 kHz were not employed to avoid direct saturation by the sidebands at 0.48 kHz indicated by the simulations (see the Results section 4.1).
The T2,b has been shown to be quite similar in WM and GM.48, 49 Hence, it was assumed that WM and GM have comparable absorption lineshapes. The MT-related component of MTsat should therefore vary proportionally with Δ. The difference in average MTsat between WM and GM at the largest Δ = 2.0 kHz (where direct saturation and CEST were assumed negligible) was calculated across all axial slices containing brain pixels. Any disproportionate increase of MTsat, ΔMTsat, in GM relative WM at lower Δ was attributed to either direct saturation in tissue or CEST.
3.5 Negative offset frequency
The lineshape of the macromolecules is shifted with respect to the free water resonance by –2.34 ± 0.17 ppm (−697 Hz at 7T) in WM.14 To examine how much MTsat can be gained by this asymmetry, the MT pulse was applied with either a positive or a negative offset frequency (Δ = ±2.0 kHz) in one subject (19-y-old female, αsat,nom = 180°, tsat = 4 ms). To take B0 inhomogeneity into account, the free water frequency offset, f0, was also measured. A linear function of MTsat as a function of f0 (in kHz) was fitted in segmented WM in a slice covering an area above the sinuses. Resulting slopes using Δ = ±2.0 kHz were then compared.
3.6 Residual effects of transmit field inhomogeneities
To determine the correction factor C for the chosen MT pulse, the nominal FA of the MT pulse was varied within a range of αsat,nom = 45°-180° (B1,rms = 0.87-3.37 μT) in four subjects (three female, 23 to 28 y old). This variation of αsat,nom mimics a variation of fT down to 25% as typically observed in the cerebellum at 7T.36
The variation of αsat,nom was performed as follows: Subject #1: αsat,nom = 60-180° in steps of 30°. Subject #2: αsat,nom = 120°-180° in steps of 20°. Subject #3 αsat,nom = 60°-180° in steps of 20° with extra measurements at 45°, 90°, 135°. Subject #4: αsat,nom = 80-180° in steps of 10° with an extra measurement at 135°. For subjects #1-#3, each series were acquired twice to increase robustness, resulting in 10, 8, 20, and 12 MTsat maps for the respective subjects. All MTsat maps for a subject were based on a single pair of DFA-derived T1- and S0 maps. In Equation (11), δMT,app was divided by (αsat,nom)2 to obtain C in four ROIs by linear fitting. The ROIs were manually defined symmetrically (left-right) in frontal WM (average across all ROIs and subjects was npixels = 794 ± 220) and in the caudate head (average across all ROIs and subjects was npixels = 644 ± 286), where the latter represented GM. When performing the fit, each δMT,app/(αsat,nom)2 data point was weighted by the inverse of the ROI standard deviation for the particular αsat,nom used (ie, points acquired with αsat,nom = 45° were weighted less than points acquired with αsat,nom = 180°). This was done to reduce the influence of noise on the fitting as SNR correlates strongly with αsat. Out of these 4 × 4 = 16 estimates of C, averages for GM (8 ROIs) and WM (8 ROIs) were calculated, as well as a total average, Cmean, of all ROIs, to be used for post hoc correction across the entire brain.
3.7 Repeatability
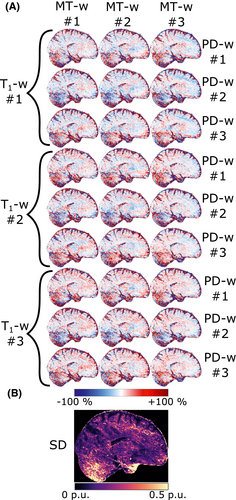
After sequence parameters and fT-correction had been established, the MPM protocol was repeated three times on a single subject to measure repeatability. By all combinations of T1-w, PD-w, and MT-w images, this resulted in 3 × 3 × 3 = 27 MTsat maps. Maps of the relative deviation from the mean of all 27 maps were calculated as well as the SD.
4 RESULTS
4.1 Shape of MT pulse
The FWHMs in the frequency responses (Figure 1, panel C) were very similar for all of the four MT pulses, yielding Δ1/2 = 0.28, 0.30, 0.29, 0.27 kHz for the five-lobe sinc, sinc main lobe, Gaussian and rectangular pulse at their respective pulse durations. The sinc main lobe still showed small sidebands (1.6%) at ±0.48 kHz (21.6% for the rectangular pulse) which imposes a lower limit on Δ to avoid direct saturation. The time-inefficient nature of the five-lobe sinc is demonstrated by the square of the B1 amplitude (Figure 1, panel B) where very little saturation is created by the sidelobes. The increase in tsat by 11.8 ms compared to the sinc main lobe would increase acquisition time by ~45%. If a fixed TR = 26.5 ms and tsat = 4 ms was imposed, the frequency response of the five-lobe sinc was very wide (Δ1/2 = 1.31 kHz at αsat = 91° and 100% SAR). These features confirmed that the appropriate shape of the MT pulse is a shaped single lobe (here a Gauss-filtered sinc main lobe).
4.2 Readout FA
The MTsat maps obtained with different readout FAs were highly consistent (Figure 2). Like at 3T,15 a systematic positive shift of MTsat with increasing αnom is observed where MTsat in WM increased by 0.12 p.u. at αnom = 8° compared to at αnom = 2°.
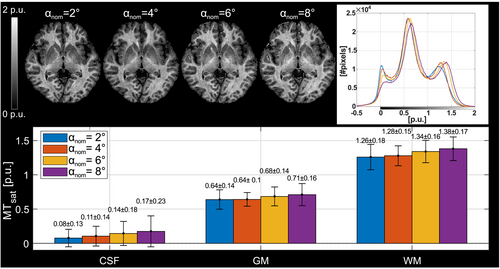
The nominal value of αMT,max in the brain parenchyma, spatially correlated to fT,28 had a median of 12.4°, which would require αnom ≈ 7° for optimal noise progression. In the CSF, progressive saturation at higher αnom due to long T1 leads to lower SNR and a consecutive positive shift due to Rician noise distribution.
A nominal readout FA of αnom = 4° was deemed a suitable compromise between yielding good SNR in the brain parenchyma, limiting the observed bias (average MTsat in WM of 1.28 ± 0.15 p.u. vs. 1.38 ± 0.17 p.u. for αnom = 8°), and preserving a distinct CSF mode in the histograms. This value was thus chosen for the final protocol.
4.3 TR
Increasing TR resulted in only a minor increase of MTsat at TR = 40.3, 45.0 ms in WM (Figure 3). Thus, the shortest possible TR = 26.5 ms allowed by the pulse sequence timing at tsat = 4 ms was chosen for the protocol.
4.4 Offset frequency
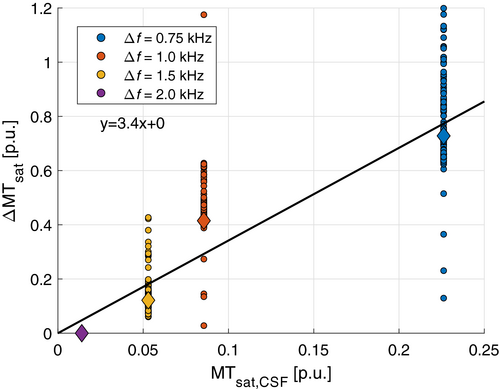
As expected, MTsat increased strongly as Δ was decreased (Figure 4). However, the modes of GM and WM appeared increasingly shifted to higher MTsat resulting in a proportionally larger increase in GM relative WM. The proportion of MTsat in GM relative WM was 0.47/0.50/0.57/0.62 at Δ = 2.0/1.5/1.0/0.75 kHz. This indicates some confounding saturation effect added on top of MT. This shift in observed MTsat, ΔMTsat, followed the increase in CSF very well (Figure 5), indicating that direct saturation of the free water contributes to the increasing MTsat in tissue. The absolute value of Δ was thus set to 2.0 kHz to limit contributions from non-MT sources, predominantly direct saturation, like at 3T.43, 44
4.5 Negative offset frequency
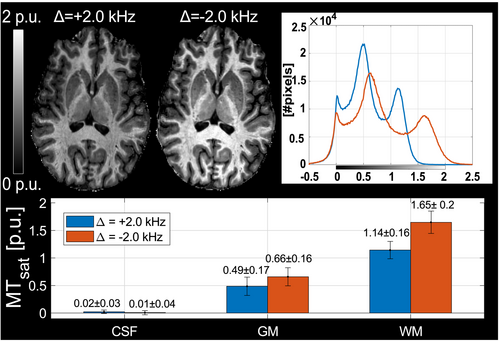
At an offset frequency of Δ = –2.0 kHz, a larger MTsat was observed compared to Δ = +2.0 kHz (Figure 6). Average MTsat increased by 45% in WM (1.14 ± 0.16 vs 1.65 ± 0.20 p.u) and by 35% in GM (0.49 ± 0.17 vs 0.66 ± 0.16 p.u.). This observation is in accordance with the shift of the macromolecular absorption line to lower frequencies.
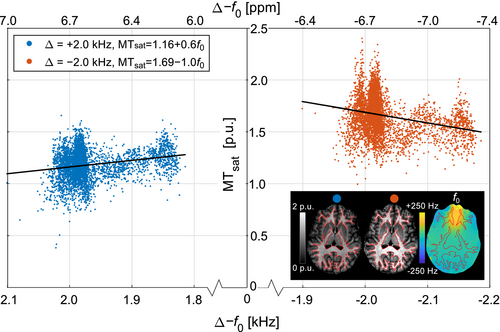
Residual B0 inhomogeneities shift f0 to higher frequencies in most of the brain (82%/71% of WM/GM pixels). In these pixels, a negative Δ will increase the distance to free water (Δ–f0) and to resonances underlying relayed Nuclear Overhauser Effects (rNOE), and thus reduce contributions from these effects. This is reflected by a negative correlation of MTsat to f0 (–1.0 p.u. per kHz) for Δ = –2.0 kHz in WM in an axial slice close to the sinuses (Figure 7). For Δ = +2.0 kHz, a positive correlation (+0.6 p.u. per kHz) is observed when the distance to free water and CEST resonances decreases at higher f0. To maximize MTsat, the MT pulse was applied at Δ = –2.0 kHz in the finalized protocol.
4.6 Residual effects of transmit field inhomogeneities
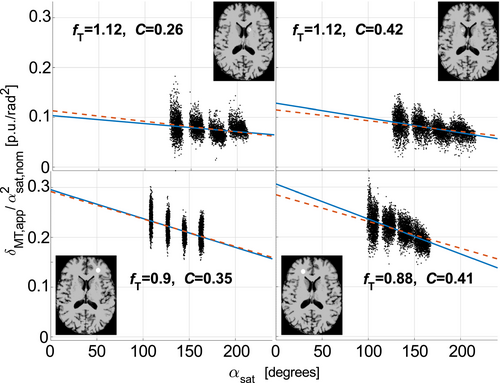
The average C across all ROIs was Cmean = 0.34 ± 0.11. There was no significant difference (P = .25 for a two-tailed student’s t-test) between average C in WM/GM ROIs (0.31 ± 0.09/0.37 ± 0.09). The average coefficient of determination was r2 = 0.20 ± 0.12 across all fits. Figure 8 shows scatter plots of δMT,app/(αsat,nom)2 versus αsat for an example subject, the fitted line, and corresponding C estimate for each of the 4 ROIs. A figure of all four subjects is provided in Supporting Information Figure S1. The decrease of δMT,app/(αsat,nom)2 as a function of local αsat illustrates the additional fT dependence introduced by reduction of Mz,b during the MT pulse. The best fit under the constraint that the combination of slope and intercept results in C = Cmean = 0.34 is also shown. This fit is still in agreement with experimental data since an incremental change in slope and intercept of the line can result in rather large changes in C.
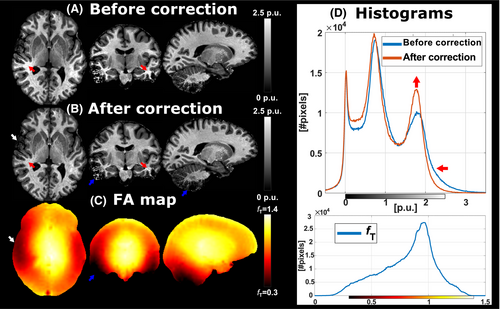
MTsat maps, before and after correction, of one subject (28-year-old male) acquired with the finalized protocol (Supporting Information Table S1) are shown in Figure 9. Substructures within the basal ganglia are clearly delineated and cortical boundaries are well defined. Before correction, however, locations of increased MTsat coincide with those of low transmit field amplitude. This bias was alleviated after the correction which also distinctly narrowed the WM mode in the histogram. MTsat appeared to be somewhat blurrier in peripheral cortical areas where fT < ~0.6. In areas with fT < ~0.3, MTsat was indistinguishable from noise, indicating the limit of the method at 7T.
4.7 Repeatability
Maps of the relative deviation from the average MTsat and the resulting SD can be seen in Figure 10. The median SD in WM was 0.18 p.u. The variability is most prominent in the inferior regions of the cerebellum and temporal lobes. These regions suffer from low transmit field amplitude as well as being more susceptible to physiologic noise caused by breathing.50
5 DISCUSSION
At 7T, limits imposed by SAR and an inhomogeneous transmit field (approximately 0.3 ≤ fT ≤ 1.5, see Figure 9) are exacerbated. Nevertheless, we obtained MTsat maps of a quality comparable to 3T,15, 31, 43, 44 although limitations were observed in areas of low transmit field amplitude (local αsat < ~100°, fT < ~0.6) where MTsat could be somewhat noisier. At very low transmit field amplitude (local αsat < ~60°, fT < ~0.3), reliable estimates for MTsat could not be obtained. In addition to decreasing SNR due to lower αsat, R1 and S0 cannot be reliably determined at very low fT by the underlying DFA experiment when the higher local FA decreases below the Ernst angle.28 It could therefore be beneficial to use multi-channel transmit RF technology and/or dielectric pads51 to improve transmit field homogeneity. The threshold value of αsat (here ~60°) depends on MT pulse shape and duration.
To identify systematic variation, we relied on previous experience at 3T and by empirically studying how MTsat in different tissues changed depending on parameter settings. This was done either through qualitative features such as spatial symmetry or separation of tissue-specific modes in the histograms or quantitatively through the comparison of averages derived from automatic tissue segmentation. A previous report52 was complemented by aspects of TR, offset frequency sign, transmit field correction and repeatability.
5.1 Shape of MT pulse
The implemented sinc main lobe is very similar to the default at General Electric MRI systems53 with a bell shape similar to a Gaussian. The sinc main lobe compares favorably to the pure Gaussian due to higher normalized energy (Q = 1.33 versus Q = 1.61), while still providing sufficiently narrow frequency response. The frequency response of either pulse was very similar, but the Gaussian will lack the small sidebands of the sinc main lobe. Previous work has shown no difference in MTsat for pulses with identical energy,15 and a sinc main lobe should thus be expected to behave very similar to a Gaussian. Last, it should be noted that MTsat is defined for an instantaneous saturation event which further motivates the choice of a short, time-efficient (low Q) pulse, facilitating short TR and acquisition time.
5.2 Readout FA
A small positive shift of MTsat with increasing αnom has previously been described at 3T.15 This effect originates from omitted non-linear terms in the approximate signal equation (Equation (1)), accounted for through a positive bias in MTsat. Regarding the physical interpretation of MTsat, it should be noted that the readout by α may disturb the MT dynamics during TR. By choosing αnom smaller than the optimal 7° regarding SNR, the bias was limited in areas of high fT without sacrificing too much precision. The reduced bias was traded off against decreased SNR in regions of low fT. When targeting a specific structure, noise progression can be optimized to match the local fT.31
5.3 TR
MTsat should increase with TR as this allows more time for MT to reestablish the equilibrium disturbed by the MT pulse.53 A similar small increase of MTsat in the TR range 18 ms ≤ TR ≤ 65 ms has been observed at 3T.15 In this work, the effect was weaker (Figure 3) which may be due to MTsat being smaller than at 3T. An increase in TR could thus only facilitate an increase in MTsat via increased energy of the MT pulse, which would be beneficial for low fT areas. Modification of the MT pulse would require repeating the optimization procedure, especially the calibration of the transmit field correction (Methods 3.6). We instead opted for a shorter measurement, with TR = 26.5 ms which is only slightly longer than the TR = 23.7 ms used at 3T.43, 44
5.4 Offset frequency
Since fitted macromolecular absorption lines have been found to be similar in GM and WM, we expected a proportional increase of MTsat with decreasing frequency offset, in the absence of confounding contributions. In previous work at 1.5 T, T2,b has been estimated to 11.8 ± 1.3 μs and 12.3 ± 1.6 μs in WM and 11.1 μs in cortical GM.48 Another study, also at 1.5 T, reported 10.4 ± 0.5 μs in WM and 9.2 ± 0.4 μs in GM.49 The gradual shift of MTsat at lower Δ is interpreted as being predominantly due to direct saturation in tissue. This interpretation was supported by linear regression of MTsat onto a reference experiment (Δ = +2.0 kHz), as previously applied to harmonize between scanners.17 This experiment showed that ΔMTsat correlated strongly with MTsat in CSF (Figure 5). The higher ΔMTsat at Δ = +1.0 kHz (3.4 ppm) is likely due to overlap with the APT frequency at +3.5 ppm and ensuing CEST. It should also be noted that hydroxyl and amine exchange at +2.5 ppm could influence MTsat at Δ = +0.75 kHz,54 although no obvious overestimation above the line was observed. As Δ = +2.0 kHz corresponds to 6.7 ppm at 7T, we assumed the virtual absence of exchanging resonances as confirmed in rat cortex.55 Our interpretation of direct saturation cannot be explained by the simulated profile (Figure 1C), probably because relaxation effects were ignored. Direct saturation is linked to short T2 of the free pool as observed in myelin water and iron-rich structures which decreases at higher field strength. However, the geometric mean T2s of different structures are proportionally shorter at 7T relative to those observed at 3T.56 Hence, we do not observe tissue-type specific effects.
Arguably, Δ = 2.0 kHz could still be affected by direct saturation. Since ΔMTsat changes gradually with offset frequency, it is not possible to prove the absence of direct saturation. We did not increase Δ beyond 2.0 kHz to avoid further diminishing the already rather weak MTsat and accepted any minor remaining bias. If a wider absolute MTsat difference between tissue types is desired, this could be achieved by decreasing Δ. This would involve some trade-off against a higher degree of direct saturation and various other effects, which would impair specificity to traditional MT.
5.5 Negative offset frequency
It is customary to apply the MT pulse at a positive Δ.2, 15, 48, 57 However, it has been shown that the super-Lorentzian absorption line of the macromolecules is shifted toward lower frequencies relative free water resonance.14 The shift in Hz between peak macromolecular response and free water resonance scales with B0. We exploited this asymmetry to considerably increase MTsat (Figure 6), without creating more direct saturation or increasing SAR. The rNOE exchange is present on the negative side of the water resonance and it is possible that some contaminating saturation occurred because of this, even at the rather large offset of Δ = –2.0 kHz (–6.7 ppm).6 However, based on previously published experimental results from rat cortex in vivo, these effects are expected to be small compared to our MTsat values.55 In this study, eight consecutive 180° saturation pulses, comparable to our MT pulse (B1,rms = 2 μT, tsat = 13.8 ms) were applied and the observed saturation due to rNOE amounted to <0.5% at −6.7 ppm. Furthermore, the overall increase in MTsat at Δ = –2.0 kHz cannot be explained by B0 offset (represented by f0) which mostly shifted Δ– f0 toward lower values (ie, Δ = –2.0 kHz away from water). The majority of the observed increase in MTsat is thus interpreted to be caused by a shifted absorption lineshape. The observed B0-dependence (Figure 7) could be a combined effect of changing the saturation of macromolecules, CEST as well as direct saturation of free water. The specific influence of rNOE could possibly explain the somewhat stronger correlation for Δ = –2.0 kHz compared to Δ = +2.0 kHz. This difference is in the same order of magnitude as the additional saturation from rNOE exchange based on the experimental results on the rat cortex.55 Large shifts occur mainly above the nasal sinuses and even in these pixels, strong deviations in MTsat were not observed. In 94% of pixels, |f0| was below 100 Hz (0.34 ppm). We thus conclude that an MT pulse with FWHM = 300 Hz (1 ppm) applied at −2.0 kHz (−6.7 ppm) yield a satisfactory safety margin of 2.45 ppm to the closest expected rNOE resonance at −3.75 ppm.6
5.6 Residual effects of transmit field inhomogeneities
The inherent correction of MTsat was insufficient at 7T due to the strong transmit field inhomogeneities. The post hoc correction clearly improved the homogeneity of MTsat, especially in WM (Figure 9). In view of the relatively large variation in C observed across the 16 ROIs, we ignored underlying differences in B between GM and WM to perform a global post hoc correction.
This post hoc correction is implemented in the hMRI toolbox,19 albeit with a different weighting factor (C = 0.40 as derived at 3T for a Gaussian MT pulse of αsat,nom = 220°32). This control variable should be changed based on MT pulse when using the toolbox. For αsat,nom = 180°, this correction factor would be scaled to C = 180°/220°∙0.40 = 0.33 (ignoring small differences in pulse shape and negative frequency offset) which is close to C = 0.34 ± 0.11 determined experimentally in this study. This correction implicitly assumes the absence of confounding contributions to MTsat.
5.7 Repeatability
The high SD in the cerebellum and temporal lobes illustrates the limitation of the method imposed by low transmit field amplitude as well as physiological noise affecting B0. The latter, caused by chest movement due to breathing, could potentially be remedied using data-driven post-correction methods of the raw k-space data.50
5.8 Limitations
Due to the recursive nature of the optimization procedure, parameter settings in some experiments did not reflect the final protocol (Supporting Information Table S1). For instance, the positive frequency offset in experiment 3.4 (Figure 4) demonstrates APT resonance but does not access the upfield rNOE exchange. However, the purpose of this experiment was to minimize direct saturation as a confounding mechanism of saturation. This was then followed by an upfield-downfield comparison. Minor confounding effects are likely to remain, making the semi-quantitative MTsat metric proportional to, albeit not identical to, the bound pool size ratio, Fb, modeled by fully quantitative approaches. In the MPM approach, this is traded in against speed and high resolution. In areas of very low transmit field (fT < ~0.3), however, MTsat could not be determined using this fast protocol.
6 CONCLUSIONS
This study resulted in the following recommendations for setting up an MTsat protocol at 7T: (a) Short MT pulse with a compact shape and sufficiently narrow frequency response. (b) Small readout FA without punishing SNR too much. (c) Minimum TR (as decided by pulse sequence timing) to maintain short scan time. (d) Absolute offset frequency of 2.0 kHz to reduce confounding direct saturation, CEST, and rNOE exchange. (e) Negative sign of the offset frequency to induce more MT. This is a consequence of the shifted lineshape and benefits from higher B0. (f) Separate FA-mapping for post hoc correction.
ACKNOWLEDGMENTS
The project was funded by the Swedish Research Council (NT 2014-6193 and MH 2017-00995). Lund University Bioimaging Center (LBIC) is acknowledged for experimental resources (equipment grant VR RFI 829-2010-5928).
CONFLICT OF INTEREST
Mads Andersen is employed by Philips Healtchare.


