Quantitative susceptibility mapping of articular cartilage: Ex vivo findings at multiple orientations and following different degradation treatments
Funding information: The authors gratefully acknowledge financial support from the Academy of Finland (grants #285909, #293970, #312343) and the Finnish Cultural Foundation, North Savo Regional fund
Abstract
Purpose
We investigated the feasibility of quantitative susceptibility mapping (QSM) for assessing degradation of articular cartilage by measuring ex vivo bovine cartilage samples subjected to different degradative treatments. Specimens were scanned at several orientations to study if degradation affects the susceptibility anisotropy. T2*-mapping, histological stainings, and polarized light microscopy were used as reference methods. Additionally, simulations of susceptibility in layered geometry were performed.
Methods
Samples (n = 9) were harvested from the patellae of skeletally mature bovines. Three specimens served as controls, and the rest were artificially degraded. MRI was performed at 9.4T using a 3D gradient echo sequence. QSM and T2* images and depth profiles through the centers of the samples were compared with each other and the histological findings. A planar isotropic model with depth-wise susceptibility variation was used in the simulations.
Results
A strong diamagnetic contrast was seen in the deep and calcified layers of cartilage, while T2* maps reflected the typical trilaminar structure of the collagen network. Anisotropy of susceptibility in cartilage was observed and was found to differ from the T2* anisotropy. Slight changes were observed in QSM and T2* following the degradative treatments. In simulations, anisotropy was observed.
Conclusions
The results suggest that QSM is not sensitive to cartilage proteoglycan content, but shows sensitivity to the amount of calcification and to the integrity of the collagen network, providing potential for assessing osteoarthritis. The simulations suggested that the anisotropy of susceptibility might be partially explained by the layered geometry of susceptibility in cartilage.
1 INTRODUCTION
MRI of articular cartilage is one of the best tools for the clinical diagnosis of cartilage diseases, such as osteoarthritis (OA). While quantitative MRI (qMRI) is widely used for imaging of OA, many qMRI parameters, such as T1, T2, and T1ρ, depend on the MRI hardware, sequences and sequence parameters used and on the orientation of the subject or specimen in the magnetic field.1-3 Even though many of the qMRI parameters have been shown to be sensitive to different properties of articular cartilage and sensitive to degenerative changes, they also tend not to be very specific; the parameters typically reflect different relaxation processes, which in turn depend on numerous aspects of the tissue properties.1, 2 Exceptions to this are potentially gagCEST and 23Na MRI methods, which are specific to proteoglycans, or diffusion imaging, which is specific to (collagen network) structure. These methods, however, are technically very demanding,4, 5 limited in SNR and may even require specific hardware. Many of the qMRI parameters are also time consuming to scan and are usually limited to a few 2D slices instead of imaging the whole volume of interest. To overcome at least the spatial coverage and resolution limitations, we propose the use of QSM, which aims to resolve the magnetic susceptibility distribution within the imaging target.6-11 While QSM is an established MRI method, it has mainly been used for imaging of the brain.10-12 Recently, there has been increasing interest in applying QSM outside the brain, including the musculoskeletal system.12-17
OA induces structural alterations and changes in the constituents of articular cartilage. One of the OA-related changes in cartilage is alteration in the amount of calcification.18, 19 OA-changes may be manifested as multiplications of the tidemark, which is a line separating the noncalcified cartilage from the calcified cartilage.19-21 Calcifications are known to alter tissue susceptibility and thus affect QSM contrast.9, 22 Furthermore, OA induces changes in the water and proteoglycan contents of articular cartilage and causes breakdown of the collagen molecules, altering the structural integrity and organization of the collagen fiber network.23 Changes in such organized collagenous structures are known to affect QSM contrast.12, 13, 24, 25
The aim of this study was to find reliable methods for ex vivo QSM of articular cartilage and to investigate the sensitivity of QSM to different degradation treatments of articular cartilage. Acknowledging the known orientation dependence of several MRI parameters (including QSM) in cartilage,12, 13, 26-28 we also investigated the anisotropy of the susceptibility.12, 13, 27 Because the primary aims of this study were to evaluate methodological aspects as well as the sensitivity of QSM to variations in cartilage properties and constituents, the sample group was chosen to be broad in terms of cartilage degradations, although not very large in size. We hypothesized that susceptibility is sensitive to changes in the different tissue constituents induced by degradation treatments, especially to changes in calcification and to changes in the structural integrity of the collagen network that mimic the degenerative changes in articular cartilage in osteoarthritis.
To test these hypotheses, QSM was performed using a gradient-recalled multi-echo sequence on specimens of bovine patellar articular cartilage that were subjected to several different artificial degradations.29 To evaluate the anisotropy of the susceptibility, the specimens were scanned at several different orientation angles with respect to the main magnetic field. Furthermore, to investigate the biophysical basis of changes in QSM contrast, the findings were compared with the T2* relaxation time, semiquantitative histology of proteoglycans and quantitative polarized light microscopy of the collagenous network.
2 METHODS
2.1 Sample preparation and treatments
Cylindrical cartilage–bone plugs (diameter = 6 mm; n = 9) were prepared from the patellae of three skeletally mature bovines (one patella from each animal) obtained from a local slaughterhouse; three adjacent plugs were extracted from each patella. All the plugs were immersed in phosphate buffered saline (PBS) solution containing enzyme inhibitors (Benzamidine hydrochloride, ethylenediaminetetraacetic acid) and frozen at -20 °C after extraction. Before imaging, the plugs were thawed at room temperature and subjected to the treatments. One plug from each knee was left untreated to serve as a control.
Treatments were chosen based on their previous use in studies of cartilage–bone samples: trypsin has been used to study the effects of the proteoglycan loss and nonspecific degradation of the cartilage extracellular matrix, changes similar to those in OA.18, 23, 30 Collagenase has been used to simulate the destruction of collagen in articular cartilage31 However, collagenase is typically allowed to affect only the superficial layers.31 Because the effect of collagenase is limited to the depth it is allowed to penetrate, thermal treatment was also used to induce denaturation of the collagen fibers throughout the tissue depth. Ethylenediaminetetraacetic acid (EDTA), typically used to demineralize osseous specimens for histology was used to modify or remove calcifications from the samples.32
To evaluate the effect of changes in calcification on susceptibility, two of the plugs (from two patellae) were decalcified with 5% EDTA in PBS for 3 weeks. To reduce the proteoglycan content and to induce nonspecific cartilage degradation, two of the plugs were degraded using 0.5 mg/mL trypsin (Sigma Aldrich, trypsin from bovine pancreas). Trypsin degradation was performed in an incubator (treatment time = 9 h; temperature = 37 °C; CO2 = 5%) and was stopped by immersing the samples in fresh PBS containing enzyme inhibitors. In an attempt to induce further denaturation and degradation of the collagen fibers, the last two plugs (from the third patella) were first degraded using trypsin as described above and then further damaged with either thermal treatment (immersed in a PBS-filled sealed test tube in a water bath at 60 °C for 15 min) or collagenase enzyme (30 units/mL, Sigma Aldrich Collagenase Type VII from Clostridium histolyticum, treatment time = 22 h; temperature = 37 °C; CO2 = 5%). Both trypsin and trypsin+collagenase treatments were conducted in PBS without enzyme inhibitors.
2.2 MR imaging
To match the susceptibility and eliminate the signal from outside the samples, the samples were immersed in 1H MRI-signal-free perfluoropolyether (Galden HS240, Solvay, Brussels, Belgium) inside a custom-built holder, which allowed rotation of the specimens with respect to B0. Scans were performed at 9.4T using a small-bore Varian scanner and a 19-mm-diameter quadrature RF volume transceiver. Samples were imaged at 5 different orientations (0 °, 25 °, 45 °, 65 °, and 90 ° of the tidemark normal) with respect to B0. At each orientation, 3D gradient echo (GRE) data were acquired with 6 echoes using monopolar readout gradients (TR = 150 ms, Flip Angle = 23 °, TE = 2.00–17.25 ms, ΔTE = 3.05 ms, isotropic voxel size of 94 × 94 × 94 µm3, bandwidth = 150 kHz). It has been shown that the use of multi-echo data and an appropriate fitting procedure is more reliable for field map estimation than using a single-echo GRE,33-35 thus multi-echo data were collected.
2.3 Image processing
Both susceptibility (χ) and T2* maps were calculated for the data acquired from each imaging orientation separately. Figure 1 summarizes the steps in the postprocessing algorithm used (Figure 1). T2*-maps were calculated by fitting a two-parameter linearized single exponential model in a voxel-wise manner. For QSM postprocessing, an initial region of interest (ROI) mask that contained all of the cartilage was created by thresholding the intensity image from the first echo of the multi-echo gradient-echo -sequence. Then, T2*-maps were calculated using this initial mask. Finally the initial mask was manually corrected for QSM processing to avoid noisy voxels and fat signal affecting the dipole inversion step. The manual correction of the initial tissue mask was performed using the M0-map (i.e., the signal intensity term at TE = 0, that is obtained from T2*-fitting) as a guide.
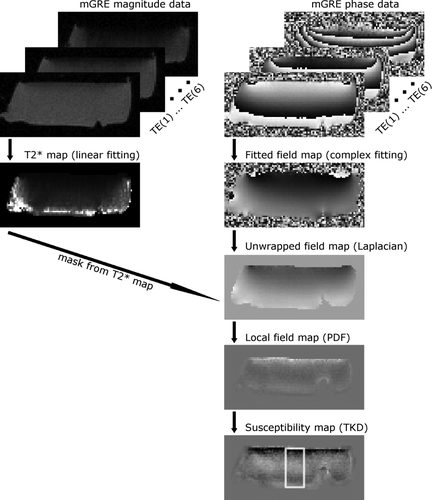
The data processing chain used in this study. First, GRE data were acquired. Then, T2* fitting was performed on the magnitude data and complex fitting was used to calculate the total field map. The field map was unwrapped using Laplacian unwrapping and then masked using a binary mask obtained from T2* fitting and magnitude image of the first echo. The background field contribution was removed from the total field map using the PDF method and, finally, the susceptibility was calculated from the local field map using the TKD algorithm with correction for susceptibility underestimation. An example of the ROI used in profile calculations is shown with a white rectangle on the QSM image
The complex-fitting procedure,36-38 which is available as a part of the MEDI toolbox39 for fitting the multi-echo data, was used to calculate the field maps. The last two echoes were neglected from the complex fitting as they were too noisy near the cartilage–bone interface. Laplacian unwrapping40 (threshold parameter σ = 10−10) was chosen for the unwrapping of the phase data. The background field was then removed using the projection onto dipole fields (PDF) method41, 42 also available as part of the MEDI toolbox.39 For an additional test of SNR near the cartilage–bone interface, we used a pipeline where the individual echoes from the MGRE acquisition were separately converted to field maps and then averaged before the dipole inversion.
Different methods for background field removal were tested as there were not many published ex vivo cartilage experiments that could serve as examples. In the brain, a comparison between several background field removal methods has been performed.43 Because none of the methods were reported to be fundamentally superior over the others near the boundaries,43 we based our choice on evaluation with the study data. In addition to PDF, SHARP (sophisticated harmonic artifact reduction for phase), V-SHARP (SHARP with variable kernel size), and LBV (Laplacian boundary value) 8, 44, 45 methods were tested for background field removal because minimal erosion with good boundary accuracy was deemed critical: the cartilage layers at the ends of articulating bones are very thin (generally only a few mm) and especially the tidemark or calcified cartilage–bone interface is right at the ROI boundary. The threshold for SHARP and V-SHARP was 0.02, the kernel radius for SHARP was 5 voxels, and for V-SHARP it varied between 1 and 5 voxels. For LBV and V-SHARP, a boundary erosion of 1 voxel was performed while in PDF, two voxels were eroded and in SHARP the erosion was five voxels. Eventually, besides the PDF method, also LBV was tested with the full processing pipeline for one sample.
Finally, the susceptibility maps were calculated using truncated k-space division (TKD) 7 with δ = 2/3, the kernel constructed appropriately for each orientation and corrected for susceptibility underestimation.46 TKD is a robust and fast method and provided consistent results.47 The susceptibility was referenced with respect to the mean susceptibility of the whole cartilage. All processing and analysis was performed using Matlab (MATLAB R2014a, The Mathworks, Natick, MA).
2.4 Histological analyses
 (
(
 ) was calculated from the PLM fiber orientation images as follows:
 ()
() is the pixel-wise local entropy of a 5 × 5 pixel region in the collagen fiber orientation image. This measure closely matches the true anisotropy of the collagen fiber network and was used due to lack of access to the raw PLM data which could have been used to calculate the true anisotropy as described earlier.50
2.5 Data analysis
 ()
() and
and
 are maximum and minimum of the vertical T2*-profiles over orientations at depth
 . For χ, the anisotropy was defined as:
 ()
() and
and
 are the maximum and minimum of the susceptibility over orientations at each depth point and
 and
and
 are the maximum and minimum of the susceptibility profiles over all orientations and all depths. Global values were used in the calculation of the susceptibility anisotropy because the susceptibility values are relative to each other and thus the maximum variation between them is a better normalization factor than the local variation. Because the thickness of cartilage varied slightly between the samples, the thickness was normalized to allow comparisons between the specimens and orientations. All calculations and analyses were performed using the Aedes image analysis tool (http://aedes.uef.fi) and in-house written plugins in Matlab.
2.6 Simulations of susceptibility mapping at different orientations
As the observed susceptibility anisotropy did not follow the pattern expected from the PLM results, we investigated this further by performing simulations. Susceptibility maps in cylindrical geometry were simulated at different orientations with respect to B0 using a relatively simple isotropic model having only planar, depth-wise susceptibility variations. A more detailed description of the simulations is available in the Supporting Information.
2.7 Data availability
All of the raw data, documentation and analysis codes of the study are available for download at Zenodo (https://doi.org/10.5281/zenodo.823917).
3 RESULTS
3.1 Histology
The mature bovine patellar articular cartilage studied here demonstrated the three typical layers of histological structure: superficial, transitional and deep radial layers, which are determined by the collagen fiber architecture as follows: superficial layer has a high anisotropy and 0 degree fiber angle, transitional layer has the lowest anisotropy and the deep radial layer has nearly 90 degree fiber angle and high anisotropy (Figure 2). Histological analysis confirmed that the different treatments had limited effects on the structure of the cartilage (Figure 2); especially the collagen fiber angles appeared similar in all treatment groups and the most significant visual change was the thinning of superficial layer in degraded samples (Figure 2). The decalcification treatment by EDTA softened the cartilage and the subchondral bone before the MRI experiments. However, the effects of decalcification are not clearly visible, as every sample had to undergo decalcification before histological processing (Figure 2). However, a small reduction of PLM anisotropy, as well as a small reduction of the Safranin-O staining in the layer of calcified cartilage were noted in the EDTA-treated samples compared with the untreated samples (Figure 2).
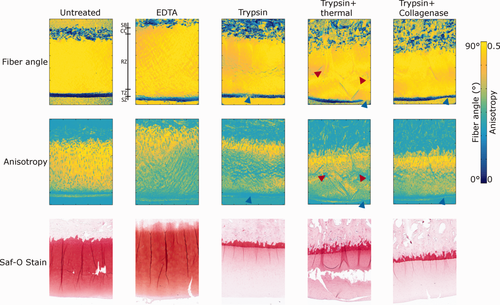
Results from polarized light microscopy and Safranin-O staining of differently degraded cartilage samples. The cartilage surface is downward in all images. The first row depicts the collagen fiber angle for differently treated samples as measured by PLM. The second row shows the anisotropy that is calculated from the PLM-fiber angle image. The anisotropy is restricted between 0 and 1 by the definition of Equation 1. Here, 0.5 is used as the upper limit to enhance the contrast. The third row shows Safranin-O-stained slices from each degradation group. Bar next to the fiber angle image from the EDTA-treated group indicates the histological zones of the cartilage: SZ, superficial zone; TZ, transitional zone; RZ, radial (Deep) zone; CC, calcified cartilage; SB, subchondral bone. Blue triangles display possible superficial damage in trypsin-involving degradations and red triangles point collagen network damage in trypsin+thermal treatment
In the trypsin treated samples, near-complete depletion of the proteoglycans was shown by the lack of Safranin-O staining (Figure 2). Trypsin treatment also reduced the collagen fiber anisotropy slightly (Figure 2). The trypsin+thermal treatment affected the structure of the cartilage by causing cracks and altering the fiber orientation as well as the anisotropy inside the cartilage (Figure 2). Safranin-O staining of the trypsin+thermally treated sample was more intense than that of the other trypsin-treated samples, although less than that of the untreated samples. The effects of trypsin+collagenase treatment were more limited: some damage of the superficial cartilage was evident, but otherwise the collagen structure of cartilage remained intact (Figure 2). Findings from H&E staining are presented in Supporting Information Figure S4, which is available online. H&E staining was performed to verify that all samples had normal structural components: articular cartilage, calcified cartilage, and subchondral bone. H&E stains did not reveal further features of the degradations (Supporting Figure S4).
3.2 MRI
Of the tested background field removal methods, PDF was found to be the most robust in the present dataset and was thus used in the further analysis. The other methods resulted in a dark shade in the deep cartilage and appearance of these shades was similar to the fields from cortical bone that was located next to the ROI boundary (Figure 3). Comparison of different processing pipelines yielded interesting results. While both the complex fitting and averaging pipeline were fairly similar, the change from PDF to LBV had a very large effect on the resulting susceptibility map (Figure 4). By the use of LBV, the susceptibility contrast had a strong change from diamagnetism to paramagnetism through the depth of the cartilage.

The effects of different background field removal methods in cartilage. PDF removed background fields most effectively while also needing erosion of only two voxels. LBV and V-SHARP required even less boundary erosion but did not seem to remove background field as effectively as PDF: these residual fields can be seen as dark shadows in the deep cartilage layers (see white arrows). SHARP required more ROI erosion. The grayscale bar indicates the magnitude of field map after background field removal. Please see online Supporting Information for further comparisons
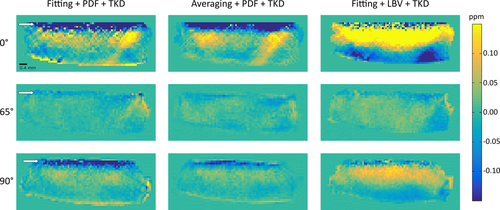
Differences between QSM-processing pipelines at different orientations for a representative untreated sample. On the left is the pipeline used in the analyses in this study; in the middle, averaging of the field maps from individual echoes is used instead of complex fitting. On the right, LBV is used instead of PDF. Between the complex fitting and averaging, there are only minor changes in the contrast and noise. Using LBV produces different results compared with PDF; there is a stronger change from diamagnetism to paramagnetism in the middle of deep zone of cartilage at the 0 ° and 90 ° orientations
In the PDF-processed data, the extremes of the susceptibility were less intense, apart from the calcified cartilage zone. To simulate a higher SNR case, an ROI was defined with the deepest (noisy) parts of cartilage left out and the processing was tested using LBV and PDF. LBV appeared to be more dependent on the properties of the signal (to be less robust), because there was a large difference between the full ROI and the limited ROI, where a few boundary pixels were excluded (Supporting Information Figures S2 and S3). Different ROI depths and LBV processing options (tolerance and number of iterations) were tested, but without meaningful effects on the findings. Based on the comparison between PDF and LBV with available data, PDF was chosen for further evaluation of the results in this cartilage degradation study. The slight differences between fitting+PDF and averaging+PDF are believed to be caused by the differences in how these methods react to the measurement noise. Because this difference is small, we chose to use fitting procedure due to its previous use.
The susceptibility and T2*-maps (Figures 5 and 6) differed from each other. The susceptibility showed the largest variations near the cartilage–bone interface, whereas T2* varied mostly in the superficial and transitional cartilage zones. However, susceptibility and T2* also had some similar characteristics: both were orientation dependent and both had the most homogeneous contrast close to the magic angle i.e. at 65 ° (Figures 5 and 6).
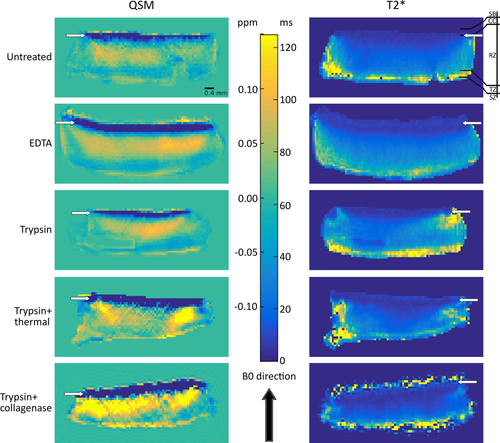
Examples of differently treated cartilage samples at the 0 ° orientation with respect to B0. The white arrows point out the cartilage–bone interface. The first column contains QSM images for each degradation group at the 0 ° orientation. The second column contains the corresponding T2*-relaxation time maps. Bar next to the T2*-map of the untreated sample displays the different zones of the cartilage: SZ, superficial zone; TZ, transitional zone; RZ, radial (deep) zone; CC, calcified cartilage; SB, subchondral bone
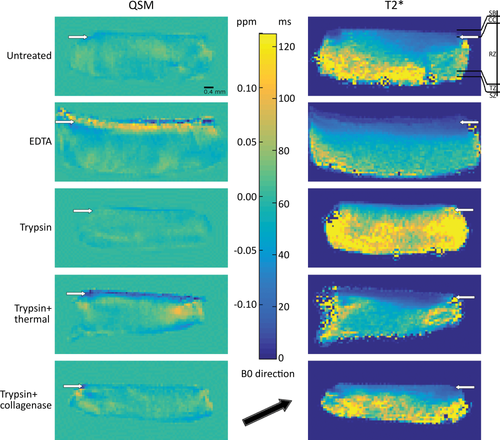
Examples of differently treated cartilage samples at the 65 ° orientation with respect to B0. The white arrows point out the cartilage–bone interface. The first column contains QSM images for each degradation group at the 65 ° orientation. The second column contains the corresponding T2*-relaxation time maps. Bar next to the T2*-map of the untreated sample displays the different zones of the cartilage: SZ, superficial zone; TZ, transitional zone; RZ, radial (deep) zone; CC, calcified cartilage; SB, subchondral bone
The different treatments had a limited effect on QSM or T2*. The most notable changes happened at the surface of the samples in the T2* maps, where the superficial T2* values were increased after treatments that involved trypsin, also affecting the tri-laminar appearance (Figures 5 and 6). EDTA treatment made the bony structures at and beyond the cartilage–bone interface visible in MRI (Figure 7) and, therefore, both maps could be calculated beyond the interface (Figures 8-10).
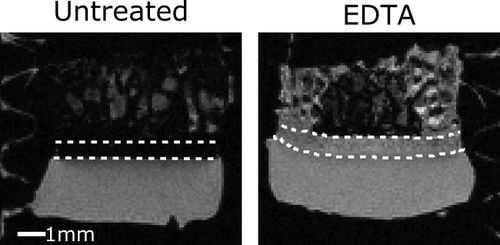
An illustration of the effect of the EDTA treatment on the MRI signal in bone. The dashed white lines in these magnitude images at TE = 2 ms depict the area of subchondral bone that became visible at TE=2 ms in the EDTA-treated samples. Note, that images are from two different samples, but from corresponding midpoint locations
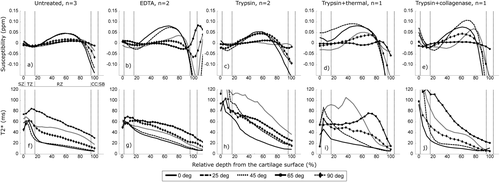
A–J: QSM and T2* depth profiles of differently treated cartilage samples at different orientations relative to the main magnetic field. Vertical lines indicate the different structural zones as follows: SZ, superficial zone; TZ, transitional zone; RZ, radial (deep) zone; CC, calcified cartilage; SB, subchondral bone
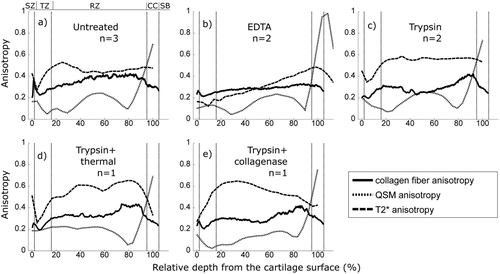
A–E: Anisotropies calculated from the QSM and T2* profiles compared with the PLM anisotropy of the collagen fibers (see Equations 1, 2, and 3). Vertical lines indicate the different structural zones as follows: SZ, superficial zone; TZ, transitional zone; RZ, radial (deep) zone; CC, calcified cartilage; SB, subchondral bone
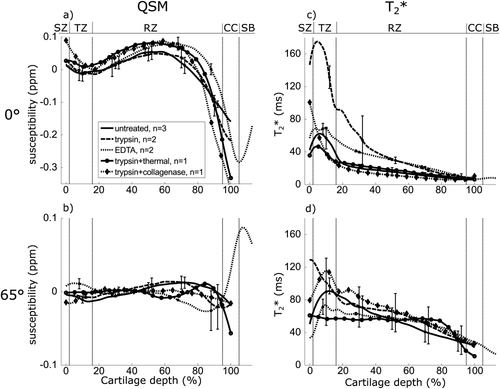
A–D: Comparison of the effects of the treatments on QSM and T2* depth profiles at the 0 ° and 65 ° orientations with respect to B0. The different structural zones are indicated by the vertical lines as follows: SZ, superficial zone; TZ, transitional zone; RZ, radial (deep) zone; CC, calcified cartilage; SB, subchondral bone. Two of the treatment groups, trypsin+thermal and trypsin+collagenase, only had one sample and thus error bars were not defined
The cartilage–bone interface appeared paramagnetic in the EDTA-treated sample at 65 ° (Figures 6 and 8). At the 45 ° and 65 ° orientations, the susceptibility depth profiles appeared the least variable, while at the other orientations, the susceptibility values varied over the cartilage depth: most notably the deep cartilage and cartilage–bone interface regions displayed clear diamagnetism (Figure 8). The susceptibility increased from the superficial tissue toward the deep tissue before decreasing sharply near the cartilage–bone interface (Figures 8 and 10) especially at or near 0 ° and 90 °, the orientations equivalent to those of the cartilage in the weight-bearing femoral region and the patellar or posterior femoral regions in in vivo MRI scans. QSM profiles demonstrated relatively small differences between the treatments, as exemplified at 0 °and 65 ° (Figure 10). EDTA treatment had a small effect on T2*-values of the samples, as the T2* was prolonged at 0 ° and 90 ° orientations at the boundary of transitional and radial cartilage zones. T2* was prolonged by the trypsin treatment, especially at 0 ° (Figure 10). Denaturation of the collagen fibers by thermal or collagenase treatment appeared to have a strong effect on both T2* and susceptibility, affecting the profiles throughout cartilage depth (Figures 8 and 10).
T2* had the expected anisotropy, generally higher than the anisotropy of the collagen fibers as determined by PLM, but with similar depth-wise behavior (Figure 9). In all but the EDTA-treated specimen, the highest T2* anisotropy was observed approximately at the boundary of the transitional and deep zones and remained somewhat constant through the deep zone, followed by the superficial zone and the lowest anisotropy was seen in the transitional zone (Figure 9). In the EDTA-treated sample the T2* anisotropy was highest at the calcified cartilage layer. The T2* anisotropy of the trypsin+collagenase-treated specimens was minimal in the superficial zone, likely indicating major structural damage (Figure 9). However, PLM findings displayed only minor damage to the superficial collagen fibers in the collagenase-treated sample (Figure 2). While susceptibility anisotropy was found in all treatment groups, it appeared to be different from the T2* and collagen network (PLM) anisotropies (Figure 9). The χ anisotropy appeared to be lower than that of T2*- or PLM-measured anisotropy and while it displayed small variations throughout most of the cartilage, these variations did not follow the variations in the PLM or T2*-anisotropy. Interestingly, the χ anisotropy was highest at the calcified cartilage layer for all treatment groups (Figure 9).
3.3 Simulations
In the simulations of planar, layered susceptibility geometry reminiscent of cartilage structure, the susceptibility maps appeared anisotropic (Supporting Information Figure S1F–H), although the modeled susceptibility was isotropic. Detailed simulation results can be found in the Supporting Information.
4 DISCUSSION
In this study, we investigated whether changes in the magnetic susceptibility of articular cartilage are related to degradation treatments designed to mimic biologically relevant changes in cartilage due to disease processes. We hypothesized that susceptibility in articular cartilage, in addition to collagen fiber orientation, depends on changes in calcification, an alteration shown to take place in cartilage degeneration18, 23 Furthermore, we hypothesized that the changes in anisotropy of susceptibility would follow those of the anisotropy of the collagen network. These hypotheses were investigated using bovine articular cartilage as a model cartilage tissue with several different treatments to alter the tissue properties.
The results of our study suggest that susceptibility in cartilage is not highly sensitive toward the changes induced by the different degradative treatments used. Small changes in EDTA and thermally treated samples were observed but trypsin treatment did not seem to strongly affect QSM. Our findings also showed that the susceptibility of cartilage appears to be anisotropic, but this anisotropy needs to be studied more closely given the results of our simulations (see discussion below) and because it appears markedly different from the collagen fiber anisotropy. The T2* anisotropy seemed to follow the pattern of the collagen fiber anisotropy, although the T2* anisotropy was generally stronger than the collagen fiber anisotropy. In our study, we also demonstrated that the background field removal step has a significant effect on ex vivo cartilage QSM.
It is worth to note that in a recent review about different background removal methods,43 it was concluded that the differences in corrected field maps were minimal between different background field removal algorithms. However, in this study, substantial differences between PDF and LBV were found. Due to this observation, a further study on QSM processing methodology in cartilage is warranted.
The histological findings (Figure 2) revealed a normal proteoglycan content in the untreated samples and a drastic reduction with the trypsin treatment, as expected. We also observed a disruption of the superficial collagen meshwork with collagenase treatment and a change in the collagen anisotropy and structure throughout the tissue after the thermal treatment. The decalcification treatment with EDTA caused notable changes in the T2* values of the deep cartilage layers (Figure 8) and a reduction of the T2* anisotropy (Figure 9). EDTA decalcification slightly increased the susceptibility in the deep cartilage layer and at the region of calcified cartilage, especially at the 65˚ orientation. This effect, however, was not as clear as we had expected, which either indicates that calcifications in cartilage are not the primary determinant of the susceptibility contrast or that the EDTA treatment did not fully remove calcifications from the tissue. In this case, EDTA may have chelated calcifications from the bony structures, but residues still remained in the tissue.
4.1 Anisotropy in cartilage
The T2* anisotropy behaved as expected, following the pattern of anisotropy variation of the collagen fiber network in cartilage, albeit at a generally higher level. The anisotropy of the susceptibility was expected to follow that of collagen as well, because the collagen anisotropy is expected to be the source of the orientation dependence.12 A strong susceptibility anisotropy was observed only at the cartilage–bone interface (Figure 9). Furthermore, the observed anisotropy did not follow the pattern of the collagen anisotropy as revealed by PLM. We suspect that this might have arisen from the planar cartilage structure contributing to apparent susceptibility anisotropy.
To investigate this further, we performed simulations of QSM in layered susceptibility distribution at different orientations using a simple isotropic model having only planar, depth-wise susceptibility variations and no susceptibility anisotropy. The simulations indicated an apparent anisotropy of the susceptibility in the planar model when rotated in magnetic field, resembling the susceptibility anisotropy observed for cartilage, even though there was no anisotropy incorporated in the model (see Supporting Information).
In two recent reports looking at the susceptibility of different ordered tissues outside the brain12 and in the cartilage,13 it was noted that collagen fibers appear diamagnetic when they are oriented along the magnetic field.12, 13 In our experiments at the 0 ° orientation, the susceptibility increased toward the deep cartilage until a sudden drop to diamagnetic values at the cartilage–bone interface. This is vastly different from the findings of Wei et al,13 who observed susceptibility decrease from the surface toward the deep cartilage. At or near the magic angle, the susceptibility was approximately constant throughout the cartilage, similar to the ex vivo findings of Wei et al.
A difference between our ex vivo experiments and those by Wei et al13 appears to be that they may have removed the underlying bone before the scans, which could result in removal of the deepest parts of the cartilage and the tidemark region, as well as in changes to the collagen fiber structure in the deep cartilage (spreading of the fibers). Another difference is that, while we used bovine patellar cartilage, they studied pig femoral cartilage, introducing biological variation between the results. This, however, is not likely to explain the observed difference in the relative susceptibility values, because the collagen network structure of mature articular cartilage is fairly similar between these species.54 This similarity between the different mammal species suggests that similar results should be obtained from human cartilage as well. However, it may be possible that different anatomical locations between cartilage samples (patella and femur) may exhibit differences. The reasons for this difference, however, remain unknown, warranting further research into QSM of cartilage. However, the observations should be understood in the context of the apparent anisotropy observed in our simulations and with the absence of susceptibility referencing, concerning the entire field of research (see Limitations below). The in vivo results of Wei et al13 also differ from our observations. However, direct comparison of QSM between the in vivo and ex vivo situations may be impractical in cartilage, because in vivo the voxel size is much larger and may cause partial volume effects that smooth out the depth-wise changes too much for direct comparison. On the other hand, the in vivo situation also has an advantage in that there are many different tissues in one image and referencing (or normalization) of cartilage susceptibility values is easier.
Overall, based on our results and the report by Wei et al,13 QSM may be better at detecting local tissue damage, such as lesions and cracks in cartilage rather than baseline changes throughout the tissue.
4.2 Effect of degradation treatments
Decalcification with EDTA prolonged T2* relaxation time values so that the bony region became visible even at echo times greater than 2 ms. The susceptibility increased only slightly in the bulk of the cartilage with the EDTA treatment, which may indicate that collagen fibers and their orientation are more significant contributors to susceptibility contrast within cartilage than calcification. However, the susceptibility difference in the calcified cartilage between the EDTA-treated and other samples was greatest at the 65 ° orientation. As the simulations showed that the planar layer structure was not strongly visible close to the magic angle, the increased susceptibility values in the calcified cartilage at the 65 ° orientation (closest to the magic angle) may reflect decalcification. EDTA treatment also had a minor effect (an increase) on the T2* values and also decreased the T2* anisotropy of these samples (Figures 8 and 9).
Trypsin treatment had a negligible effect on the susceptibility, but slightly prolonged T2*, which is consistent with previous findings.30 Manipulation of the collagen network, i.e., trypsin+collagenase and trypsin+thermal treatments, yielded small variations in QSM: in particular, the susceptibility of the superficial and transitional zones had more variation between different orientations than between the treatment groups. Based on the T2* relaxation time, the thermal treatment affected the collagen network throughout cartilage. The depth-wise behavior of T2* after thermal treatment differs from all other treatments, especially near the magic angle orientation of the sample. This is somewhat consistent with the PLM findings, which demonstrated cracks in the collagen network of the thermally treated sample. However, the T2* anisotropy was only slightly altered by the thermal treatment, further confirmed by PLM, which also indicated that cartilage retained similar anisotropy of the collagen fibers after the treatment (Figures 2 and 8).
Collagenase treatment yielded superficial changes consistent with the literature with drastically increased T2* relaxation times,29, 31 indicating breakdown of the superficial collagen network. Collagenase treatment induced variation in the susceptibility of the superficial zone while the other areas remained largely unaffected. Increase in the superficial susceptibility variation was not expected as tissue breakdown should result in a less organized structure and thus also in less variation in susceptibility between the orientations. PLM findings revealed that not all of the superficial cartilage was damaged in the collagenase treatment. This suggests that T2* and susceptibility changes in the superficial zone of the trypsin+collagenase-treated sample might have been partially caused by the trypsin degradation (Figures 8 and 9). However, there also is a possibility that collagenase had striped tiny layer out of the superficial cartilage causing altered behavior of T2* and susceptibility at the superficial layer of cartilage.
4.3 Limitations and Future Work
Because QSM is a relative measurement due to the background field removal step, the global susceptibility offset or reference level may have been different at different orientations and following different treatments, making the comparison of the different measurements nontrivial. This is a problem general to the whole field of susceptibility quantitation.55 However, it is clear that the susceptibility variation over the different orientations (i.e., the susceptibility anisotropy) remained similar for all treatments (Figures 8 and 9), suggesting that it did not arise purely from a lack of susceptibility referencing. Based on the findings of the study, investigating spontaneously degenerated cartilage would likely be more valuable than using the separate treatments as applied here.
Our findings show anisotropy of susceptibility in cartilage, as well as slight changes in cartilage susceptibility due to the treatments affecting the collagenous network and calcifications, suggesting that QSM may function as a biomarker for musculoskeletal applications. It may be impractical to use QSM to measure susceptibility anisotropy in vivo because re-orientations of the patient would be required. Furthermore, use of ultra-short echo time (UTE) methods with (fast) radial sampling and shorter echo times are likely required for in vivo musculoskeletal imaging. The use of UTE methods for susceptibility measurements may be important, as they would be expected to yield better images from the cartilage–bone interface where T2* is short (e.g., T2* < 1 ms). Further considerations include using total field inversion or similar methods capable of revealing the susceptibility in bony regions of low signal.56, 57 especially in combination with UTE imaging.
In conclusion, the findings of this study demonstrated anisotropy of susceptibility in cartilage and indicated the necessity of using background field removal methods that do not require significant erosion of the cartilage tissue mask. A background field removal method without significant erosion is needed to retrieve susceptibility information in this very thin tissue structure, and especially near the cartilage–bone interface where calcification changes are expected in osteoarthritis. Simulations showed very similar anisotropy when compared with observed anisotropy, which suggests that the observed anisotropy may have an artifactual origin besides the true anisotropy. This should be carefully taken into the account in future studies regarding QSM of articular cartilage. Changes due to different tissue degradation treatments were limited in both in T2* and susceptibility. The susceptibility was slightly increased due to decalcification by EDTA and superficial susceptibility variation was enhanced with the trypsin+thermal treatment. T2* was prolonged by all treatments that included trypsin degradation. Because the MGRE sequence is a broadly available sequence which, in addition to QSM, provides high-resolution anatomical 3D images and enables 3D T2* mapping, it is a very appealing choice for clinical quantitative MRI of cartilage.


