Identifying Ferroptosis-Related Genes Associated with Weight Loss Outcomes and Regulation of Adipocyte Microenvironment
Abstract
Scope
The study is about the influence of ferroptosis-related genes combined with the immune microenvironment exerted on weight control outcomes and systematic analysis.
Methods and results
Subcutaneous adipose tissue (sWAT) samples from 11 subjects with good outcome and 10 subjects with poor outcome in weight management are obtained from the Gene Expression Omnibus database. The results are validated in vivo in animal models with different weight loss outcomes. The CIBERSORT algorithm is used to evaluate the differences in immune cell infiltration in each sample. Patients with poor outcome have higher levels of ferroptosis in the adipose tissue. Remarkable differences in cytokine production, nuclear factor kappa-B(NF-κB) transcription factor activity, leukocyte migration involved in the inflammatory response, and other biological processes are also observed compared to that in the well-controlled group. Aldo-keto reductase family 1-member C1(AKR1C1), nuclear receptor coactivator 4(NCOA4), and glutamate-cysteine ligase catalytic subunit(GCLC) are identified as core predictive markers and their expression patterns are confirmed in animal models.
Conclusions
Ferroptosis and its mediated inflammation play an important role in long-term weight control, and analyses of the role of ferroptosis-related genes(FRGs) in weight control may provide new potential therapeutic targets for long-term weight control. Anti-inflammatory diets that mitigate inflammatory responses and affect ferroptosis may be considered in the future to improve weight control.
1 Introduction
Obesity, associated with high incidence of diabetes mellitus, hypertension, obesity cardiomyopathy, atherosclerosis, nonalcoholic fatty liver disease, cancer, and decreased life expectancy, has become a common global public health crisis.[1] The current consensus demonstrated that a positive energy balance when food intake exceeds energy expenditure for an extended period will result in fat accumulation, and eventually lead to obesity. At present, the principles of nonsurgical obesity management mainly consist of energy restriction and reduction in daily macronutrient intake.[2, 3] However, studies have shown that there are significant individual differences in the extent of weight loss even when the same strategy was applied. Weight loss failure is commonly seen among obese patients.[4, 5] Therefore, it is necessary to explore the underlying causes and potential mechanisms of weight loss failure in depth in order to identify possible predictors of weight management outcomes.
Most studies revealed that obesity is accompanied by chronic low-grade inflammation. In adipose tissue, aberrant fat accumulation induces inflammation whereas inflammation stress worsens lipid uptake.[6-8] Therefore, it is possible that dysfunctions in lipid metabolism could in turn affect the result of weight loss. It has also been suggested that ferroptosis, a cell death process that connects oxidative stress and inflammation, plays a part in body weight management.[9] Ferroptosis is an iron-dependent form of programmed cell death associated with dysregulation of lipid metabolism. It is characterized by iron-dependent intracellular accumulation of lipid peroxidation products.[10] Among them, the two most important key regulators of ferroptosis, glutathione peroxidase 4 (GPX4) and tumor protein 53(p53), play important roles. GPX4, as a central regulator of ferroptosis, protects cells from ferroptosis damage by neutralizing lipid peroxidation.[11] In contrast, p53 may play a bidirectional role in regulating lipid metabolism by regulating lipolysis and fatty acid oxidation, therefore participating in obesity and hepatic lipid accumulation. Meanwhile, p53 is able to regulate ferroptosis responses in a state of ferroptosis induction either by direct inhibition of GPX4 or indirectly through its substrate depletion.[12, 13] Ferroptosis is associated with many chronic diseases such as cardiovascular disease, digestive diseases, respiratory diseases, and various cancers.[14] Besides, it also participates in chronic consumption of high-fat diet (HFD) related glycolipid dysfunction, thus associated with various metabolic complications of obesity.[15-17] However, the mechanism of ferroptosis in obesity has not yet been specifically addressed, and more specific regulatory molecular roles require further exploration.[18]
Machine learning is a tool for effective analyses of digitized datasets thus can be applied to the exploration of clinical decision-making models. We acquired microarray datasets of obese individuals with different weight control outcomes using the Gene Expression Omnibus (GEO) database and screened the key ferroptosis-related genes (FRGs) associated with it. The degree of immune cell infiltration in adipose tissue was evaluated by the CIBERSORT algorithm. In the present study, we screened the predictive markers of weight loss outcomes using machine learning methods and identified potential therapeutic agents. Moreover, we extracted the epididymal white adipose tissue(eWAT)and sWAT samples from murine model with different weight-loss outcomes, and detected mRNA and protein levels of selected FRGs in the samples to verify the core predictive markers. Here, we reported the possible mechanism of how ferroptosis and macrophage infiltration interplays in the aggravation of metabolic inflammation and weight loss failure, providing a theoretical basis for clinical intervention strategies to achieve targeted and personalized therapeutic agents for obesity and long-term maintenance of reduced body weight.[19]
2 Experimental Section
2.1 Animal Experiments
The mouse studies were authorized by the Medical Ethics Committee of the Peking Union Medical College (XHDW-2019-010), and all animal experiments were performed in accordance with the National Institutes of Health Guide. Male C57BL/6 mice (7-week-old) were acclimatized in cages in a thermal chamber for 7 days. All mice were fed a high-fat diet (HFD, D12492 60 kcal% fat formula, Research Diets, New Brunswick, NJ, USA) for 12 weeks and then randomly divided into two groups. Mice in the good control (GO) group were fed a normal diet (ND, D12450J, 10 kcal% fat formula, Research Diets, New Brunswick, NJ, USA) (n = 5) and those in a poor control (PO) group were continuously fed an HFD (n = 5) for another 6 weeks. The mice were maintained at standard temperature (22 °C) under a 12-h light–dark cycle and had free access to food and water. The body weight and average feed consumption were recorded weekly. At the end of the experiment, animals were sacrificed by CO2 anesthesia. Serum samples were obtained and frozen at −80 °C until assayed. Adipose tissues (eWAT and sWAT) were rapidly dissected, weighed, frozen quickly in liquid nitrogen, and stored at −80 °C until further analysis.
2.2 Data Source
The GSE95624 dataset was downloaded from the GEO database (https://www.ncbi.nlm.nih.gov/geo/), including diet intervention after 11 well-controlled and 10 poorly controlled individual hypodermic and adipose tissue samples.[20] Batch correction was performed to the original data to remove batch effect for further analysis. Use “limma” package screening differentially expressed genes (DEGs), p < 0.05 and | log2 Fold Change | > 0.2 was the difference was statistically significant.[21] The FRGs were obtained from the hallmark gene sets in the Molecular Signature Database (https://www.gsea-msigdb.org/gsea/msigdb/), and a total of 65 genes were obtained for further analysis.
2.3 Weighted Gene Co-expression Network Analysis
The ferroptosis scores of all samples were calculated using the principal component analysis (PCA). The PCA analysis evaluated the degree of ferroptosis activity of a sample based on the expression level of ferroptosis-related genes in each sample and produced a quantifiable and comparable score. A score above the median was defined as a high ferroptosis score and vice versa. According to the ferroptosis score, the weighted co-expression network was analyzed using the R package “WGCNA.”[22] First, the study determined an appropriate soft threshold power to achieve a scale-free topology. The adjacency matrix consisted of weighted correlation coefficients and was transformed into a topological overlap matrix (TOM) and corresponding dissimilarity matrix (1−TOM). Hierarchical clustering was performed to identify the modules, and the system cluster map was further constructed to divide similar gene expression into different modules. Finally, the association among the ferroptosis score, two subgroups, and genes contained in each module was assessed using Pearson correlation analysis. The genes in the module with the highest correlation coefficients were considered to be the most associated with ferroptosis and body weight control.
2.4 Functional Enrichment Analysis of Core Gene Sets and Characterization of Ferroptosis-Associated Small Molecule Therapeutics
The key module genes obtained using weight gene co-expression network analysis(WGCNA) were analyzed for functional enrichment. Gene set enrichment analysis (GSEA) was performed on the gene expression matrix through the “clusterProfiler” package and “c2.cp.kegg.v7.0.symbols.gmt” were selected as the reference gene set. KEGG analysis was performed using the KEGG pathway database (https://www.genome.jp/kegg/pathway.html). The study used the “ggplot2,” “circlize” package to perform Gene Ontology enrichment analyses on DEGs. The Broad Institutes Connectivity Map (cMAP) database (https://portals.broadinstitute.org/cmap) was used to identify critical modules of gene-related small-molecule drugs.[23] To identify candidate drugs, gene sets with log2FC >0.585 were inputted into the cMAP database for enrichment analysis. The accuracy of the results was verified through a molecular docking analysis. The PubChem database (https://pubchem.ncbi.nml.gov) was used for detailed information extraction of small molecules and obtaining their 3D structures. Subsequently, molecular docking was performed to retrieve the crystal structure information of the predicted target protein (human source) from the PDB database (https://www.rcsb.org/). During docking analysis, the Prep Wiz module in the Schrödingerr software package was used to prepare the protein via hydrogenation, dewatering, and other pretreatment operations. In the process of small molecule docking, the Protein Preparation module in the Schrödinger software package was used to hydrogenate, add charge, add protonation state, and provided the OPLS-2005 force field. The Glide force field was selected as the optimal docking condition and the protein file was used as the receptor for docking research. Before docking, the protein receptor was required to prepare and define a pocket with a size of 10 Å × 10 Å × 10 Å. After all molecules and receptor proteins were ready, docking was carried out with the Glide algorithm under the docking accuracy of SP, and other parameters remained as default.
2.5 Screening of Diagnostic Markers Related to Ferroptosis and Analysis of Immune Microenvironment
The study used the least absolute shrinkage and selection operator (LASSO) logistic regression to screen for ferroptosis-related diagnostic markers between the well-controlled and poorly controlled groups. The LASSO algorithm was applied with the “glmnet” package.[24] The study determined the proportion of immune cells in each sample using “CIBERSORT” (https://cibersort.stanford.edu/). CIBERSORT predicts the proportion of 22 immune cell species in each tissue based on the relative expression levels of 547 signature genes in a single tissue sample. Specifically, the proportion of the 22 immune cells was calculated from the normalized adipose tissue gene expression data and converted to relative levels, with the final selection of immune cells with significant differences (p < 0.05) for subsequent analysis. The differences in immune cell infiltration between groups were visualized using the “ggplot2” package.[25] Subsequently, Spearman's correlation analysis was performed on selected ferroptosis-related diagnostic markers and immune cells.
2.6 Total RNA Isolation and RT-qPCR
Total RNA from adipose tissue was extracted using TRIzol (Servicebio, Wuhan, China). cDNA was synthesized using a ServicebioRT First Strand cDNA Synthesis Kit (Servicebio, Wuhan, China). RT-qPCR was performed using SYBR Green qPCR Master Mix (Servicebio, Wuhan, China). β-Actin was used as the internal reference gene. The real-time quantitative PCR primer sequences used in this study were listed in Table 1. Relative RNA expressions were measured using the 2−ΔΔCT method, where CT referred to the threshold cycle.
| Gene | Forward primer (5′-3′) | Reverse primer (5′-3′) |
|---|---|---|
| GCLC | CATCCTCCAGTTCCTGCACATC | CATCGCCTCCATTCAGTAACAAC |
| GCLM | TTCGCCTCCGATTGAAGATG | TGGTTACTATTGGGTTTTACCTGTG |
| NOCA4 | CAACCCACAGGACTGGCTTAT | TTTCTAAGCCCTTCAGATTGCC |
| FTH1 | GCCAAATACTTTCTCCACCAATC | TGAAGTCACATAAGTGGGGATCATT |
| AKR1C3 | TAGGCCAGGCCATTCTAAGC | CTCCATGGCCTTCAGAGACAC |
| CCL2 | CCAAGAAGGAATGGGTCCAGACAT | AGGCATCACAGTCCGAGTCACA |
| CXCL1 | ACCGAAGTCATAGCCACACTCAAG | AAGCCAGCGTTCACCAGACAG |
| TNF | TAACTTAGAAAGGGGATTATGGCT | TGGAAAGGTCTGAAGGTAGGAA |
| β-actin | GTGACGTTGACATCCGTAAAGA | GTAACAGTCCGCCTAGAAGCAC |
2.7 Western Blotting
Total protein was obtained from the mouse adipose tissue using RIPA buffer (Servicebio, Wuhan, China), and protein concentrations were quantified using the BCA Protein Assay Kit (Servicebio, Wuhan, China). The protein samples were boiled for 5 min, electrophoresed in a 10% SDS polyacrylamide gel, and then transferred to a PVDF membrane. The membranes were blocked with 5% milk (non-fat skimmed milk in TBST buffer) for 1 h, and incubated overnight with primary antibodies against FTH1 (1:1000, ET1610-78, HuaBio, Hangzhou, China), GCLC (1:2000, GB113956, Servicebio, Wuhan, China), and β-actin (1:2000, GB15001, Servicebio, Wuhan, China). The membranes were washed with TBST three times (5 min each) and incubated with the secondary antibodies at 37 °C for 30 min. ECL western blotting solution (Servicebio, Wuhan, China) was added to the membrane for 1 min. β-actin was used as an internal reference. The optical densities of the target bands were determined based on gel imaging and scanning using Alpha software.
2.8 ELISA
Under the instructions of the manufacturer, inflammatory cytokine concentration was determined by ELISA kits: Mouse TNF-α High Sensitivity ELISA Kit (EK282HS, MULTISCIENCE, Hangzhou, China), Mouse IL-6 ELISA Kit (EK206, MULTISCIENCE, Hangzhou, China), Mouse IL-1β ELISA Kit (EK201B, MULTISCIENCE, Hangzhou, China).
2.9 Immunohistochemistry
Adipose tissue was fixed overnight in 4% paraformaldehyde, embedded in paraffin, and cut into slices. The following primary antibodies were used according to standard protocols: anti-rabbit FACL4 (ab155282, 1:200, Abcam, Cambridge, UK), anti-rabbit Heme Oxygenase 1 (1:2000, ab52947, Abcam Cambridge, UK), anti-mouse NLRP3 (1:200, 68102-1-Ig, Proteintech, Wuhan, China), and anti-rabbit TLR4(1:100, ab22048, Abcam, Cambridge, UK). For staining, the HRP kit and tissue immunohistochemical staining kit (K5007, Glostrup, DAKO) were used according to manufacturer's instructions. The sections were counterstained with hematoxylin, hydrated, and mounted. Images were acquired using the microscope (ECLIPSE CI, Nikon, Tokyo, Japan).
2.10 Immunofluorescence Staining
The sections were then incubated overnight at 4 °C with primary antibodies: anti-rabbit iNOS (1:20, ab3523, Abcam, Cambridge, UK), F4/80 Monoclonal Antibody (1:100, CI:A3-1, Invitrogen, Carlsbad, CA, USA). Then, the slides were incubated with the appropriate secondary antibody for 50 min at room temperature. DAPI was applied to counterstain cell nucleus for 20 min. Fluorescence were detected by using confocal fluorescent microscope (Nikon, Tokyo, Japan).
2.11 Statistical Analyses
The statistical analysis was performed using SPSS 20.0 (IBM, Armonk, NY, USA). The results were shown as the mean ± SEM. Comparisons between the two groups were evaluated using independent-sample t-tests. The statistical significance was set at p < 0.05.
3 Results
3.1 Adipose Tissue of Patients with Poor Body Weight Control Had Higher Ferroptosis Levels
The dataset included the subcutaneous abdominal adipose tissue transcriptome of 21 obese individuals who lost or regained weight during dietary intervention. These individuals were placed on a low-calorie diet (800–1000 kcal d−1) for 8 weeks and then on an ad libitum diet for 6 months. Intervention outcome was determined by weight change at the end of the intervention. The individuals who did not regain weight during follow-up being the well-controlled group (n = 11) and those who regained back to baseline weight during follow-up being the poor controller (n = 10). After the global gene expression of each individual normalization, gene expression is measured on a continuous scale and further analysis (Figure 1A, see Supplemental material S1 before normalization).
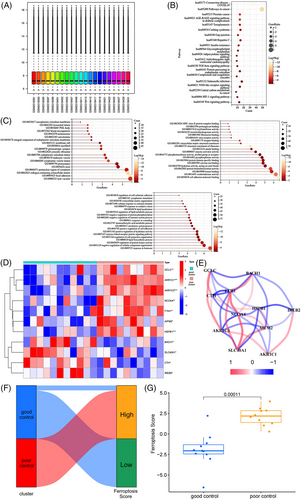
This dataset was screened for 330 DEGs. And we identified phosphoGlycerol dehydrogenase(PHFDH),[26] C-C motif chemokine receptor 10(CCR10),[27] transmembrane protein 92(TMEM92),[28] aldolase,fructose-bisphosphate C Gene(ALDOC),[29] and X-inactive specific transcipt(XIST)[30] as being significantly upregulated in the PO group, all of which are associated with promoting ferroptosis (Supplemental material S2). DEGs-based KEGG enrichment analyses showed the enrichment of 20 pathways. The KEGG enrichment indicated that metabolism and inflammation pathways were predominant and included AGE-RAGE signaling pathway in diabetic complication (hsa04933), insulin resistance (hsa04931), glycerophospholipid metabolism (hsa00564), adipocytokine signaling pathway (hsa04920), TGF-beta signaling pathway (hsa04350), NOD-like receptor signaling pathway (hsa04621), HIF-1 signaling pathway (hsa04066), and Wnt signaling pathway(hsa04310) (Figure 1B). Gene ontology analyses based on DEGs showed that 60 gene functions were enriched and associated with ferroptosis, including integral component of endoplasmic reticulum membrane (go0030176), endoplasmic reticulum lumen (go005788), kinase binding (go005788), response to oxidative stress (go0019900), oxidoreductase activity (go16491), lipid localization (go0010876), regulation of lipid metabolic process (go0019216), and regulation of protein kinase activity (go0045859). (Figure 1C).
Since ferroptosis is characterized by the accumulation of ferric iron while promoting lipid peroxidation, the above DEGs-based results found that these terms and modules of oxidative, lipid metabolism, are associated with ferroptosis are closely related. To further understand the role of ferroptosis in weight control, we next performed further analysis including expression of ferroptosis-related genes, interaction relationships, and ferroptosis scores in two groups of weight-loss patients with different weight control outcomes. Eleven differentially expressed FRGs were identified in the adipose tissue samples from patients with good and poor outcomes, among which GCLC, AKR1C1, aldo-keto reductase family 1 member C3 (AKR1C3), NCOA4, ferritin heavy chain 1 (FTH1), apoptosis-inducing factor mitochondria associated 2 (AIFM2), and heat shock protein family B (Small) member 1 (HSPB1) were significantly upregulated in the poorly controlled group (p < 0.05). And BTB domain and CNC homolog 1 (BACH1), solute carrier family 40 member 1 (SLC40A1), cystathionine gamma-lyase (CTH), and iron-responsive element binding protein 2 (IREB2) were significantly upregulated in the well-controlled group (p < 0.05, Figure 1D). Correlation analyses of the expressions of the 11 genes showed that FTH1, NCOA4, and HSPB1 have more correlations with other FRGs and a high number of correlations, considered to play a core role in the correlation network, suggesting that these genes may be crucial in regulating ferroptosis in fat metabolism (Figure 1E). Individuals' ferroptosis scores were assessed by PCA based on the expression of FRGs.[31] This scoring system takes full account of individual patient heterogeneity and uses a method similar to the Genomic Grade Index to define ferroptosis scores, thus allowing for a valid assessment of patient ferroptosis patterns and levels.[32] Patients are assigned to subgroups with high and low ferroptosis scores based on the median of the scores for all individuals. Most adipose tissue samples from well-controlled patients had low ferroptosis scores, while the opposite results were observed for the poorly controlled patients (Figure 1F). The ferroptosis score of adipose tissue from poorly controlled patients was substantially higher than that from the well-controlled patients (Figure 1G), suggesting that the adipose tissue of poorly controlled patients had a higher degree of ferroptosis.
3.2 Ferroptosis Is Associated with Inflammation during Weight Control
The consideration is that ferroptosis can also link metabolic inflammation, and oxidative stress that acts together in the development of weight rebound, but the genes associated with these biological processes were conventionally categorized outside the class of ferroptosis-associated genes.[33] To get a comprehensive understanding of the role of ferroptosis and related processes in weight regaining, we performed WGCNA based on the ferroptosis score, yielding a collection of genes with a common expression pattern including ferroptosis itself. Further, when assessing the correlation values and p-values of each gene set with both phenotypes (group, ferroptosis score), two modules, MEantiquewhite2 module, and MEindianred4, presented the best result and therefore selected and analyzed in the present study. A scale-free network was constructed by combining the ferroptosis score and group information of the samples, and the soft threshold was set at 6 (Figure 2A,B). The WGCNA had a consensus of 27 modules, each with a unique color (Figure 2C). By analyzing the correlations between gene expression levels of each module, grouping (both GO and PO) and Ferroptosis Score, the MEantiquewhite2, and MEindianred4 modules containing a total of 1593 genes were found to have substantial inter-group differences and strong correlations (Figure 2C).
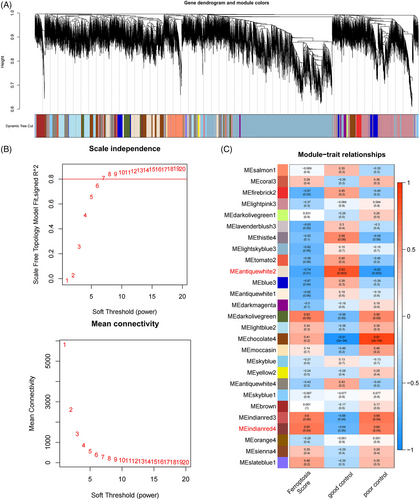
To find out which transcription factors regulate a set of genes with similar expression patterns and the differences in transcription factor regulatory networks between the two modules—MEantiquewhite2 module and MEindianred4, we processed the transcription factor regulatory network analyses of these two modules. The relationship between these transcription factors and weight control was partially established. For example, the cg14129040 (CREB1) polymorphism that influences circadian rhythms, is associated with metabolic disorders/carbohydrate intake, and may influence weight homeostasis.
Then, Gene Ontology and GSEA enrichment analyses were performed for genes differentially expressed in the MEantiquewhite2 and MEindianred4 modules between the well- and poorly- controlled groups. Cytokine production, NF-κB transcription factor activity, and leukocyte migration involved in the inflammatory response; interleukin-12 production; MAP kinase activity; cellular response to insulin stimulus; mitochondrial inner membrane; and other biological processes and molecular functions occupied the core position (Figure 3A). GSEA analysis showed that differences existed in the regulation of the actin cytoskeleton, ECM receptor interaction, dilated cardiomyopathy, focal adhesion, and antigen processing and presentation (Figure 3B).
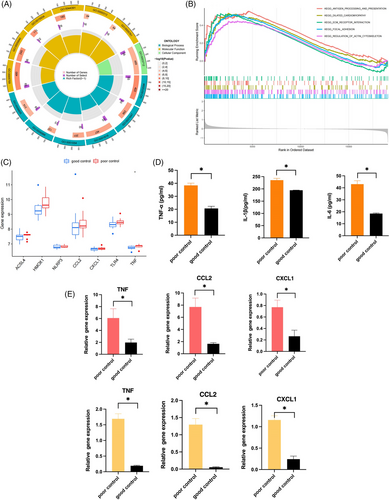
Excessive chronic inflammation of the adipose tissue is likely linked to occur in patients with poor weight control.[34] To explore the association between ferroptosis and adipose tissue inflammation, inflammatory signaling molecules reported in poor weight control were compared between the groups. The expression levels of inflammatory mediators or receptors such as acyl-CoA synthease long-chain family member 4 (ACSL4), heme oxygenase 1 (HMOX1), NOD-like reveptor thermal protein domain associated protien 3 (NLRP3), C-C motif ligand 2 (CCL2), C-X-C motif chemokine ligand 1 (CXCL1), Toll-like receptor 4 (TLR4), and expression of tumor necrosis factor (TNF) were dramatically upregulated in the adipose tissues of patients with poor weight control compared to those with good weight control (Figure 3C). Meanwhile, we verified these results in the mouse models. The levels of inflammatory factors in mice serum were also detected by ELISA. Compared with the GO group, TNF-α, interleukin-6 (IL-6), and interleukin-1 beta (IL-1β) levels in mice serum were significantly increased in the PO group (p < 0.05, Figure 3D). In addition, we also examined the RNA expression levels of inflammatory factors and cytokines in the sWAT and eWAT of mice. The mRNA expression of inflammation- and ferroptosis-related genes, CCL2, CXCL1, and TNF, were also significantly higher in the PO group compared with the GO group (p < 0.05, Figure 3E). Immunohistochemical staining was performed to examine the protein expression of ACLS4, HMOX1, NLRP3, and TLR4 in two kinds of adipose tissue in different groups. Moreover, the PO group had much pronounced protein expression levels of the classical inflammatory pathway receptor proteins NLRP3 and TLR4 (Figure 4A). These results demonstrated that the PO group presented a significant inflammatory state from systemic and local adipose tissue. Importantly, the PO group had more noticeable protein expression of ACLS4 and HMOX1, than the GO group (Figure 4A) and these two proteins play an important role in ferroptosis. It suggested that ferroptosis was more obvious in the PO group of sWAT and eWAT. The above results are consistent with our dataset-based analysis, which indicated that high levels of ferroptosis are associated with systemic and local inflammation.
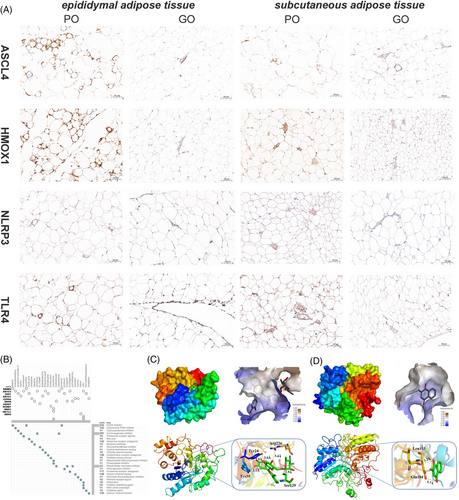
To further explore the potential therapeutic drugs for controlling body weight gain based on FGRGs, the differentially expressed genes were put into the cMAP database, and 29 related small molecule drugs were screened. These small-molecule interventions are mainly EGFR inhibitors, cyclooxygenase inhibitor antioxidants, atherogenesis inhibitor, mitochondrial DNA polymerase inhibitor, and bile acid, which were strongly correlated with AKR1C3, AKR1C1, NAD(P)H Quinone Dehydrogenase 1 (NQO1), solute carrier family 29 member 4 (SLC29A4), and other targets (Figure 4B). To confirm their binding abilities, the previously studied drugs rutin, AKR1C3, menadione, and NQO1 were selected for molecular docking. The results showed that the docking score between them was lower than −5, indicating a strong possibility of binding. Rutin formed five hydrogen bonds with amino acids Tyr24, Tyr55, Ser129, and Arg226 at the interaction distance of 3.0, 2.9, 3.1, 2.9, and 3.4 Å, and their docking score is −7.595. Menadione formed two hydrogen bonds with amino acids Leu103 and Gln104, and the interaction distance was 3.2 and 3.7 Å, respectively, and their docking score was −7.118 (Figure 4C,D).
3.3 AKR1C1, GCLC, and NCOA4 Are Key Ferroptosis-Related Diagnostic Markers for Weight Control Outcomes
FRGs were screened according to the DEGs in the above core modules, and AKR1C1, GCLC, and NCOA4 genes were identified as ferroptosis-related predictive markers for weight control outcomes using the LASSO regression algorithm (Figure 5A). In animal models with different outcomes, the PO group showed a consistent trend of weight gain, whereas the GO group showed a fluctuating trend of weight loss. The amount of eWAT and sWAT in two groups were also consistent with body weight, and the weight of both types of fat in the PO group was higher than that in the GO group (p < 0.05, Figure 5B).
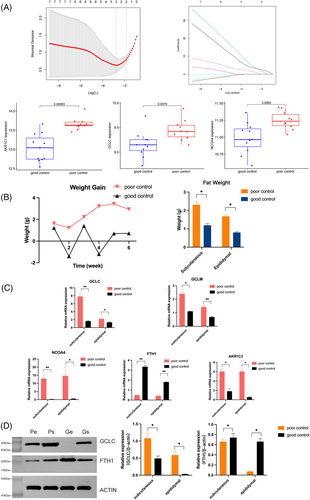
The mRNA levels of the identified predicted markers and related genes were detected in both adipose tissues, and the expression levels in both adipose tissues were consistent with the predicted results. Compared with the GO, the expression levels of GCLC, GCLM, AKR1C3, and NCOA4 were significantly increased, whereas the expression levels of FTH1 were significantly decreased in the PO group (p < 0.05, Figure 5C). As for protein expression levels, compared with the GO group, GCLC expression levels in both adipose tissues were significantly increased, and FTH1 expression levels were significantly decreased in the PO group (p < 0.05, Figure 5D).
3.4 Differences in the Immune Microenvironment of Adipose Tissues between GO and PO Patients and its Correlation with Predictive Markers
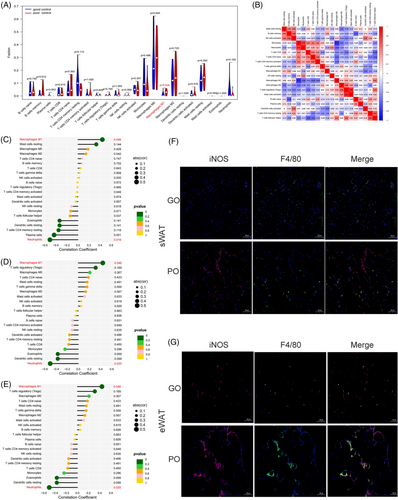
To assess the immune landscape of both populations, we quantified the level of immune cell infiltration in adipose tissue between GO and PO patients. The CIBERSORT study was used to compare differences in immune cell infiltration under different FRG expression patterns. M1 macrophages were the only immune cells that showed differences between the two groups, and the infiltration levels of the poorly controlled group was higher than that of the GO group, indicating that there was immune heterogeneity in adipose tissue under the influence of ferroptosis (Figure 6A). At the same time, a strong correlation between immune cells was observed, in which neutrophils were positively correlated with monocytes, activated mast cells, and regulatory T cells. The number of monocytes was inversely correlated with M2 macrophages (Figure 6B). In addition, three predictive markers (AKR1C1, GCLC, and NCOA4) were significantly correlated with M1 macrophages and neutrophils (Figure 6C–E). Confocal microscopy was used to examine the protein expression of F40/8 and INOS in adipose tissue of different groups. To assess the change of immune microenvironment, the subcutaneous and epididymal adipose sections were immunostained for F4/80 and INOS. F4/80 is a direct marker of the macrophage infiltration and INOS is a marker of high expression of M1-type macrophages after polarization. Increased double-positive F4/80 and INOS structures were observed in PO group whereas only a small quantity of double-positive structures was found in the GO group (Figure 6F,G). According to the findings, the immune microenvironment of adipose tissues of GO and PO mice groups were distinct from each other, and the PO group showed more proportion of M1 macrophages infiltrating than that the GO group.
4 Discussion
Although calorie restriction has been proven effective for weight loss,[35] weight readily rebounds once it returns to a normal diet, and long-term weight control is variable between individuals.[20, 36] Weight rebound is a significant risk factor for the development of metabolic syndrome and incident cardiometabolic disease.[37] In addition, studies have found a close association between ferroptosis and obesity-related diseases. Ferroptosis is an important myocyte death mechanism in myocardial infarction, and myocardial ischemia is one of the most common complications of obesity.[38] And some ferroptosis’ markers are associated with the persistence of fat deposition and inflammation in the features of weight regain. Following proteomic analysis, liver tissue from rats with western diet-induced steatohepatitis showed significant fat deposition, inflammation, and upregulation of FTH1 protein levels in the liver.[39] Similar results were found in obese mice fed a high-fat diet, signal transducer and activator of transcription 3 (STAT3)/NCOA4/FTH1 axis-mediated ferroptosis was found to be one of the possible mechanisms of high-fat diet-induced cardiac injury.[40] In a model of cerebral ischemic inflammation, HSPB1 expression was also found to be upregulated and associated with positive regulation of inflammation.[41]
Therefore, based on the analysis of the potential functions of the DEGs in the module, we hypothesized that ferroptosis plays an important role in long-term weight control and that FRGs can be used to predict the outcome of weight control. This hypothesis was tested in our dataset's analysis and animal experiment.
Ferroptosis is a pro-inflammatory cell death program, which promotes the secretion of inflammatory factors. The accumulation of iron during ferroptosis may be correlated with the abundance of iron storage in macrophages, especially M1-type macrophages. HFD-induced obesity is characterized by persistent low-grade inflammation in the adipose tissue, in which macrophage infiltration plays a critical role.[38] This indicates that macrophages are involved in iron and lipid metabolism, thereby inducing ferroptosis.
We identified some changes in inflammation-related gene expressions in subjects with different weight loss outcomes. Although only the expression of TNF was remarkable, the expression levels of other inflammation-related genes in the poor-controlled group were higher than those in the good-controlled group. It is an important isozyme for polyunsaturated fatty acid metabolism, the expression of which promotes pro-inflammatory cytokine (such as TNF-α, IL-6, IL-1β) production in microglia, and the trends in TNF levels in the present study were consistent with findings reported in previous studies.[42] In order to validate the results achieved with bioinformatics analysis, we examined the mRNA expression levels of TNF in subcutaneous and visceral adipose tissue in a mouse model. Then it was found that a significant increase in the expression in the PO group. Meanwhile, the levels of pro-inflammatory cytokines TNF-α, IL-6, and IL-1β were also found to be significantly higher in the serum of the PO mice. In this study, elevated NLRP3 expression was associated with poorer weight control outcomes. Some studies suggested that the ferroptosis-induced inflammatory response is accompanied by the NLRP3 inflammasome activation.[43] As the classical inflammation activation pathway, NLRP3 inflammasome activation is also regulated through cytokines in macrophages that are related to intracellular lysyl oxidase (LOX) activity.[44-46] Moreover, ACSL4 is a ferroptosis sensitivity regulator that's also associated with poor weight control in our results. The expression of CCL2 also showed the same trend. In our animal experiments, it was found that the protein expression of NLRP3 and ACSL4 in adipose tissue was significantly increased in the PO group. This suggested a significant association of poor weight control with these several ferroptosis-related inflammatory genes. The mRNA of chemokines CCL2 as well as CXCL1 were also detected to be expressed at higher levels in these adipose tissues.
Previous studies suggested that ferroptosis cells have been found to be extremely pro-inflammatory by recruiting M1-type macrophages through CCL2.[47]
Based on the above results, we inferred that the ferroptosis-related inflammatory macrophage infiltration is closely associated with long-term weight control. To verify this hypothesis, we applied the newly developed CIBERSORT algorithm to quantify the composition of immune cells. In this study, we found an increase in the M1-type phenotype in the poor weight control group compared with the GO group, thus led to an M1-prodominent phenotype shifting and linked to inflammatory states in the adipose tissue of people with poor weight control. Our results demonstrate that ferroptosis is linked to inflammation caused by macrophages and that both are strongly associated with weight loss outcomes. Previous studies conducted in subjects gone through weight management found that the inflammatory response in adipose tissue was alleviated as demonstrated by the reduced infiltration of M1 macrophages during weight loss.[6, 48, 49] In addition, we confirmed by confocal microscopy that elevated expression of M1 markers was found in both visceral and sWAT in mice with poor weight control, thus pointing macrophages infiltrating adipose to M1 macrophages. Inconsistently, there are studies pointed out that weight loss increases M1-type macrophages infiltration and results in a more obvious inflammation state.[50, 51] This may be related to the difference in observation time—short-term weight loss intervention can lead to rapid changes in internal environment, result in transient aggravation of inflammatory state.
These results suggest that ferroptosis and associated immune infiltration are the cause of poor weight control. Therefore, it is important to identify the progression of ferroptosis in a timely manner, that is, to identify predictive markers. In this study, we used machine learning LASSO regression based on the differences in molecular expression and mechanisms found in different weight loss outcomes, verified the FRGs that were related to the underlying mechanisms of weight control outcomes, and identified three predictive biomarkers including AKR1C1, GCLC, and NCOA4 that may be involved in weight control and subsequently influence the outcome of weight loss. Our correlation analyses between these biomarker expressions and immune cell infiltration in adipose tissue showed that the expressions of AKR1C1, GCLC, and NCOA4 are linked with M1-type macrophage and neutrophil infiltration.
These biomarkers play important roles in ferroptosis, and previous studies have demonstrated an association between these ferroptosis-related genes and metabolic diseases. Although AKR1C1 is a key ferroptosis gene, its prognostic function has only been reported in cancer (such as lung, breast, and colorectal cancer). In the present study, we firstly demonstrated the possible connection between AKR1C1 and obesity. In addition, AKR1C3 often acts in conjunction with AKR1C1 and has been considered a promising diagnostic biomarker for acute myocardial infarction and therapeutic target for endocrine diseases.[52-55] High glucose levels induce ferroptosis in mesangial cells and affect the expression of downstream target genes, including GCLC and GCLM.[56] Changes in GCLC and GCLM expression are vital to induce ferroptosis, which is a valid indicator of redox imbalance and dysfunction in iron uptake and storage.[57] In addition, ferritin-associated autophagy can be mediated by NCOA4 via the Autophagy related (ATG)5-ATG7-NCOA4 pathway to increase the level of unstable iron in cells, thereby promoting ferroptosis.[58] Therefore, we established an animal model of weight control, and markers or associated binding proteins were detected in adipose tissue. The expression differences of AKR1C3, GCLC, GCLM, FTH1, and NCOA4 were verified in mice with different weight control outcomes, proving the rationality of the predicted results based on GEO datasets.
We also identified small molecules that might target FRGs, including menadione and rutin, which influence weight loss outcomes. Rutin is a natural flavonoid compound that has beneficial effects on diabetes and obesity and exhibits biological activities including anti-inflammatory, antioxidant, and anti-adipogenic effects.[59, 60] In the present study, we found that rutin is associated with the ferroptosis marker AKR1C3 for the first time. Previous studies have found that rutin increases energy expenditure by directly binding to and stabilizing sirtuin 1 (SIRT1) to activate brown adipose tissue (BAT).[61] Rutin also increased the expression of uncoupling protein 1 (Ucp1) and other thermogenic genes and proteins in BAT and inguinal white adipose tissue (iWAT), which activates BAT and induces iWAT browning. Then it also significantly reduces WAT adipocyte size.[62] Therefore, some studies suggest appropriate rutin supplementation, which facilitates the protection of the intestinal barrier, thereby reducing systemic inflammation and achieving effective weight control.[63, 64] Our results also showed that menadione could bind to NQO1 and affect the function of NQO1, potentially act through blocking NQO1/GPX4 to mediate ferroptosis.[65] Similar studies have found that NQO1 and Menadione affect each other's activity and effects.[66, 67] In studies related to weight control and metabolic changes, menadione also showed inhibition of adipogenesis, and this intervention resulted in a decrease in intracellular lipid accumulation and the adipogenic markers, such as peroxisome proliferator-activated receptor (PPAR) γ, fatty acid synthase (FAS), enhancer binding protein(CCAAT)/enhancer-binding protein (C/EBP) α, fatty acid binding protein (FABP) 4, and perilipin.[68] On the other hand, menadione inhibited fatty acid synthesis by increasing the inhibitory phosphorylation of acetyl coenzyme A carboxylase (ACC).[69] All of this evidence reflects the potential of menadione's action in controlling weight regain. The small molecules identified in this study could be used as a therapeutic drug in combination with weight-loss diet interventions to facilitate a promising strategy in precision medicine for weight management.
These findings have direct implications, regulation of ferroptosis may be the new prediction and therapeutic target for obesity and long-term weight control.[70, 71] Future studies should consider obesity treatment strategies that regulate ferroptosis and low-grade inflammation in adipose tissues in order to develop pharmacological and nutritional interventions. Further, ferroptosis target-based therapy to reduce macrophage infiltration in adipose tissue, promote macrophage polarization to M2, and reduce adipose tissue inflammation, thereby reducing obesity and improving insulin sensitivity, is also an important therapeutic direction for obesity-associated diabetes.[72, 73] However, our study had some unavoidable limitations. Firstly, the number of samples in the dataset was relatively small, which resulted in a failure to categorize the subjects properly by the outcomes of weight management, and the credibility of the present study may be influenced considering these two groups may need different strategies in weight management. Moreover, a relatively small sample size may be associated with absence of statistical significance. Secondly, we retrieved data only from one dataset (the GEO dataset), which lacks complete clinical information, and it was difficult to further analyze the clinical characteristics of these populations in combination with FRGs. A more detailed classification and analysis may be more instructive for weight loss treatment.
5 Concluding Remarks
In summary, the current study showed that ferroptosis was negatively associated with weight loss outcomes, suggesting that patients with elevated ferroptosis were less likely to achieve long-term weight control. We also provide novel evidence that ferroptosis may contribute to weight gain through metaflammation, which affects the M1-type macrophage polarization. In addition, we identified that three ferroptosis-related genes can be used as biomarkers to predict possible weight loss outcomes, which provides evidence for the development of targeted interventions for obesity. Consequently, ferroptosis is a novel target, and modulating its function may help achieve long-term weight control. Anti-inflammatory diets that mitigate inflammatory responses and affect ferroptosis may be considered in the future to improve weight control.
Acknowledgements
The research is supported by the National High-Level Hospital Clinical Research Funding(2022-PUMCH-B-054), the Whole People Nutrition Research Fund(CNS-NNSRG2022-227) and Innovation fund for postgraduate students of Peking Union Medical College (2019-1002-26). The funding statement was updated and the last sentence of section 2.3 was deleted on September 22, 2023.
Conflict of Interest
The authors declare no conflict of interest.
Author Contributions
W.L. and H.X. contributed equally to this work. W.L. and F.Y. designed the study and carried out the data analyses. H.X., S.M., Y.L., and X.S. interpreted the results. W.L., H.X., and W.C. draft the manuscript, H.X., F.Y., W.C. revised the manuscript. All authors read and approved the final manuscript.
Open Research
Data Availability Statement
The data that support the findings of this study are available from the corresponding author upon reasonable request.


