Experimental analysis of influence factors on pavement concrete performance: Different content of stone powder in manufactured sand
Abstract
At present, due to the unclear understanding of the mixed proportion of stone powder in the manufactured sand, the quality of finished concrete is affected. In this study, the concrete was mixed with manufactured sand containing 0%, 5%, 10%, and 15% stone powder and poured into standard models. The compressive strength of the concrete was obtained by measuring the pressure; the dry shrinkage rate of the concrete was obtained by measuring the volume; the impermeability was evaluated by the seepage height method. The results demonstrated that the increase of stone powder content resulted in the enhancement of concrete compressive strength and impermeability, but blindly adding stone powder led to the deterioration of concrete anti-shrinkage performance. Finally, the comparison of the overall experimental data showed that 10% of stone powder could make all aspects of the performance of the concrete optimal.
1 INTRODUCTION
With the continuous expansion of road infrastructure scale, the supply of concrete has been in short supply, but the traditional river sand resources nearly run out. Due to the requirements of environmental protection, the replacement of natural sand with machine-made sand has gradually become the future of the building materials industry. However, to compete with natural sand, artificial sand must be added with a special blending agent.1 Stone powder has been officially used as an important additive for machine-made sand due to its easy availability, low price, and excellent performance. Stone powder with small particle size and high density can penetrate the voids of concrete to optimize its overall structure. However, there are still some problems, such as the unclear concrete mix proportion and the excessive and insufficient amount of stone powder. These problems can affect the quality of pavement made of concrete and cause abnormities such as cracking and bending, resulting in a jerry-built project. Therefore, the research on the content of stone powder has become a key problem to be solved. Adding the content of stone powder scientifically to optimize the performance of concrete and realize high efficiency is the top priority of concrete manufacturing in China.2 For this problem, many experts have carried out relevant research. Mahzuz et al.3 used stone powder instead of ordinary sand and studied the relative performance of the concrete. The experimental results showed that the strength of concrete made of stone powder and stone chips was about 15% higher than that of concrete made of ordinary sand and brick chips. Li and Zhu4 set the stone powder content at 3% to 16% in the prototype machine-made sand and measured the dry shrinkage strain of concrete specimens. The test results demonstrated that there was an optimum content, and the prediction formula of concrete dry shrinkage strain was deduced. Xu5 prepared the mechanical sand concrete and found that the change of the proportion of stone powder and inferior fly ash had little effect on the compressive strength. Jiang et al.6 studied the effect of phosphorus slag powder on the workability of C30 and C60 concrete with the manufactured sand. The results showed that phosphorus slag powder had water-reducing property and improved the workability of concrete specimens.
In this study, the performance of concrete with different content of stone powder was analyzed. The compressive strength, drying shrinkage, and water permeability of the concrete was measured to obtain the multi-aspect performance of different content of stone powder in the manufactured sand in concrete. This study aims to help the adjustment of the proportion of stone powder in practical application.
2 CHARACTERISTICS OF CONCRETE
2.1 Compressive strength
 ()
() ()
()2.2 Drying shrinkage
 ()
()2.3 Water permeability
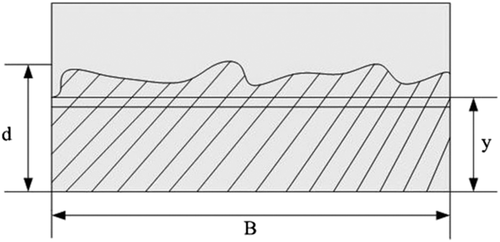
One of the important conditions to ensure the stability of pavement concrete structure is the water permeability of its base or cushion structure. When the water contacts the concrete surface, the capillary pressure will cause the movement of water. Only when the base coacervation structure forms strong mutually supportive constraints between particles can avoid structural instability. The size and shape of the gravel particles in the base structure are very irregular. When subjected to the load from the surface layer, part of the particles will break under the high-stress concentration and cause local instability. In this study, the permeability of the specimen is determined by measuring the penetrated height. Under the action of the external water pressure for some time, the concrete specimen is split along the middle diameter direction, and 10 points with the same distance are drawn along the diameter of the specimen, and the height of water penetrating the concrete at each equal diversion point is measured, accurate to 0.1 mm. The penetrated height method is simple and accurate, which meets the requirements of this experiment. The principle of the penetrated height method is shown in Figure 1.

 represents the average penetration height of concrete specimen, y represents the rising height of water surface, t0 represents the constant pressure time, that is, penetration time, h represents the water head height, that is, water pressure, and v represents the rising speed of water surface. It is assumed that the hydraulic gradient at the point is
 ()
() ()
()3 CONCRETE MIX RATIO
Portland cement (Ulanqab Hengli Cement Co., Ltd., China) was selected (Table 1). The standard water addition ratio was 30%. The dosage was 300 g. The coarse aggregate was continuous graded crushed stone (5–18 mm) at the dosage of 1050 kg/m3 and grade I fly ash with 5.5% fineness at the dosage of 58 kg/m3. In the experimental group, the manufactured sand containing 5%, 10%, 15%, and 20% stone powder with the particle size smaller than 75 μm was used, with a crushing value of 10% and a dosage of 30 g each. The control group used the dried natural river sand (Lingshou County Chenyang Mineral products Co., Ltd., China).
| Physical properties of cement for experiment | ||||||||
|---|---|---|---|---|---|---|---|---|
| Cement | Setting time (min) | Bending strength (MPa) | Compressive strength (MPa) | Water requirement of normal consistency | ||||
| Loose-packed Portland Cement 425 | Initial set | Final set | Qualified | 3 days | 28 days | 3 days | 28 days | 27% |
| 170 | 230 | 6.4 | 9.9 | 28.6 | 58.3 | |||
Concrete samples were prepared using the above experimental materials. The stone powder was obtained by manually screening the manufactured sand. The water-reducing agent was produced by Inner Mongolia Hongxin Chemical Co., Ltd., China. The mix proportions of five groups of test specimens obtained are shown in Table 2.
| Number | Content of stone powder | Sand rate | Water-reducing agent | Water | Crushed stone | Cement | Water cement ratio |
|---|---|---|---|---|---|---|---|
| 1 | Pure river sand | 43 | 1.1 | 195 | 1050 | 300 | 0.5 |
| 2 | 5% | 43 | 1.1 | 195 | 1050 | 300 | 0.5 |
| 3 | 10% | 43 | 1.1 | 195 | 1050 | 300 | 0.5 |
| 4 | 15% | 43 | 1.1 | 195 | 1050 | 300 | 0.5 |
| 5 | 20% | 43 | 1.1 | 195 | 1050 | 300 | 0.5 |
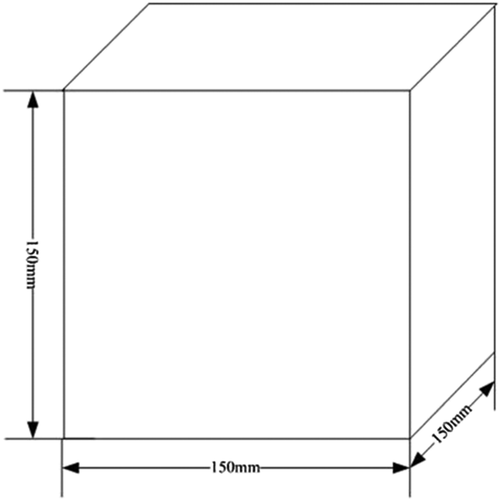
The concrete specimens were made according to the set mix proportion. After 30 s of operation after the second water addition in the mixer, pure river sand or basic materials such as machine-made sand, cement, and fly ash were added according to the preset stone powder content and stirred for 5 min. When obvious impurities were no longer visible on the surface of the mixture, the mixture was poured into the mold. After curing for 24 h, the mold was removed, and the specimens were numbered. The concrete cube model with a size of 150 mm × 150 mm × 150 mm was obtained, as shown in Figure 2. The porosity of the concrete specimens was 40%. Twenty samples were made for each number of concrete, and they were divided into four groups, corresponding to experimental groups maintained for 1, 7, 14, and 28 days, respectively.

4 EXPERIMENTAL ANALYSIS
4.1 Experimental methods
Compressive strength test: the electro-hydraulic servo pressure testing machine was set as 5000 kN. The lateral side of the test specimen was selected as the pressure bearing surface and put into the center of the lower platen, ensure that the center of the test specimen, the center of the lower platen, and the center of the upper platen were in the same line. Finally, the testing machine was turned on. During the test, constant velocity stress control was carried out, and the loading rate was 0.5–0.8 MPa/s. When the test specimen had large compression deformation, the oil delivery valve was not rotated until cracks appeared, and the failure load was recorded at the moment.
Shrinkage experiment: in this experiment, the length change of the specimen was measured by the screw micrometer, and the shrinkage deformation at different ages was measured by the contact shrinkage tester. After curing for 1 day, the specimens were immediately put into the constant temperature chamber to measure the reference length. After that, the length of the test specimen was measured every other week, three times in each group, and the average value was determined as the final data, accurate to 0.1 mm. The dry shrinkage age was 1, 7, 14, and 28 days, respectively, and the stone powder content was 0%, 5%, 10%, 15%, and 20%, respectively. The experiment was carried out by controlling the temperature in the constant temperature drying shrinkage chamber at 18°C to 22°C and the humidity at 55% to 65%.
Water permeability test: under the action of 30 MPa external water pressure for 1 h, the concrete specimen was split by the automatic concrete press machine to make cracks artificially. The splitting loading speed was set as 0.5 kN/s. The concrete specimen was split along the central line, and 10 points with the same distance were drawn along the line as the crack test points. The height of water penetrating the concrete at each point was measured, and the average value was calculated. The pressure time was set as 5 min, and the effluent time was set as 30 s.
4.2 Experimental results
4.2.1 Compressive strength results
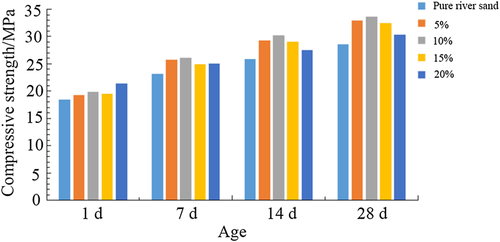
The compressive strength of the test specimens was checked 10 times every other week from the first day, and the average value was taken. The results are shown in Table 3 and Figure 1.
| Pure river sand | 5% | 10% | 15% | 20% | ||
|---|---|---|---|---|---|---|
| 1 day | Average pressure (MPa) | 18.4 | 19.3 | 19.8 | 19.5 | 21.4 |
| Standard deviation (MPa) | 0.011 | 0.011 | 0.012 | 0.010 | 0.011 | |
| 7 days | Average pressure (MPa) | 23.1 | 25.8 | 26.1 | 24.9 | 25.0 |
| Standard deviation (MPa) | 0.012 | 0.011 | 0.010 | 0.011 | 0.012 | |
| 14 days | Average pressure (MPa) | 25.9 | 29.3 | 30.2 | 29.1 | 27.5 |
| Standard deviation (MPa) | 0.012 | 0.011 | 0.011 | 0.010 | 0.011 | |
| 28 days | Average pressure (MPa) | 28.6 | 32.9 | 33.6 | 32.5 | 30.4 |
| Standard deviation (MPa) | 0.011 | 0.010 | 0.012 | 0.011 | 0.011 |
It was seen from Figure 1 that the compressive strength gradually improved due to the extension of age, the 10% stone powder group achieved the highest strength among all groups at the 28th day after the experiment, and the 20% stone powder group had the worst compressive strength among the three groups. From 1 to 28 days, the experimental group showed a declining trend, but its ultimate compressive strength was still higher than that of the pure river sand group.
4.2.2 Analysis of concrete shrinkage
The results obtained after 4 weeks of measurement are shown in Table 4.
| Pure river sand | 5% | 10% | 15% | 20% | ||
|---|---|---|---|---|---|---|
| 1 days | Average shrinkage (10−6/m3) | 60 | 65 | 63 | 66 | 70 |
| Standard deviation (10−6/m3) | 0.01 | 0.02 | 0.01 | 0.01 | 0.01 | |
| 7 days | Average shrinkage (10−6/m3) | 135 | 143 | 140 | 145 | 151 |
| Standard deviation (10−6/m3) | 0.02 | 0.01 | 0.02 | 0.01 | 0.01 | |
| 14 days | Average shrinkage (10−6/m3) | 169 | 186 | 188 | 190 | 193 |
| Standard deviation (10−6/m3) | 0.01 | 0.01 | 0.02 | 0.01 | 0.02 | |
| 28 days | Average shrinkage (10−6/m3) | 248 | 261 | 273 | 289 | 301 |
| Standard deviation (10−6/m3) | 0.01 | 0.01 | 0.01 | 0.02 | 0.01 |
It was seen from Table 4 that the shrinkage rate of the control group was the lowest among the five groups; from 1 to 28 days, the concrete shrinkage of the other four experimental groups was higher than that of the control group; when the content of stone powder increased from 5% to 10%, the shrinkage of different periods increased. The results showed that the shrinkage rate of concrete samples made of manufactured sand containing 5% stone powder was the lowest, showing better anti-shrinkage performance than the other three groups.
4.2.3 Optimal solution of water permeability
As the porosity and water pressure of the concrete were constant, the relative permeability coefficient was mainly affected by the seepage height. By measuring the height, the experimental data of water permeability of the sample concrete were obtained, as shown in Table 5.
| Stone powder content | Water seepage height (mm) | Relative water seepage height |
|---|---|---|
| Pure river sand | 31.3 | 21% |
| 5% | 27.6 | 18.4% |
| 10% | 24.5 | 16.3% |
| 15% | 22.7 | 15.1% |
| 20% | 18.5 | 12.3% |
- Note: Relative water seepage height = water seepage height/total height of the test specimen.
It was seen from the experimental results in Table 5 that the pure river sand group without any stone powder had the highest water seepage height and poor water resistance performance under the same pressure time and water effluent time; with the increase of the content of stone powder, the water seepage height of the specimen decreased, showing a stronger waterproof function; the experimental group with 20% stone powder content performed the best, and the group without stone powder performed the worst. Therefore, it was concluded that increasing the content of stone powder played a positive role in improving the anti-permeability performance of concrete.
5 DISCUSSION
Stone powder is a kind of tiny powder with a diameter smaller than 75 μm in the machine-made sand, whose components are the same as the processed parent rock. It is the rock and industrial waste particles that have been processed artificially. The correct proportion of stone powder is helpful in optimizing the concrete structure and making the material achieve superior working efficiency. At present, the common way of stone powder addition in pavement construction is replacing fine aggregate or cement with stone powder as a mineral admixture. At present, stone powder has been widely used to replace the traditional pure river sand in the pavement concrete construction in China.10, 11
The compressive strength represents the basic physical property of concrete materials, and its increase indicates the improvement of material firmness. To understand the compressive strength of various kinds of concrete, different algorithms are used for prediction and estimation.12-14 It was seen from the results of Figure 3 that the experimental group with a larger content of stone powder showed better compressive strength, which verified that the compressive strength was strengthened with the increase of stone powder content in the range of 0% to 20%.

Water loss shrinkage15 plays a guiding role in measuring the durability of pavement composed of concrete. The more water loss is, the more surface cracks are, the larger the area is, and the more vulnerable the concrete is. The experimental results in Table 2 showed that the addition of stone powder made the dry shrinkage rate decrease gradually, showing an inverse relationship. Therefore, to prevent water loss shrinkage, the content of stone powder should be controlled.16
The water penetration resistance17 is determined by the water–cement ratio, which has a direct and significant effect on the corrosion resistance of steel bars in concrete. The infiltration of water will cause reinforcement oxidation; as a result, the concrete will lose its support point, and the pavement may face the risk of collapse. In this study, Table 3 shows that the water penetration resistance of the material increased with the increase of the stone powder content, and the experimental groups with 10% and 20% stone powder show the lowest water permeability value.
Based on the analysis of experimental data, it was concluded that the compressive strength, dry shrinkage, and water permeability resistance of the concrete material showed favorable results when the content of stone powder was 10%. Therefore, 10% can be regarded as the comprehensive optimal solution of the stone powder content ratio in this experiment.
6 CONCLUSION
In this study, the compressive strength, shrinkage resistance, and impermeability of the concrete that was added with the measured sand containing different content of stone powder were tested. The pure river sand was taken as the control group. The experimental results were obtained, and the reasons were analyzed. Moreover, the concrete at the age of 1 to 28 days was analyzed to explore the optimal solution of the overall function of concrete based on the content of stone powder under the experimental conditions. Finally, the following conclusions were obtained.
- In the range of 0% to 20%, the greater the proportion of stone powder was, the stronger the compressive strength of concrete was, the smaller the shrinkage resistance of concrete was, and the greater the impermeability of concrete was.
- Under the conditions of this study, 10% of stone powder in the manufactured sand was the optimal solution to improve the overall performance of concrete.


