Experimental study of fabrication-induced residual strains and distortions in polymeric square plates built using fused deposition modeling process
Abstract
Residual stresses and strains generated in additively manufactured (AM) components have significant impact on their dimensional integrity. This work aims at characterizing the residual strains and deformations in square plates fabricated using the fused deposition modeling (FDM) process. The induced residual strains at the end of the printing process were measured through the integration of fiber Bragg grating (FBG) sensors, while the exhibited out-of-plane deformations of the plates were obtained using the digital image correlation (DIC) technique. The experimental results demonstrate significant part distortions at the plates' corner locations but without proceeding to quantitative correlation between the FBG and the DIC measurements.
1 INTRODUCTION
Fused deposition modeling (FDM) is a widely used type of three-dimensional (3D) printing technology where a thermoplastic filament, usually acrylonitrile butadiene styrene (ABS) or polylactic acid (PLA), is heated into a moving extruder head and deposited onto a build platform. The semi-molten polymeric material is extruded in adjacent roads (rasters) continuously, according to a toolpath defined by the part's cross-sectional boundary, layer by layer to form the final model following a bottom-up approach. During the layer-based deposition process, heat is dissipated by conduction and forced convection, and the resulted reduction in temperature causes the extruded material to quickly solidify and bond with the surrounding deposited rasters.1 The quality of bonding achieved between individual roads depends on the growth of the neck formed between adjacent filaments (wetting) and on the molecular diffusion and randomization at the interface.2 The FDM fabrication process results in material anisotropy, nonuniform thermal gradients as well as internal stresses and strains build-up within the 3D printed structures that can lead to warping, delaminations or even part failure.3
The anisotropic nature of FDM-printed components has received significant attention in recent years, and many works have been performed to address the effects of FDM building parameters on stiffness, strength, fatigue, and fracture. Important processing parameters such as layer thickness, part build orientation, raster angle, road width, air gap, printing temperature, and layout of parts on the worktable have been studied, and their effects on the printed samples' mechanical properties have been reported in various research works.4-6 In addition, experimental efforts have been directed towards measuring the residual stresses in FDM parts7 or monitoring the printing procedure using thermocouples,8, 9 IR cameras,10 vibration sensors,11 and fiber Bragg grating (FBG) sensors.8, 12 Characteristically, Casavola et al7 employed the hole-drilling method to measure residual stresses in FDM parts combined with electronic speckle pattern interferometry. Kantaros and Karalekas13 used FBGs to investigate the magnitude of the post-fabrication residual strains, considering two processing parameters, namely, the layer thickness and the rasters' deposition orientation. Kousiatza et al8, 14 used FBG sensors and thermocouples for real-time monitoring of the generated residual strains and temperature profiles in thick block specimens as well as for temperature mapping of square thin plates fabricated using the FDM technique. The results indicate that the in-process–induced temperature fluctuations strongly influence the magnitude of the resulting residual strains. These research efforts have greatly facilitated the understanding of residual stresses and strains developed in additively manufactured structures. However, more studies with respect to characterization techniques still need to be conducted to thoroughly understand and control the presence of such undesirable effects that immensely affect the printed parts' quality.
This work aims to characterize the fabrication-induced residual strains and the exhibited deformation of additively manufactured square plates based on ABS material. The residual strains were investigated using embedded FBG sensors, and their magnitude was discussed in relation to the out-of-plane displacement-field measurements taken using the digital image correlation (DIC) technique.
2 MATERIALS AND METHODS
2.1 FBG principles
FBG sensors exhibit several advantages,8 such as fast response, high sensitivity, signal integrity, long-term stability, immunity against electromagnetic radiation, insensitivity to radio frequency interference, and good corrosion resistance. The fundamental purpose of a Bragg grating is to selectively reflect only a narrow spectral element of a broadband light source, when light propagates through this modulated structure. For a single-mode (SM) and uniform FBG, the reflected signal presents a peak centered on the Bragg wavelength, λΒ0, which is directly related to the mean effective refractive index of the core, neff, and the period of the induced modulation, Λ, through the Bragg condition λΒ0 = 2neffΛ. Only the wavelengths that satisfy the Bragg condition are affected and strongly back reflected, while all the other light signals at wavelengths other than the Bragg wavelength are not phase matched and for that reason, they are transmitted unaltered. The neff and Λ parameters are strongly influenced by external changes taking place in the grating region, such as strain and temperature variations. Therefore, both parameters are modified when uniform changes in strain and/or temperature occur along the FBG, resulting in a shift to the reflected Bragg wavelength without modification of its shape.
 ()
()In this equation, it is assumed that the two lateral strains εy and εz applied to the fiber are related to the axial one εx by a Poisson relation: εy = εz = −νf εx, where νf is the Poisson ratio of the fiber. In Equation (1), ΔλΒ = λΒ − λΒ0 is the wavelength difference before and after the loading, pe is the strain-optic constant for the optical fiber, which is measured experimentally (where pe ≈ 0.215),15 αm is the coefficient of thermal expansion of the host material, αf is the coefficient of thermal expansion of the glass fiber (where αf ≈ 8 × 10⁻⁷°C−1),15 ξ is the thermo-optic constant of the fiber (where ξ ≈ 8.3 × 10⁻⁶°C−1),15 εres accounts for the solidification-induced residual strains along the optical fiber's direction, and (αm − αf) ΔT accounts for the thermal strains, εT, developed due to the thermal expansion coefficients mismatch.
2.2 Specimen fabrication and experimental techniques
The specimens considered in the present investigation were square plates fabricated out of commercial ABS material on a Dimension Elite (Stratasys, Inc., Eden Prairie, MN, USA) FDM 3D printer. Two types of plate specimens were fabricated: (a) 13-layered FBG-equipped ones for residual strains investigation and (b) 7-layered (1.778 mm), 13-layered (3.302 mm), and 21-layered (5.334 mm) ones for DIC measurements. All plates had side dimensions of 130 mm × 130 mm (width × length). The processing parameters for all types of specimens were kept the same. In detail, the layer thickness of each specimen was 0.254 mm, the raster orientation was set to be ±45° representing the machine's default tool path orientation, the temperature within the liquefier was approximately at 270°C, and the envelope temperature environment of the building chamber was set to 75°C.
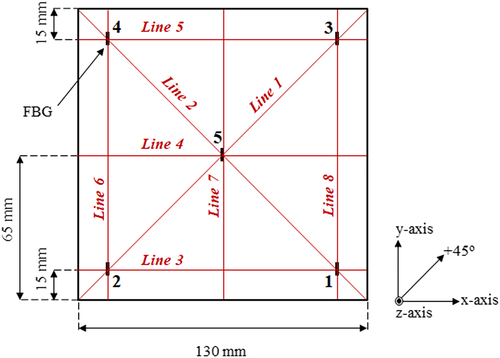
The FBG sensors were embedded in the midplane of the plates and at five locations, namely, at the plates' center and at their four corner positions. A schematic representation of the FBGs' layout is shown in Figure 1. The corners of the plate specimens close to the embedding locations 2 and 4 are the places from where the building process of each layer is alternatively initiated (±45°). The single-point FBG sensors having a core diameter of 0.125 mm (with the cladding) were equipped with a grating of 1 mm in length operating at a Bragg wavelength of 1550 nm. The FBGs were embedded all parallel to the plate samples' y-axis (90° embedment orientation). Full spectrum measurements were obtained using a Micron Optics sm125 optical sensing interrogator.

The samples' fabrication process started with the building of a predefined number of supporting layers and followed by the layerwise deposition of the model material. When the plane (layer number) was reached at which the FBG sensors should be implemented, the FDM 3D printer was manually paused. The printer's chamber was opened, and the FBG sensors were placed on the surface of the last deposited layer, while at the same instance, a reference Bragg wavelength measurement, λB0, was taken. It is mentioned that some sets of specific alignment holders were custom designed and simultaneously built with the test specimens to ensure the embedment of sensors at the correct locations. After the sensors' integration, the printing process was activated again, and the printer's nozzle returned back to the position where the layer deposition has stopped to complete the plates' fabrication procedure. At the end of the FDM process, each specimen remained onto the build platform and inside the printer's chamber for 20 hours to gradually cool down to ambient temperature. Afterwards, wavelength recordings were obtained before and after the samples' detachment from the supporting structures that were fabricated onto the build platform. The former case is designated as the constrained state, while the latter case is stated as the plates' free-standing state. Post-fabrication residual strain calculations were performed using a simplified version of Equation (1).
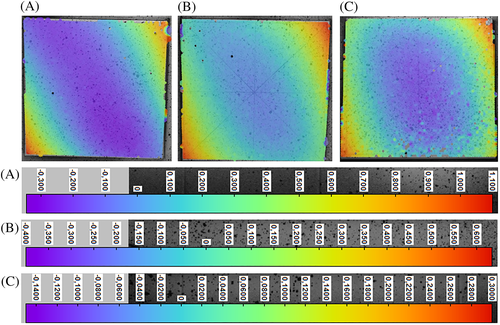
In an effort to evaluate the magnitude of the FBG-based calculated strains in relation to the observed distortion at the four plate corners, displacement fields were measured using a DIC technique to characterize the out-of-plane warpage (z-axis) of the FDM-fabricated plate specimens. DIC is a 3D, full-field, noncontact optical technique that can be used for displacement and strain measurements by digitally comparing images acquired before and after deformation appearance.16 In this work, a 3D DIC system (LIMESS, Messtechnik & Software GmbH, Germany) was used. The resolution of the cameras was equal to 1624 × 1234 pixels with an accuracy for displacements equal to 0.01 pixel. Initially, for calibration purposes, an undeformed not FDM-fabricated square flat plate was used. All plate specimens were painted using a flat white spray paint, and a black speckle pattern was manually applied using a flat black spray paint. After that, the undeformed and deformed (detached from the build platform) test samples were imaged using a dual camera setup. The displacement fields were calculated using a DIC algorithm by comparing the acquired images of the plate specimens' former and latter states. It is stated that the rigid body motion of the plates has been deducted in the results. The lines along which the DIC measurements were obtained from the test samples are depicted in Figure 1. Representative DIC images of the displacement fields acquired for the 7-layered, 13-layered, and 21-layered plate specimens are shown in Figure 2A to C, respectively.

3 RESULTS AND DISCUSSION
 ()
()In Table 1, the post-fabrication–induced residual strains, as calculated at the constrained and free-standing states of the 13-layered plate sample, are summarized for all considered FBG embedding locations. The experimental results demonstrate that compressive residual strains of considerable magnitude are mainly presented before the sample's detachment from the platform, at all different locations of sensors' embedment, reaching a mean value of −6890 με at the plate's corners. It has been reported by Kousiatza et al8 that such fabrication-induced strains, FBG-measured at a specific location within the tested specimens, are generated when the first layers of semi-molten material are deposited and fully solidified, while afterwards, their magnitude does not change drastically with subsequent layer deposition.
| FBG Embedding Location | Residual Strains εres, με | ||
|---|---|---|---|
| Constrained state | Free-standing state | ||
| Lower corners | 1 (right) | −6978 | −6761 |
| 2 (left) | −6748 | −3423 | |
| Center | 5 | −6155 | −5720 |
| Upper corners | 3 (right) | −6913 | −6223 |
| 4 (left) | −6924 | −6415 | |
- Abbreviation: FBG, fiber Bragg grating.
After the square plate's detachment from the built supporting structures, it is apparent that a strain release phenomenon is taking place, which leads to reductions in the calculated compressive strain magnitudes with the highest one being present in location 2, exhibiting a value of −3423 με. Furthermore, it is clearly deduced that significantly and noticeably lower strain values are accordingly exhibited after the part's detachment in the lower left (location 2) and upper right (location 3) corners, when compared with the respective strains calculated for the lower right and upper left embedding locations (1 and 4, respectively) as well as the plate's center (location 5).
The aforementioned findings are associated with the plate specimens' followed by printing strategy and the temperature profiles manifested during the layerwise fabrication procedure. More specifically, Kousiatza et al14 have reported experimental data that map the generated temperature profiles during the printing process of FDM-printed plate specimens with same dimensions as a function of building time. It was demonstrated that immensely steep temperature fluctuations are developed close to the samples' corners (locations 1-4) during the building procedure, on the grounds that the printer's nozzle repeatedly traverses a much shorter distance at these areas to deposit the heated material, in comparison with the parts' middle section, thus leading to higher shrinkage-induced residual strains. As already mentioned, the building process of each layer was always alternatively initiated from the corners close to the FBG embedding locations 2 and 4, while it was completed at the corners positioned close to the locations 3 and 1 (±45° building orientation), respectively. In FBG embedding position 2, the higher magnitude of strains released after the plate's detachment is ascribed to the fact that the deposited material during the FDM process is continuously exposed to considerably severe thermal gradients and phenomena, when compared with the other corners locations because of the aforementioned followed printing strategy, as well as the fact that this point is very close to the zero position of the printer's nozzle, which acts as a heat emission source. After the deposition of each layer, the machine's head travels back to this reference position; therefore, the respective plate's corner is strongly affected by the continuously induced nonuniform surface's thermal treatment.
From Table 1, it is interesting to note that a slight strain release is also performed in the plates' center, after the detachment from the platform, manifesting the supporting structures capability to restrict the potentially fabrication-induced shape distortions because of material shrinkage. It is perceived that this phenomenon is directly related to the dominant strain changes (strain release) that occur in the corner locations 2 and 3, passing through the specimens' diagonal line 1 (Figure 1).
As mentioned above, Figure 2A to C shows the whole out-of-plane displacement fields as recorded by the captured DIC images for all three plate thicknesses considered in the second type of FDM-built specimens. It is seen that the corners close to the positions 2 and 3 (diagonal line 1) exhibit significant warpage, whereas no noticeable deformation is observed from the speckle images at the two opposite corners located close to the positions 1 and 4 (diagonal line 2), especially in the case of the 7-layered printed plate.
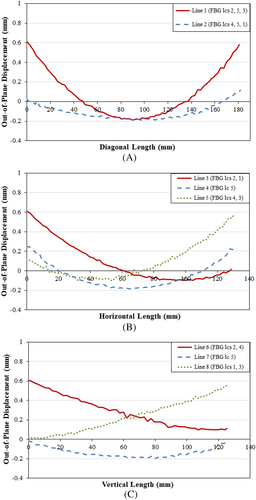
As regards the 13-layered built samples, the out-of-plane displacement profiles along the two diagonals, namely, line 1 including the points 2, 5, and 3, and line 2 including the FBG embedding locations 4, 5, and 1 are presented in Figure 3A. The out-of-plane displacements are measured along the two diagonal lines' length from the left to the right side of the plate structure. In Figure 3A, it is observed that the largest deformations are taking place at the lower left and upper right corners of the test sample (points 2 and 3, respectively), along which line 1 is passing through. Similarly, the out-of-plane displacement profiles along the three horizontal (3, 4, and 5) and vertical lines (6, 7, and 8) are illustrated in Figure 3B,C, respectively. It is noted that the out-of-plane displacements are measured from the left to the right side of the sample as regards the three horizontal lines and from the lower to the upper side of the plate structure when the vertical lines' length is considered, respectively. Again, from the diagrams presented in Figure 3B,C, it is evident that the corners close to the points 2 and 3 exhibit the largest out-of-plane deformations, reaching a value of approximately 0.6 mm. Another interesting conclusion arising from Figure 3A to C is that there is no shift of the distortion center (plates' middle section, including location 5).

The above DIC information is supported by the FBG-calculated residual strains. The two embedded FBG sensors located at the points 2 and 3 led to measured compressive strain values of −3423 με and −6223 με at the square plate part's free-standing state, as presented in Table 1, due to a reduction in the strain magnitudes of 3325 με and 690 με, respectively. It is apparent that the noticeable warpage deformation taking place at these two corners, based on the DIC measurements, results in a drastic relief of the constrained process-induced residual strains. The uneven strain release observed in the FBG-based measurements is not in full agreement with the DIC results, which exhibit uniform out-of-plane displacements at the corners close to the points 2 and 3, probably due to the sample's repositioning on the platform after detachment for the capture of the DIC images. On the other hand, from Table 1, it is seen that the compressive strains calculated after the sample's detachment, for the FBG embedding positions 1 and 4, exhibit higher magnitudes, reaching accordingly values of −6761 με and – 6415 με, on the grounds that a slighter reduction of the developed residual strains occurs in these locations. This finding is also assisted by the DIC measurements obtained for the corresponding plate's corners, manifesting the presence of considerably smaller out-of-plane deflections at these regions. Additionally, the slight deformations occurring in the plate's middle section based on the DIC results are in accordance with the strain magnitude reduction presented in Table 1 for the FBG embedding location 5.
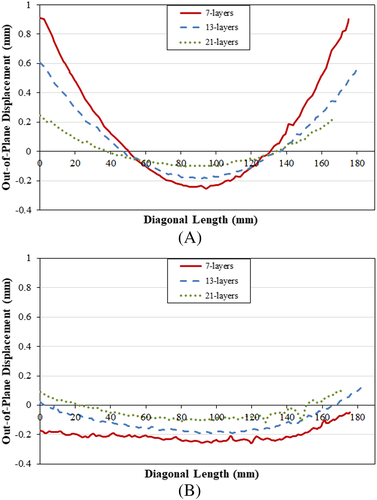
The comparative profiles of the out-of-plane displacements along the diagonal lines 1 and 2 for all three plate thicknesses (7-layers, 13-layers, and 21-layers) considered in the present study are accordingly presented in Figure 4A,B. The experimental results demonstrate that for all three investigated plate thicknesses, the main distortions are exhibited along the diagonal line 1, while mild out-of-plain displacements occur in the opposite plates' corners (along diagonal line 2). Furthermore, it is shown that the out-of-plane displacements along both diagonal lines (1 and 2) are decreased as the plate samples' deposited layers are increased. Finally, by examining the diagrams depicted in Figure 4A,B, it seems that there is an analogy between the layers' number increase and the reduction of the out-of-plane displacements, which is more prominent along the diagonal line 1.

4 CONCLUSIONS
In this work, an experimental study was carried out to investigate the development of the residual strains and the out-of-plane distortions exhibited at the end of the FDM process of square plate specimens. The experimental results demonstrate in an effective manner that part distortion (warpage) generated as a result of the printing process is evident at specific plates' corner locations and related to the measured residual strains, although no quantitative correlation is presented in this paper. Finally, both experimental methodologies used in the present investigation can assist towards better understanding and controlling the presence of such undesirable effects that can immensely affect the end parts' quality.
ACKNOWLEDGMENTS
The DIC experimental work was conducted at the Laboratory of Testing and Materials, Section of Mechanics, School of Applied Mathematical and Physical Sciences of the National Technical University of Athens (NTUA). The authors are grateful to Dr Ermioni Pasiou for her assistance with the DIC experiments.
CONFLICT OF INTEREST
We declare that the work presented in the manuscript is original and that has not been published or submitted for publication elsewhere. Additionally, we wish to confirm that there are no known conflicts of interest associated with this publication and there has been no significant financial support for this work that could have influenced its outcome.


