Influence of manufacturing orientations on the morphology of alloy 718 single struts manufactured by selective laser melting
Abstract
Selective laser melting (SLM) is of great interest for manufacturing lightweight structures such as lattices. It allows a broad range of lattice topologies to be created. However, when manufacturing small struts, roughness, lack of dimensional accuracy, and porosity level can decrease their mechanical properties and thus affect the mechanical response of the entire structure. This study focuses on the high-resolution characterization of alloy 718 (UNS N07718) single struts (constitutive elements of the lattice) manufactured by SLM. Process parameters, strategy, and post-treatments remain constant while varying strut positions on the build plate and orientations. A methodology for the systematic characterization of 19 struts with high-resolution X-ray tomography has been developed. Different features related to the strut size, shape, waviness, roughness, and porosity are extracted. The analysis of those features when varying strut positions and orientations highlights the influence of each parameter. The build orientation is a first-order parameter influencing strut morphology as already referenced in the literature. This systematic study reveals also the influence of the in-plane orientation for inclined struts that alters their roughness, shape, and size.
1 INTRODUCTION
Lattice structures are made out of a network of interconnected struts. They exhibit unique characteristics that monolithic materials cannot offer. Such characteristics are, for example, high stiffness-to-weight ratio,1-5 improved energy absorption,6 optimized heat transfer,7, 8 and optimization of surface topology for osseointegration.9, 10 Within this family, periodic lattice structures are composed of a repetition of a unit cell. Their topology and relative density can be tuned to achieve required properties.
The recent development of additive manufacturing (AM) techniques allows a larger freedom in designing parts. Various studies have been focused on manufacturing lattice structures with powder-based AM techniques.11-14 This study will focus on the characterization of lattice structures made by SLM.
Powder-bed AM techniques come along with limitations linked to their process parameters and scan strategies. When manufacturing small struts, defects can appear. Knowing the origin and amplitude of such defects is of major importance in order to control the mechanical properties of lattice structures. Studies focusing on the characterization of lattice structures have already determined some links between process parameters, inherited defects, and the related mechanical behavior as compared with the expected one.15-24 Defects are usually characterized using X-ray tomography at the scale of the struts. They can be sorted into different categories:
1.1 Geometrical defects
- Size: For cylindrical struts, diameters are calculated with different approaches. Inscribed and circumscribed diameters are frequently determined.19, 22
- Shape: The difference between the ideal shape (usually a cylinder with circular cross section) and the manufactured one. The manufactured cross section could be elliptical due to overmelting on the down-facing surfaces.19, 21 It can be quantified by using an equivalent ellipse to determine its shape ratio.
- Waviness: The waviness of the neutral fiber of the strut as compared with the neutral axis of the CAD model.
1.2 Surface defects
- Roughness: Line roughness can be calculated isolating line profiles along strut axis. Studies reported calculation of arithmetic roughness and maximum height of profile.19, 20, 22
- Surface defect: Isolating surface defects and analyzing their morphology, sharpness, and depth allowed also the understanding of mechanical response of struts especially in fatigue.25
1.3 Internal defects
The quantification of the strut size is the most evaluated parameter. Liu et al.16 showed that for SLM-manufactured struts in AlSi10Mg alloy, the strut diameter—determined at each slice by fitting a circle to the surface—is larger than the nominal one for inclined and horizontal struts but is lower for vertical struts. Dallago et al.15 highlighted the same trend for Ti-6Al-4V struts manufactured by SLM.
In most of the studies, defects are analyzed and quantified to be implemented in simulations at the scale of the lattice. Strut orientation effect on porosity level in AlSi10Mg alloy has been investigated by Delroisse et al.18 They highlighted a higher level of porosity on inclined struts due to a larger time spent at high temperature for the “down-facing” zone. However, there is a lack for a complete study of the morphology of the struts as a function of their position and orientations.
A previous study focused on the development and validation of a mechanical equivalent diameter for EBM lattice structures.19 This work utilize similar methodology to link strut positions and orientations with defects type, magnitude, and morphology. Their position in the build envelope, build orientation, and in-plane orientation are the investigated parameters. High-resolution X-ray tomography is systematically used to quantify strut defects.
2 MATERIALS AND METHODS
2.1 Manufacturing and materials
2.1.1 Raw material
The raw material used in this study is alloy 718 (UNS N07718) gas atomized powder provided by Aubert & Duval. Its chemical composition is listed in Table 1. The particles are spherical with a unimodal particle size distribution. They exhibit a 29.5 μm median diameter with 80% of the diameters between 15 and 54 μm.
| Element | Ni | Cr | Fe | Nb | Mo | Ti | Al | Co | C | Si | O |
| wt% | 53.9 | 19.1 | 17.2 | 5.36 | 3.15 | 1.03 | 0.44 | <0.1 | 0.036 | 0.028 | 0.012 |
2.1.2 Manufacturing and post-treatment
Parts are manufactured using an EOS M290 machine with a layer thickness of 40 μm and a build envelope of 250 mm × 250 mm × 325 mm. A stainless steel recoater is used. The process parameters used in this study have been set to reduce the well-known overmelting phenomenon on overhanging surfaces.18, 19, 27 For that purpose, scan speed and scan power have been increased compared with the supplier recommended parameters. The melting strategy used is based on hatching without contouring. As explained in literature,28, 29 the repeated melting and solidification steps during SLM process induces a heterogeneous solidification rate, thus thermal contraction within the parts. This thermally induced strain could lead to a nonrespect of the CAD dimensions and build errors when the recoater hit the parts. To limit that effect, the use of contours has been proscribed.
After production, parts undergo classical homogenization and two-steps aging under primary vacuum (10−5 bar). No post-treatments for optimizing roughness and porosity were used.
2.1.3 Structures of interest
This study aims at analyzing morphology of BCCZ lattice structures produced by Selective Laser Melting (SLM). A unit-cell of such a structure is represented in Figure 1A. It is composed of vertical and inclined struts oriented at 35.3° from the build plane. The strut's diameter DCAD is set to 1 mm, and the length of the vertical strut is set to LV = 7 mm. Inclined struts have a length LI = 6.06 mm.
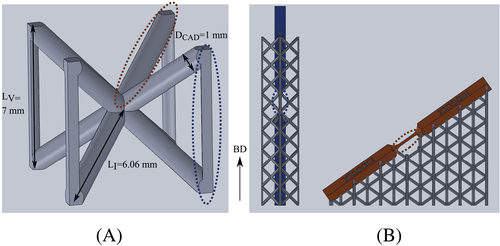
The morphology of the constitutive elements of the lattice structure is analyzed in this study. Vertical and inclined struts have thus been designed with a diameter DCAD and a length LV and LI, respectively (see Figure 1B).
Struts are placed between two parallelepipeds to place the grips for a further uniaxial tensile testing. In order to ensure manufacturability of those samples and to ensure a thermal environment similar to the one of the lattice, lattice supports have been designed and are removed by electrical discharge machining before X-ray tomography. The gauge length of the sample is not supported to respect the same thermal conditions as inside the lattice structure.
2.1.4 Parameters of interest
Keeping process parameters and strut diameter constant, a focus has been made on evaluating the effect of strut positions and orientations.
Microstruts are placed at different positions within the build plate using a Latin hypercube sampling method. Origins of x-axis and y-axis are on the lower left corner of the build plate (see Figure 2). Vertical and inclined samples are printed. Their orientation from the build plane is α = 90° and α = 35.3°, respectively. It is commonly denominated as the build orientation. The recoater and argon flow directions are represented by arrows in Figure 2.
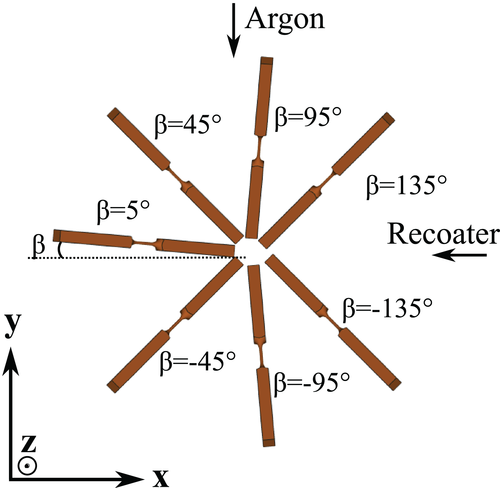
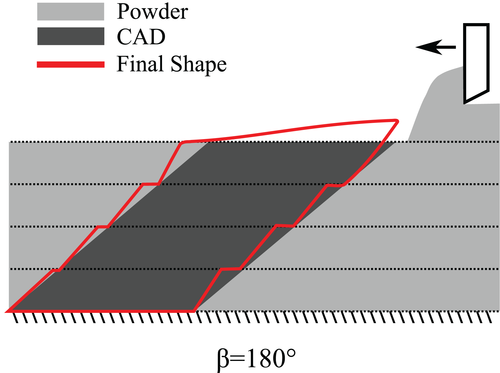
For inclined samples, the orientation around the build direction (z-axis) is also a parameter of interest (β = [−135°:135°]). It will be denoted as in-plane orientation. As explained earlier, due to differences in solidification and thermal contractions, the zone on the down-facing side can rise as shown in red in Figure 3. The recoater could then hit the part during manufacturing. To avoid critical build error, orientations facing the recoater movement are avoided (β > 135° and β < −135°). The β = 0° orientation is also avoided for similar reasons.
Nineteen samples were analyzed by X-ray tomography in order to assess their morphology and quantify their defects (six verticals and 13 inclined).
2.2 X-ray tomography analysis
2.2.1 Experimental procedure
The morphology of the struts is assessed using an X-ray tomograph (RX Solutions Easytom XL) equipped with a nanofocus LaB6 source and a flat panel detector. A 1-μm thick W cathode is used. The source tension and intensity are kept constant at 100 kV and 25 μA, respectively. The beam is filtered with a copper plate of 0.5 mm. To be able to visualize small pores, a magnification of 63.5 is set leading to a voxel size of 2 μm. The visualization of the entire gauge length thus requires a helical scan with 2784 projections, and five turns over a translation of 14 mm. The duration of a scan is roughly 45 minutes.
Reconstruction is performed with the dedicated RX Solution software using filtered-back projection algorithm. For each scan, the same beam hardening filter is used. Volumes are rotated along their neutral axis to align the down-facing surface at the same angle for each inclined sample.
2.2.2 Extracted features
A 3D median filter of radius 1 pixel is applied prior to thresholding. Two threshold values are set for a better estimation of internal and external porosity to counteract a slight beam hardening effect. From the binary image, quantitative data are systematically extracted. An ImageJ30 script has been developed to extract morphological features of the struts. The first step of the script corresponds to a fine alignment of the neutral axis of the strut with the z direction of the 3D volume. To do so, the image is rotated around its x-axis and y-axis. For each configuration, the common surface area of the strut in the z direction is calculated. The strut is considered aligned for x and y angles maximizing this common surface.
Strut size
- Dinsc is the inscribed diameter calculated from the inscribed surface. It is defined as the common area of all the slices of the volume in its neutral axis direction.
- Dcirc is the circumscribed diameter calculated from the projection of the surface of every slice of the volume, ie, the circumscribed surface.
-
 is the diameter of a perfectly circular cylinder having the same volume and height as the strut. It is called the isovolume equivalent diameter.
 - DEQ is the mechanical equivalent diameter calculated from a fast Fourier transform (FFT) simulation directly from the volume as explained by Suard et al.19 It corresponds to the diameter of a perfectly circular cylinder having the same stiffness as the scanned one.
 .
.
 is calculated using the volume Vs and height hs of the strut as
 .
.Strut shape
 ()
()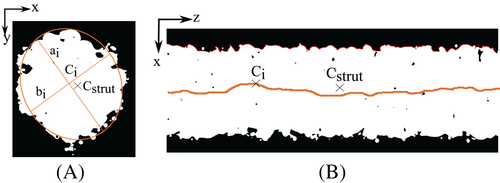
Waviness
 ()
()Roughness
 ) and a maximum height of profile (
 ) are calculated:
 ()
()For each strut, the mean arithmetic roughness
 and the maximum height of profile
 are extracted.
Porosity analysis
Each pore is isolated and labeled, and several features are extracted such as its volume, center of mass, and external surface. From those features, the pore size distribution, median pore diameter, pore spatial distribution, and pore morphology can be calculated.
- Porosity:
 .
. - Median pore diameter D50. Pore diameters are calculated using the diameter of a sphere having the same volume as the pore.
- Sphericity index:
 . It ranges between 0 and 1 and is equals to 1 for a sphere.
3 EFFECT OF STRUT INCLINATION FROM THE BUILD PLANE (BUILD ORIENTATION)
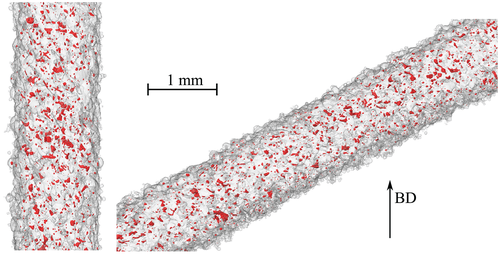
The use of X-ray tomography enables the qualitative and quantitative analysis of strut defects. Figure 5 shows a zoom of the 3D representation of a vertical strut and an inclined one. The strut size seems to be close to the nominal diameter (1 mm). The surfaces present two types of defects. Some particles are stuck on the surface without prior melting especially on the down-facing surface. The other surface irregularity, which induces a larger surface roughness, seems to be linked to a poor control of the melt pool from one layer to another. It can be attributed to the absence of contour in the scanning strategy. Pores are represented in red. Qualitatively, they seem to be spread quite homogeneously throughout the strut and exhibiting an irregular morphology.
3.1 Size
As explained in Section 2.2.2, different diameters are computed from the 3D image of the strut. They are listed in Table 2. Globally, vertical struts exhibit slightly smaller diameters than inclined ones. This is due to the well-known “overmelting” on the down-facing surfaces.19, 21 The use of the four different diameters give broad information about the consequence of overmelting on the dimension of struts. The largest difference between vertical and inclined struts is for the isovolume equivalent diameter (+7%). In the meantime, the mechanical equivalent diameter (DEQ) does not fluctuate largely. As explained by Suard et al.,19 the mechanical equivalent diameter allows the discrimination of the volume that does not contribute to carry the load. Overmelting occurring in inclined struts seems thus to induce an increase of the global volume without a significant increase of the mechanically efficient volume.
| α, ° |
 , mm , mm |
〈Dinsc〉, mm | 〈Dcirc〉, mm | 〈DEQ〉, mm |
| Vertical | 0.98 | 0.69 | 1.15 | 0.92 |
| Inclined | 1.05 | 0.71 | 1.21 | 0.93 |
| Difference | 7% | 3% | 5% | 1% |
3.2 Waviness and shape
The waviness of the strut is the mean deviation of the strut's axis across its length. It is of 12 μm and 19 μm for vertical and inclined struts, respectively. This difference is also due to the overmelting phenomenon leading to difficulties to control the melted area. As a comparison, Lozanovski et al.21 computed the waviness of Inconel 625 inclined struts with a 300 μm diameter. Their mean waviness is around 50 μm. The difference of waviness compared with this study can be explained by the difficulty to control precisely the melt pool location for melting struts with such a small diameter.
The mean shape deviation is of 0.05 for vertical struts and 0.10 for inclined ones. Inclined struts are elongated in the build direction due to the overmelting phenomenon.
3.3 Roughness
The mean arithmetic roughness Ra and maximum height of profile Rt both increase for inclined struts compared with vertical ones. Ra increases from 18 to 24 μm and Rt from 195 to 241 μm. It is in accordance with an increase of the global volume while keeping a constant mechanical equivalent diameter (explained in Section 3.1). The overmelting phenomenon seems thus to increase the roughness of the struts by increasing the depth of melt pool in the build direction without increasing its mechanical equivalent diameter.
3.4 Porosity
Mean values of porosity, median diameter, and sphericity index are reported in Table 3.
| α, ° | 〈P〉, % | 〈D50〉, μm | 〈Sph〉 |
| Vertical | 0.33 | 7.0 | 0.78 |
| Inclined | 0.22 | 8.1 | 0.79 |
| Difference | −32% | 13.5% | <1% |
| Size | Waviness and Shape | Roughness | Porosity | ||||||||
 |
Dinsc | Dcirc | DEQ | W | Shape | Ra | Rt | D50 | P | Sph | |
| β | 2.6E−03 | 4.9E−02 | 1.5E−02 | 1.6E−02 | 1.5E−02 | ||||||
- Note. Green values represents P values lower than .05 and red ones indicates P values greater than .05.
The median pores diameter and sphericity are rather constant between vertical and inclined struts. Median pore diameter is around 7 μm, but pores as large as 60 μm are present within the struts. Elongated pores are frequently visible in the struts (sphericity index = 0.78). They are spread across the width and length of the struts regularly (see Figure 5). This type of porosity is supposed to be linked to the high speed and high power scan strategy leading to a bad overlapping between two melt pools.
The mean porosity decreases from 0.33% to 0.22% when comparing vertical struts and inclined ones. Since the pores are due to a bad overlapping of the melt tracks, when melting inclined struts, the heat accumulates on the down-facing surface inducing larger melt pools and thus reducing porosity.
4 SECOND-ORDER PARAMETER
4.1 Sensitivity analysis
For the nineteen samples analyzed, eleven morphological features are extracted. Each sample corresponds to a specific position, build orientation, and in-plane orientation. In order to understand the effect of other parameters on the morphological features of the struts, a one-way analysis of variance (ANOVA) sensitivity analysis has been carried out using statsmodel package from python. For each feature, the influence of each parameter is computed independently from the other ones. This methodology gives trends to understand second-order parameter influence. The output of the calculation is a P value resulting from the Fisher acceptation test. It is set that the parameter is influential if the resulting P value is lower than .05.
The sensitivity analysis has been carried out on vertical struts and inclined struts separately. It has shown that the position of the struts within the build plate has no effect on their morphology.
The ANOVA is reported in Table 4 with red cells indicating P values larger than .05. It shows that for inclined struts, the in-plane orientation affects the struts shape, roughness, and size. The effect of in-plane orientation on those morphological features is carefully analyzed.
4.2 Effect of in-plane orientation
4.2.1 Results
As explained earlier (Figure 2), inclined struts with different in-plane orientations β have been manufactured. Figure 6 represents the evolution of shape deviation, arithmetic roughness (Ra), maximum height of profile (Rt), and mechanical equivalent diameter as a function of the in-plane orientation.
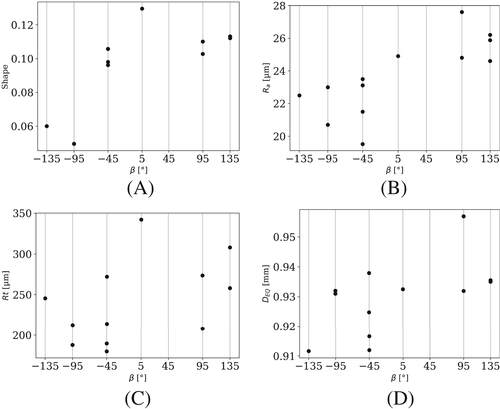
The shape deviation as a function of the angle β is represented in Figure 6A. The struts present the largest shape deviation for an orientation of 5° and the smallest deviation for struts at −95°. The variation of maximum height of profile (Rt) in Figure 6C follows the same trend.
The mechanical equivalent diameter and arithmetic roughness as a function of β show two populations with low values for β < 0° and larger values for β > 0°.
4.2.2 Discussion
Two effects can influence part's quality as a function of its in-plane orientation. According to Figure 2, the recoater moves in the build plane along the x direction (from x+ to x−) and the argon flows in the y direction (from y+ to y−). They can both affect struts morphology.
Potential effects of the recoater
- The recoater path length, i.e., the maximum length of the strut in the x direction.
- The orientation of the strut during interaction—front (β = ±135°) or back to the recoater directions (β = ±45°).
Potential effects of the argon flow
As seen in Figure 6B and D, large differences of roughness and mechanical equivalent diameters are visible between struts with a positive β orientation and a negative one. This variation cannot be explained by the recoater's action. The argon flow arises from y+ to y− direction. For struts with a positive in-plane orientation, the argon flow reaches firstly the down-facing side of the strut, whereas for negative in-plane orientations, it arrives of the opposite side. It can affect the thermal environment on the down-facing surface and thus modify the distortion of the strut.
In situ monitoring of the process needs to be carried out to verify such hypothesis and to be able to discriminate the influence of the argon flow and the recoater.
5 CONCLUSION
This study presents the systematic analysis of vertical and inclined struts as a function of their position and orientations using high-resolution X-ray tomography.
A methodology for the systematic analysis of the morphological features of struts is developed. It allows the extraction of strut shape (shape ratio and angle of equivalent ellipse), waviness, roughness (Ra and Rt), and size (inscribed, circumscribed, isovolume, and mechanical equivalent diameters).
The distinction between first-order and second-order parameters is carried out using this methodology and applying an ANOVA sensitivity approach.
The build orientation affects largely the morphology of the struts. Inclined struts have larger size, shape deviation, and waviness but lower porosity. On the contrary, the position of struts in the build plate does not influence their morphology. The in-plane orientation for inclined struts is a second-order parameter affecting strut shape, roughness, and size. The argon flow that modifies local thermal environment and the recoater that can interact with the struts during manufacturing could explain such variations.
ACKNOWLEDGEMENTS
This work has been carried out within the framework of the LASER project from the French Institute of Technology IRT Saint Exupery in collaboration with SIMaP laboratory. We are thankful to ANR and industrial partners for their funding of the project. The authors also gratefully acknowledge C. Josserond at SIMaP for his help with the tensile test monitoring.
CONFLICT OF INTEREST
The authors declare that they have no conflict of interest


