Transcriptomic identification of differentially expressed genes in Levonorgestrel resistant endometrial cancer cell lines
Abstract
Endometrial cancer (EC) is the most common gynecologic malignancy in the world and incidence is steadily increasing. The Levonorgestrel Intrauterine System (LNG-IUS) is an alternative conservative treatment for early-stage EC, however, Levonorgestrel (LNG) resistance occurs for 1 in 3 people. This study aimed to present potential LNG resistance mechanisms and identify differentially expressed genes (DEGs) in EC cell lines. Two LNG resistant cell lines were developed through long term culture in LNG (MFE296R and MFE319R). Whole transcriptome sequencing was carried out on triplicate RNA samples. EdgeR v3.32.1 was used to identify differentially DEGs. Blast2go V6.0 (BioBam software) was used for functional annotation and analysis of genomic datasets. Protein interactions were investigated using the STRING database, including the identification of genes with high levels of interaction (HUB genes). Select DEGs and HUB genes were validated by quantitative real-time polymerase chain reaction (qRT-PCR) and Western blot. Fifteen DEGs were identified according to FDR < 0.05 and logFC < 2. Protein analysis identified six HUB genes with a degree of connectivity > 10. Relative mRNA expression of MAOA, MAOB, THRSP, CD80, NDP, LINC01474, DUSP2 and CXCL8 was significantly upregulated in both LNGR cell lines. Relative protein expression of GNAO1 and MAOA were significantly upregulated in both LNGR cell lines. This research identified novel markers of resistance in LNGR cell lines. We discussed potential mechanisms of LNG resistance including dedifferentiation and immunostimulation. The next step for this research is to validate these findings further in both translational and clinical settings.
1 BACKGROUND
Endometrial cancer (EC) is the most common gynecologic malignancy in the world with over 380,000 new cases and 90,000 deaths per annum.1 Incidence has been steadily increasing over the last decade and is predicted to increase by more than 50% in the next 20 years, making EC an increasingly problematic gynecological cancer.1 Endometrioid EC is the most commonly diagnosed histological subtype. Making up 80% of total cases, these cancers are usually early stage and have more favorable clinical outcomes.2 The standard treatment of EC consists of a total laparoscopic hysterectomy and bilateral salpingooophorectomy.3 However, the growing incidence of premenopausal people being burdened with this disease,4 alongside the direct association of EC with high body mass index5, 6 is complicating the surgical approach to the disease and increases the need for conservative management.
The Levonorgestrel Intrauterine System (LNG-IUS) is gaining traction as an alternative treatment for early-stage EC for people that are unable to undergo primary surgery.7-10 However, evidence appears to show a recalcitrance in response to treatment in one in three people.7-10 Therefore, while the LNG-IUS is being utilized clinically, the lack of predictive biomarkers limits the certainty of recommendation for the treatment,11 and invasive endometrial biopsies every 3−6 months are required to monitor treatment response.3 While both molecular and clinicopathological predictors of response have been investigated previously, there are still no clinically utilized predictive biomarkers to guide LNG-IUS treatment.12 Alongside this, the current knowledge around LNG resistance is scarce.
Whole transcriptome sequencing first became available with the advent of next-generation sequencing technology and plays an essential role in the understanding of the genome as a whole and how it responds to diseases, pathogens and environmental challenges.13 This study aimed to carry out RNA sequencing and subsequent protein analysis on LNG resistant and matched sensitive early-stage EC cell lines (MFE296 and MFE319). This may elucidate potential mechanisms of LNG resistance in EC cells and identify potential predictive biomarkers for LNG-IUS treatment of early-stage EC.
2 METHODS
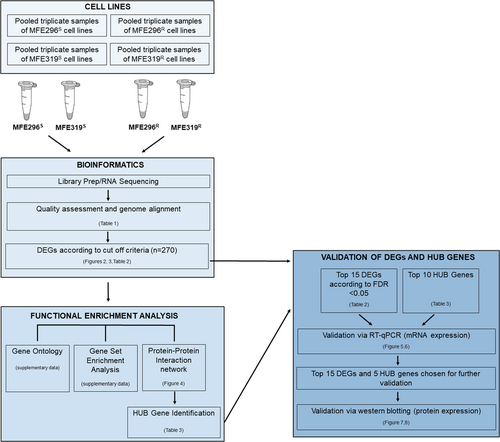
A schematic of the methods can be seen in (Figure 1).
2.1 Development of LNG resistant cell lines
LNG resistant Endometrioid EC cell lines MFE296R and MFE319R were developed as previously described.14 MFE296 and MFE319 cell lines were gifted by the Gynecological Cancer Research Group at the University of New South Wales, Sydney, Australia. Cells were cultured as per the supplier's recommendations: MFE296 in Minimum Essential Medium (MEM) (Gibco; Thermo Fisher Scientific #11095-080) containing 10% fetal bovine serum (FBS) (Gibco; Thermo Fisher Scientific #10-091-148) and MFE319 in 1:1 MEM/Roswell Park Memorial Institute Medium (RPMI 1640) (Gibco; Thermo Fisher Scientific #11875-093) containing 20% FBS. All media was supplemented with 100U/ml penicillin/streptomycin (Gibco; Thermo Fisher Scientific, #15070-063). Cells were grown in 5% CO2 at 37°C. Cells were confirmed negative for mycoplasma.
MFE319R and MFE296R cell lines were developed from parental cells via continuous exposure to LNG dissolved in 0.001% DMSO. MFE296R cells were treated with 450 µM LNG, MFE319R with 350 µM LNG. An LNG sensitive(s) DMSO control was created for each cell line (MFE296S, MFE319S) at a dose of 0.001% dissolved in respective culture media.
2.2 RNA extraction
Total RNA was extracted from cell pellets using the zymo Quick-RNA kit (Zymo cat# R1057) according to the manufacturer's instructions. Triplicate samples from each cell line were pooled and RNA quantification (in ng/µL) alongside purity was assessed using the NanoDrop spectrophotometer (Thermo Fisher Scientific). A 260/280 and 260/230 ratio of ~2.0 nm was considered optimal. Furthermore, RNA integrity was calculated using the Agilent Bioanalyzer (Agilent) and samples selected for sequencing had a RIN value of greater than 7.5.
2.3 RNA sequencing and data processing
RNA extracted from MFE296S, MFE296R, MFE319S and MFE319R cell lines were sequenced at the Australian Genome Research Facility (AGRF) for whole transcriptome sequencing following Illumina's TruSeq RNA sample preparation protocol. Poly(A) enriched RNA reverse-stranded samples (MFE296S, MFE296R, MFE319S, and MFE319R) were sequenced on an Illumina NovaSeq platform to produce 100 bp single end data. Analysis was performed in real time by the NovaSeq Control Software v1.7.5 and Real Time Analysis v3.4.4, running on the instrument computer. The Illumina bcl2fastq 2.20.0.422 pipeline was used to generate the sequence data. The data generated here met the AGRF quality standards.
Quality assessment of the raw RNA-seq data was done using FastQC v0.11.915 and followed by filtering using Trimmomatic v0.3916 to a Phred score of >20. The cleaned single end reads were then mapped to the Homo Sapiens genome (HG38) using the STAR aligner v2.7.0egimkl-2017a17 with default settings. Read counts for gene feature in the H. sapiens official gene set were generated using FeatureCounts from the Subread v2.0.0-GCC-9.2.018 package with the default settings except for strandedness set at “reverse” based on the sequencing chemistry used during library preparation. EdgeR v. 3.32.1 was used to calculate differential expression.19
2.4 Protein−protein interaction (PPI) network construction and hub genes screening
STRING, (http://stringdb.org), a database for known and predicted PPIs was used to develop a PPI network of the 218 protein-coding genes. Edges with a minimum confidence score of 0.400 were included in the network. The PPI network was analyzed and visualized by Cytoscape software. The top 10 hub genes were identified using the Cytoscape plug-in, CytoHubba according to the degree of connectivity of each node. These Hub genes may represent key genes in LNG resistance. Molecular Complex Detection (MCODE) was used to identify densely packed regions in the PPI network that may represent molecular complexes for further analysis.
2.5 Functional enrichment analysis
Blast2go (BioBam software) was used for overrepresentation analysis (Gene Ontology; GO) of the 271 DEGs. Three categories of GO terms including biological process (BP), cellular component (CC), and molecular function (MF) were generated with each category containing a hierarchy of categories, going from general to specific using Fishers exact test. The GO terms are ranked according to the percentage of gene sequences being involved in those pathways from highest to lowest. GO terms were assigned a p-value and a False Discovery Rate (FDR), the adjusted p-value for multiple hypothesis testing (BH-adjustment). GO IDs p < 0.05 were deemed statistically significant.
2.6 Reverse transcription quantitative polymerase chain reaction (RT-qPCR)
Conversion of mRNA (1 μg) to double-stranded cDNA was carried out using the QuantiTect® RT kit following the manufacturer's instructions (Qiagen #205311). NCBI Primer Blast was used to design primers for each of the candidate genes. Custom DNA oligos were purchased from Integrated DNA technologies (IDT). A list of primers used in this study can be seen in Supporting Information: Table 1. 25 ng of cDNA, 100 nM of primers and 12.5 μL SYBRGreen master mix (Qiagen # 204143) was used in each reaction. RT-qPCR cycling conditions were 95°C for 10 min, (95°C for 15 s, 60°C for 30 s, 72°C for 40 s) for a total of 40 cycles and then 95°C for 60 s, followed by melt curve analysis. Ct values were analyzed using the normalization method against three reference genes: (succinate dehydrogenase complex flavoprotein subunit A (SDHA), 90-kDa heat shock protein 1 beta (HSPCB) and 60 S ribosomal protein L13a (RPL13A) to calculate the ΔCt (ΔCt mRNA Ct—geomean endogenous reference genes). ΔΔCt was then calculated relative to sensitive controls (ΔCt (sample1)—ΔCt (sample2)). Fold change was then calculated.
2.7 Western blot analysis
Protein lysates of MFE296S, MFE296R, MFE319S and MFE319R cell pellets were extracted using Pierce™ RIPA lysis buffer (Thermofisher #89900) + Pierce™ Protease inhibitor (Thermofisher, #A32953). A BCA assay was carried out on protein lysates using then Pierce™ BCA Protein Assay Kit (Thermofisher #23225) according to manufacturer's instructions to determine the protein concentration of the lysates. 25 µg of MFE296S, MFE296R, MFE319S and MFE319R cell lysates were loaded on a 4%−20% Tris-Glycine gel (Invitrogen, #XP04200BOX) alongside 10 µL of Spectra Multicolor Broad Range Protein Ladder (Thermo Scientific, #26634). Gels were run at 130 V for 90 min. Samples were transferred onto a 0.45μm nitrocellulose membrane and blocked for one hour at room temperature with 3% BSA in 0.1% Tris-buffered saline/Tween (TBST). Membranes were incubated with primary antibody overnight at 4°C and then with the secondary antibody for one hour at room temperature. A table of all antibodies used can be seen in Supporting Information: Table 2. Membranes were imaged and quantified using Pierce™ SuperSignal™ West Pico PLUS Chemiluminescent Substrate (Thermofisher) and the iBright CL100 (Invitrogen). Band size is described as relative optical density using α-Tubulin as a loading control. Blots were carried out in biological triplicate.
2.8 Statistical analyses
Statistical analyses were performed using GraphPad Prism 9.0. All results are represented as mean ± standard deviation (SD) unless otherwise stated. A T-test was performed on fold change values for differences in protein and mRNA expression between LNG-resistant and LNG-sensitive MFE296 and MFE319 cell lines. A p value of ≤0.05 was considered statistically significant.
3 RESULTS
3.1 Identification and validation of DEGs from LNG resistant MFE296 and MFE319 cells
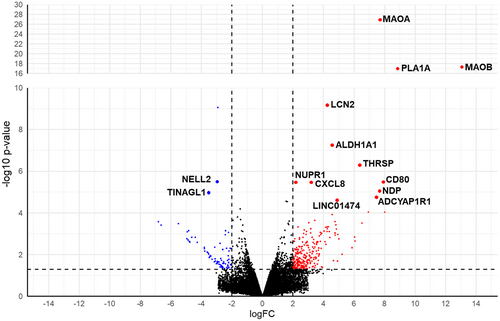
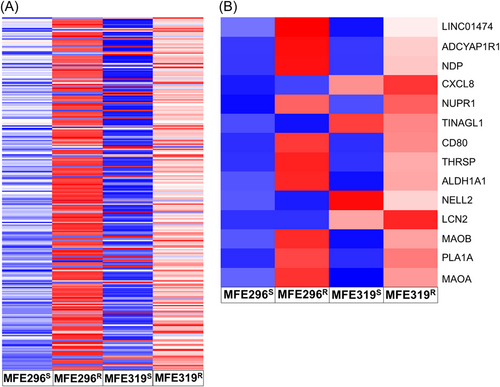
RNAseq analysis was carried out to identify DEGs between LNG resistant and LNG sensitive early-stage EC commercial cell lines (MFE296 and MFE319). High throughput sequencing generated a total of 1.62E07 high quality reads and about 98% of these sequenced reads mapped successfully to the Homo sapiens, hg38 build genome (Table 1). An overlap between the mapped reads and annotated features was observed with an average of 65% of mapped reads assigned to at least one gene body (Table 1). The R-package DESeq. 2 calculated 18,095 genes as differentially expressed and a volcano plot to display the distribution of all identified DEGs was generated with labeled genes representing FDR > 0.05, Fold change > 2 and expression conserved across both cell lines (Figure 2). To identify DEGs that are more likely to be clinically relevant, genes that did not have conserved expression trends across both MFE296 and MFE319 cell lines were excluded from further analysis. Alongside this, DEGs falling below a threshold of p < 0.05 and logFC < 2 were excluded for analysis. Using this cut-off criteria, 270 DEGs (upregulated in resistant cell lines n = 241; downregulated in resistant cell lines n = 29) were found to be statistically significant (Figure 3A). Of the 270 DEGs, 223 were protein coding RNAs, 22 were non characterized noncoding RNAs, 17 were long-noncoding RNAs, 6 were pseudogenes and 2 were small nucleolar RNAs. 15 DEGs were found to be significantly differentially expressed according to the FDR > 0.05 (Table 2, Figure 3B).
| Sample | Total raw reads | Total quality trimmed reads | Mapped (%) | Assigned (%) |
|---|---|---|---|---|
| MFE296R | 1.75E + 07 | 1.62E + 07 | 97.65 | 64.5 |
| MFE296S | 2.26E + 07 | 2.15E + 07 | 97.63 | 64.9 |
| MFE319R | 1.91E + 07 | 1.82E + 07 | 97.82 | 63.9 |
| MFE319S | 2.0E + 07 | 1.90E + 07 | 98.32 | 65.5 |
- Note: Mapped shows the number of quality trimmed reads aligned to the genome and assigned shows the number of reads that were assigned to gene models.
| Gene Name | logFC | p Value | FDR |
|---|---|---|---|
| Monoamine oxidase A (MAOA) | 7.75 | 1.19E−27 | 1.88E−23 |
| Phospholipase A1 (PLA1A) | 13.06 | 3.2E-18 | 2.54E-14 |
| Monoamine oxidase B (MAOB) | 8.89 | 1.04E-17 | 5.5E-14 |
| Lipocalin 2 (LCN2) | 4.25 | 6.84E-10 | 0.000003 |
| Neural EGFL Like 2 (NELL2) | −2.92 | 8.73E-10 | 0.000003 |
| Aldehyde dehydrogenase 1 family, member A1 (ALDH1A1) | 4.54 | 5.49E-08 | 0.000145 |
| Thyroid hormone-inducible hepatic protein (THRSP) | 6.40 | 4.96E-07 | 0.001124 |
| Cluster of differentiation 80 (CD80) | 7.92 | 3.1E-06 | 0.005377 |
| Tubulointerstitial Nephritis Antigen Like 1 (TINAGL1) | −2.94 | 3.18E-06 | 0.005377 |
| Nuclear Protein 1, Transcriptional Regulator (NUPR1) | 2.16 | 3.51E-06 | 0.005377 |
| C-X-C Motif Chemokine Ligand 8 (CXCL8) | 3.24 | 3.73E-06 | 0.005376 |
| Norrie Disease Protein (NDP) | 7.69 | 8.39E-06 | 0.011078 |
| ADCYAP Receptor Type I (ADCYAP1R1) | 7.50 | 1.65E-05 | 0.018633 |
| Long Intergenic Non-Protein Coding RNA 1474 (LINC01474) | 4.91 | 2.44E-05 | 0.025806 |
| Dual specificity protein phosphatase 2 (DUSP2) | 1.55 | 2.76E-05 | 0.026676 |
- Note: Genes highlighted green represent DEGs upregulated in LNG resistant cell lines. Genes highlighted red indicated DEGs downregulated in LNG resistant cell lines.
3.2 3.2 PPI network construction and hub genes screening
The STRING network was adopted to produce a PPI of the 218 protein-coding DEGs using the threshold value of confidence > 0.4 and connectivity degree ≥ 1. If a protein has a high degree in a PPI network, it will be defined as playing a critical role in the whole module. 94 nodes were removed from the PPI network due to having no edges (direct connections). This PPI network contains 124 nodes with 209 edges and has a PPI enrichment value of <1.0e-16. Cytoscape software was used for visual representation and analysis of the STRING PPI network (Figure 4A). The color of the node represents the FDR of the gene, with the darkest purple representing the lowest FDR. The width of the node border represents the connectivity degree, with the thickest border representing the highest degree of connectivity and the width of the edge displays the combined score.
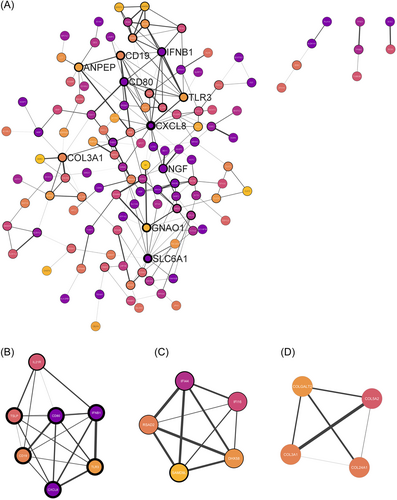
Cytoscape software CytoHubba was used to identify the top 10 nodes ranked by the degree of connectivity. Hub genes are shown with larger offset labels. The top 10 hub genes according to the degree of connectivity can be seen in Table 3. Cytoscape software MCODE was used to identify clusters of highly connected proteins in the PPI network. MCODE clusters were identified according to a Node score cut-off of 0.2 and K score of 2. A total of 3 MCODE clusters with a score > 4 were identified. Cluster one contained 7 nodes and 19 edges and had an MCODE score of 6.33 (Figure 4B). Cluster one contained 5 of 10 Hub genes. Cluster two contained 5 nodes and 10 edges and had an MCODE score of 5.0 (Figure 4C). Cluster three contained 4 nodes and 6 edges and had an MCODE score of 4.0 (Figure 4D).
| Hub gene | Degree of connectivity | LogFC | p Value |
|---|---|---|---|
| CXCL8 | 16 | 3.24 | 3.73E-06 |
| SLC6A1 | 13 | 4.57 | 0.0001 |
| GNAO1 | 11 | 2.52 | 0.0406 |
| IFNB1 | 10 | 8.01 | 9.15E-05 |
| CD80 | 10 | 7.92 | 3.10E-06 |
| CD19 | 10 | −2.59 | 0.0264 |
| TLR3 | 9 | 3.46 | 0.0335 |
| NGF | 8 | 3.04 | 0.0003 |
| ANPEP | 8 | 2.71 | 0.0354 |
| COL3A1 | 8 | 3.13 | 0.0265 |
3.3 Functional enrichment analysis
Overrepresentation analysis was used to investigate the relationship between the DEGs and GO terms. Three categories of GO terms including BP, CC, and MF were generated. The top broad GO terms in genes upregulated and genes downregulated in LNG resistant EC cells according to percentage of gene sequences involved can be seen in Supporting Information: Table 3–4. GO terms can also be more specific. While these terms are represented by a lower percentage of the genes, the terms may give us more insight into the mechanism of LNG resistance in these cells. The results of specific overrepresentation analysis can be seen in Supporting Information: Table 5–7. GO terms are ranked by ascending order of the –Log (p-value). A GO Chord plot displaying the relationships between the GO terms, the top 15 DEGS and the top 10 HUB genes can be seen in Figure 5.

3.4 Validation of top DEGs in LNG resistant cell lines using RT-qPCR
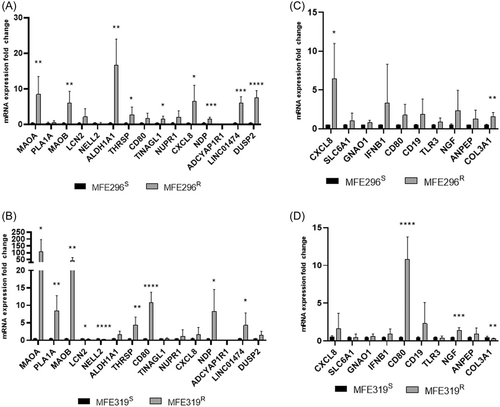
RT-qPCR was used to validate the top 15 DEGs in LNG resistant and sensitive EC cell lines (MFE296S+R, MFE319S+R). Relative mRNA expression of MAOA, MAOB, ALDH1A1, THRSP, TINAGL1, CXCL8, NDP, LINC01474 and DUSP2 was significantly upregulated in MFE296R in comparison to MFE296S cells (p = 0.0070, 0.0051, 0.0012, 0.0460, 0.0448, 0.0386, 0.0005, 0.0001, 0.00004, respectively) (Figure 6A). Relative mRNA expression of MAOA, PLA1A, MAOB, LCN2, NELL2, THRSP, CD80, NDP, LINC01474 was significantly upregulated in MFE319R in comparison to MFE319S cells (p = 0.0234, 0.0034, 0.0065, 0.0271, 0.00002, 0.0052, 0.00005, 0.0252, 0.0456) respectively) (Figure 6B)
3.5 Validation of top 10 HUB genes in LNG resistant cell lines using RT-qPCR
RT-qPCR was used to validate the top 10 hub genes in LNG resistant and sensitive EC cell lines (MFE296S+R, MFE319S+R). Relative mRNA expression of CXCL8 was significantly upregulated in MFE296R in comparison to MFE296S cells. COL31A was significantly downregulated in MFE296R in comparison to MFE296S cells. (p = 0.0386, 0.0022) respectively (Figure 6C). Relative mRNA expression of CD80, NGF and COL31A were significantly upregulated in MFE319R in comparison to MFE319S cells (p = 0.00005, 0.0006, 0.0041) respectively (Figure 6D).
3.6 Validation of top DEGs and HUB genes in LNG resistant cell lines using Western blot analysis
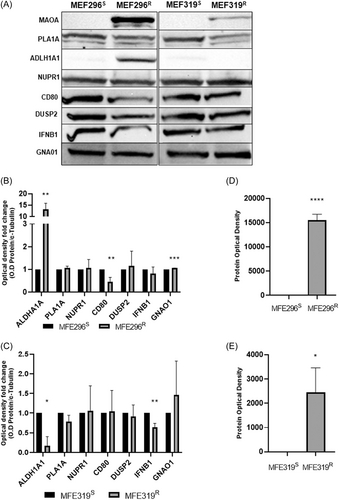
Western blot was used to validate the top 10 DEGs and 5 hub genes chosen according to the literature in LNG resistant and sensitive EC cell lines (MFE296S+R, MFE319S+R). The optical density of each protein band was derived and normalised to a loading control (α-Tubulin) (Supporting Information: Figure 1) TO give the relative optical density. The optical density fold change was then calculated for each protein. Where the matched sensitive protein expression was 0, results are shown as raw protein optical density. Representative western blot images can be seen in (Figure 7A). Protein expression of CD80 was significantly decreased (p = 0.0099) and protein expression of ALDH1A1 (p = 0.0015) and GNAO1 (p = 0.0001) was significantly increased (Figure 7B) (p = 0.0006) in MFE296R cells compared to MFE296S cells. Protein expression of IFNB1 (p = 0.0033) and ALDH1A1 (p = 0.0305) (Figure 7C) was significantly decreased in MFE319R cells compared to MF319S cells. The raw protein optical density (Figure 7D) of MAOA (p = 2.23 E-05) was significantly increased in MFE296R cells compared to MF296S cells. The raw protein optical density (Figure 7E) of MAOA (p = 0.0138) was significantly increased in MFE319R cells compared to MFE319S cells. Protein expression of MAOB, LCN2, ADCYAP1R1 and CD19 and CXCL8 was not detected in either cell line.
4 DISCUSSION
The incidence of early stage EC is increasing at a rapid rate globally. As a result of this, research into the use of the LNG-IUS as treatment for EC has been progressively expanding and the LNG-IUS is being increasingly utilized as conservative management of the disease clinically. However, the LNG-IUS is still only effective in 1 in 3 people.7-10, 20, 21 An understanding of the LNG resistance mechanism alongside identification of potential biomarkers that could predict response to this treatment would aid in the certainty of recommendation. While both molecular and clinicopathological predictors of response have been investigated in this context,12 there are still no clinically utilized predictive biomarkers to date. This study aimed to carry out transcriptomic data analysis on LNG resistant and matched sensitive early-stage EC cell lines and present potential mechanisms of LNG resistance to ultimately aid in identifying potential predictive biomarkers for LNG-IUS treatment of EC. To our knowledge, the current study is the first study that has used RNA sequencing to identify potential predictive biomarkers for LNG-IUS treatment of EC. The use of a non-biased discovery biomarker approach is the main strength of this study. RNA sequencing plays an essential role in the understanding of the genome as a whole13 and allows for the no-biased identification of genetic signatures that can predict response to certain drugs.22 RNA sequencing is rapid, precise and has high sensitivity which allows for detection of low abundance transcripts.23 By using a discovery based approach, we were able to identify novel genes that may be implicated in LNG resistance.
Prognostic genetic signatures of cancer patients are well utilized in both clinical and experimental oncology. More recently, prognostic signatures are being used to distinguish responders from non-responders in the cancer treatment pathway to create a more streamlined, personalized treatment approach. Drug resistance is a multifaceted biological issue with drug metabolism and excretion all contributing to its development. Alongside this, molecular factors such as genetic alterations, enzyme activity, and the breakdown of vital physiological functions such as DNA repair, apoptosis and drug efflux mechanisms contribute to drug resistance.24 Resistance to progesterone in EC is not widely understood, however, has been linked to imbalances of expression of hormone receptors, abnormal or sustained expression of epidermal growth factor receptors (EGFR) and its associated downstream pathways, mRNA down regulation of progesterone receptor (PGR)-subtype A or increased expression of PGR protein.25 Research around the role of the PGR as a predictive biomarker for LNG-IUS treatment of EC has conflicting results, with some studies showing low expression is related to a negative response, and others showing expression has no relationship to response.12, 26
One of the largest-scale transcriptomic based studies done to date on the topic conducted by Li et al., carried out microarray analysis on a medroxyprogesterone acetate (MPA) (synthetic progestogen) and investigated DEGs that were co-expressed with the PGR.26 No DEGs identified in the Li et al., study were statistically significant in the current study. Yang et al., conducted a study using the GSE121367 data set from Li et al.26 Yang et al. identified MSX1 as a gene that could that could predict MPA response based on its degree of connectivity in a PPI network, expression in EC tumor tissue, prognostic value and methylation status.27 The current study does not observe the same result. The disparity in results is not unsurprising as Li et al. exclusively investigated genes co-expressed with the PGR and both studies investigated MPA resistance rather than LNG resistance. We previously characterized the LNG resistant cell lines used in the current study, and investigated potential predictive biomarkers of LNG resistance found in the literature. KLF4 and SATB2 were identified as significantly differentially expressed between LNG resistant and non-resistant EC cell lines.14 It is important to note that these genes did not appear in the top significant DEGs in the current study. We did however, observe a nonsignificant increased FC in KLF4 in both cell lines. SATB2 did not appear in the top 1000 DEGs output. While this is unexpected, RNAseq data frequently yields conflicting results when validating using RT-qPCR. These disparities can be explained by the targeted vs global investigative approach alongside the increased stringency when correcting for multiple tests with RNAseq data, which can reduce the ability to detect true differences.
The current study identified 270 DEGs using p < 0.05 and logFC < 2 as a cut-off criteria. The most statistically significant genes were selected for validation with RT-qPCR and Western blot analysis. Fifteen genes were significantly differentiated according to FDR < 0.05 and logFC < 2. Relative mRNA expression of MAOA, MAOB, THRSP, CD80, NDP, LINC01474, DUSP2 and CXCL8 was significantly upregulated in both LNG resistant EC cell lines compared to their sensitive counterparts. Proteins were chosen for validation based on the differential expression data, their clinical relevance in the literature and availability of antibodies for western blot analysis as this study identified novel genes in LNG resistance. Protein expression of MAOA was significantly upregulated in both LNG resistant EC cell lines in when compared to their sensitive counterparts.
Increased presence of EC stem cells (SC) or side population (SP) cells has been proposed as a mechanism of progesterone resistance. SP EC cells have been previously shown to have decreased levels of apoptosis and increased growth inhibition in the presence of MPA.25 De-differentiation of EC cells and increased stemness leading to a decrease in apoptosis may be a mechanism of resistance as we see increase in EC SC markers such as CD55, CD44,28 ABCG229 and ALDH1A130 in the current study. Furthermore, we showed that ALDH1A1 was significantly upregulated in MFE296 LNG resistant cells. This gene codes the key ALDH isozyme linked to SC populations and is an important contributor to SC function in cancers.30 Monoamine oxidase A (MAOA) and Monoamine oxidase B (MAOB) were identified as significant DEGs in the current study and have previously been investigated for their role in cancer SC expression, particularly in prostate cancer. Liao et al.31 observed a significant decrease in SC markers OCT4 and NANOG in MAOA knockout (KO) mice alongside a reduced population of CD44+, α2β1+, and CD133 + SCs in MAOA knock down prostate cancer cells compared to wild type (WT) cells. Decreased expression of MAOB has also been related to decreased cancer SC expression.32 Yin et al. found a significant decrease in SC marker expression in the basal cells of MAOA/MAOB KO mice in relation to WT. Furthermore, in MAOA/MAOB knock down cultured prostate epithelial cells, Yin et al., observed a smaller CD133+/CD44+/CD24- SC population than WT cells alongside a reduction of SC markers such as ALDH1A1, TROP2, and CD166.32 While this has not yet been investigated in EC cells, the role of MAOA and MAOB in cancer SC development may still be a significant driver of LNG resistance.
Altered immune response plays a critical role in the development and progression of cancer. In our study, 6 of the 10 hub genes identified in the PPI network are proteins involved in the immunoregulatory system. Alongside this, all 3 MCODE clusters contain immune associated proteins. The 6 hub genes CXCL8, IFNB1, CD80, CD19 and TLR3 play varying roles in the immune system including chemotaxis, T cell activation, B cell regulation and development, innate immunity and dendritic cell regulation. Two of these genes, C-X-C motif chemokine ligand 8 (CXCL8) and Cluster of differentiation 80 (CD80) were also listed in the top 15 DEGs according to FDR < 0.05. Immune modulators have been previously implicated in the development of drug resistance through their strong correlation to tumorigenic progression of many cancers.33 It has been proposed that the increased immune infiltration in the tumor microenvironment creates refuge for cancer cells and protects them from cytotoxic stimuli, often leading to better treatment outcomes.34 The CXCL8 gene encodes a proinflammatory chemokine that has been previously identified as elevated in EC35 and is also significantly upregulated in LNG resistant EC cells in this study. CXCL8 promotes immune infiltration and angiogenesis through acting on the CXCR1 and CXCR2 receptors of leukocytes and endothelial cells, establishing a gateway for cancer cell metastasis.36 Progesterone is a well-recognized suppressor of the endometrial inflammatory response.37 In particular, the use of LNG-IUS has been observed to significantly increase immune modulators including CXCL8 and T cells in the endometrium of healthy people.38
5 CONCLUSION
The identification of predictive biomarkers to guide conservative treatment of early stage EC is essential due to the rising incidence of disease in younger people. A predictive signature comprised of genes or proteins implicated in progesterone resistance will be the most appropriate form of biomarker to aid in the EC conservative treatment pathway clinically. This study has presented suitable predictive biomarker candidates such as MAOA, MAOB, ALDH1A1, CXCL8 and CD80 that may be implicated in a multitude of drug resistance mechanisms such as dedifferentiation and immunostimulation. These markers warrant further investigation in both translational and clinical settings.
AUTHOR CONTRIBUTIONS
Molly Dore, under the supervision of Claire Henry and Sara Filoche carried out all differential expression analysis, functional analysis and in-vitro experiments. Molly Dore analyzed and interpreted the data. Ngonidzashe Faya carried out quality assessment, filtering, genome alignment and provided feedback on bioinformatic analysis carried out by Molly Dore. Molly Dore was the major contributor to the preparation of the manuscript. Claire Henry made substantial contributions to the conception and design of the study. Sara Filoche advised on the design of the study and provided manuscript feedback. All authors read and approved the final manuscript.
ACKNOWLEDGMENTS
We acknowledge the Gynecological Cancer Research Group at the University of New South Wales, Sydney, Australia for gifting the MFE296 and MFE319 cell lines. We Acknowledge the Australian Genome Research Facility for facilitating the transcriptomic sequencing part of this paper. We acknowledge Genomics Aotearoa for their support with the Bioinformatic analysis, and the Department of Obstetrics, Gynecology and Women's Health at the University of Otago, Wellington. This research has been funded by the Health Research Council of New Zealand and a University of Otago Research Grant. Open access publishing facilitated by University of Otago, as part of the Wiley - University of Otago agreement via the Council of Australian University Librarians.
CONFLICT OF INTEREST STATEMENT
The authors declare no conflict of interest.
Open Research
DATA AVAILABILITY STATEMENT
The datasets generated during and/or analyzed during the current study are available from the corresponding author on reasonable request.


