Formation of Three-Dimensional Polysuccinimide Electrospun Fiber Meshes Induced by the Combination of CaCl2 and Humidity
Abstract
Even though electrospinning is getting more and more attention, the preparation of 3D nanofibrous meshes is still a big challenge that limits the application of electrospun materials, especially in tissue engineering. To overcome this problem, several solutions are introduced but most of them focus on the postprocessing of the electrospun meshes. This paper presents a straightforward novel method that utilizes the joint effect of the addition of CaCl2 and the relative environmental humidity (RH), which can induce the random 3D formation of polysuccinimide (PSI) electrospun fibers with different such as wrinkled or ribbon-like structures. Although the effect of humidity and inorganic salt additives on the micro and macrostructure of electrospun fibers is known, the connection between the two in this manner has never been presented. To investigate the effect, fibers with different PSI and CaCl2 concentrations at different humidity RH levels are prepared, and their microstructure is visualized with high-resolution scanning electron microscopy (SEM). To reveal the nature of the interaction between the polymer and the CaCl2, Fourier-transformed infrared (FTIR), X-ray diffraction (XRD), and thermogravimetry (TGA) measurements are carried out and 3D nanofibrous structures are obtained.
1 Introduction
Electrospinning is one of the most versatile and flexible fiber-forming techniques that can be used in various fields such as tissue engineering, biosensors, air filtration, wound dressings, or drug delivery.[1-5] Since scientific knowledge has drastically increased over the last decades, electrospun fibers can be produced with different physical and chemical structures in a wide range of diameters. Besides, new types of electrospinning equipment have also been developed at an industrial scale which further widened the possible application of electrospun meshes.[6-8]
During electrospinning, a polymer solution or melt is introduced into a high electric field. The solution is pumped through a metal capillary needle, while a grounded metal collector is placed in front of it. Due to the created electrostatic force, thin polymer jet(s) emerge with a whipping motion and travel toward the grounded collector where solid fibers are collected. Since electrospinning is a highly complex method with various tunable parameters (for example, voltage, volumetric flow rate, conductivity, viscosity, temperature, and humidity) affecting each other, finding the right setting for a specific application is quite challenging and requires high effort, especially for newly applied materials.[9, 10] As a consequence, novel impacts of the parameters on the micro and macrostructure are still being revealed.
One of the main limitations of electrospinning is that meshes can be mainly produced in a 2D manner on a planar collector, which limits their application in several fields, especially in tissue engineering.[11] To overcome this limitation, several solutions have been introduced to produce 3D fibrous macrostructures. These approaches can be subdivided into two main classes, including direct preparation methods, such as multi-layer, sacrificial agent, and wet electrospinning, as well as 3D collector design, and post-processing of the meshes, such as gas foaming, ultrasonication, and short-fiber assembly.[2] In the case of direct preparation, the proper setup of the environmental conditions, such as the relative environmental humidity (RH), as well as the choice of the proper additive, for example, inorganic salts, can be crucial to achieving the required 3D macrostructure.
Adding inorganic salts to the solution increases its conductivity leading to a higher surface charge. Due to this, the inorganic salt can facilitate the 3D deposition of the fibers on a flat grounded collector. When the jet arrives at the oppositely charged collector, the fibers will be discharged thus reducing the attraction between the collector and fibers. Afterward, the collector may recharge the fibers, resulting in electrostatic repulsion between the fibers.[12] Then the growth of the fiber structure on the collector screen can cause a rapid solidification of the fibers, which contributes to maintaining the 3D shape.[13]
Another key factor can be the RH to produce 3D electrospun fibrous meshes since it can affect fiber solidification and influence solvent evaporation.[14] Cheng and co-workers demonstrated that RH can affect both the orientation and the structural homogeneity of cellulose acetate fibers.[15] In another work, Kim and co-workers demonstrated that high humidity (<90%) can cause quick solvent evaporation during electrospinning leading to the formation of a 3D electrospun poly(vinylidene fluoride) structure.[16] Moreover, high RH can lead to porous fibers as small droplets of water generate phase separation in the jet. Additionally, it also affects the orientation, as well as the microstructure of the fibrous meshes.[17-19] Even though both inorganic salt and high RH can lead to the formation of 3D electrospun meshes, the relation between the two parameters has never been demonstrated and investigated yet.
The main goal of this study is to demonstrate the joint effect of RH and CaCl2 on the micro and macrostructure of polysuccinimide (PSI) electrospun meshes. PSI and its derivatives are promising biodegradable and biocompatible polymers, thus biomedical applications, such as scaffold materials in the field of tissue engineering, have been demonstrated over the last several years.[20, 21] Our group has already demonstrated that PSI and PSI derivatives can be applied in electrospinning effectively[22, 23] and used in the medical field,[24, 25] as well as the addition of inorganic salts induces 3D fiber formation.[26] Based on that study, in the current paper, we demonstrate that the addition of CaCl2 into the precursor solution itself is not sufficient to obtain 3D PSI electrospun meshes but RH is also a key factor in this process. To investigate the joint effect on the micro- and macrostructure, we prepared electrospun PSI fibers at different RH levels (35–65%) with different CaCl2/PSI ratios and concentrations. The microscopic structure of the fibers was revealed by high-resolution scanning electron microscopy (SEM). We carried out Fourier-transformed infrared spectroscopy (FTIR), X-ray diffraction (XRD), and thermogravimetric analysis (TGA) to investigate the relation between CaCl2-humidity-PSI on a molecular level.
2 Experimental Section
2.1 Materials
l-aspartic acid (≥98%, Sigma) and o-phosphoric acid (≥99%, Sigma-Aldrich) were used in PSI synthesis. N,N-dimethylformamide (≥99.5%, Fisher Scientific), and CaCl2 (≥ 99.0%, Reanal) were used in the electrospinning.
All chemicals were used during the experiments without further purification.
2.2 Preparation of the Electrospun Meshes
In the first step, PSI was synthesized according to the previously published process[24, 26] and used to generate fiber meshes. Table 1 shows the composition of the different PSI solutions used in electrospinning.
| Sample name | PSI [g] | CaCl2 [g] | DMF [g] | Applied voltage [kV] |
|---|---|---|---|---|
| 20%PSI | 0.2 | – | 0.8 | 14 |
| 22.5%PSI | 0.225 | – | 0.775 | 14.5 |
| 25%PSI | 0.25 | – | 0.75 | 15 |
| 20%PSI/5%CaCl2 | 0.2 | 0.05 | 0.75 | 15.5 |
| 20%PSI/7%CaCl2 | 0.2 | 0.07 | 0.73 | 16 |
| 22.5%PSI/3%CaCl2 | 0.225 | 0.03 | 0.745 | 16 |
| 22.5%PSI/5%CaCl2 | 0.225 | 0.05 | 0.725 | 16.5 |
For electrospinning, two devices were used: a homemade one connected to a fume hood and a Spincube (Spinsplit, Hungary) type compact device with a built-in power supply and sensors for measuring RH and temperature to achieve high RH. The homemade device included a Genvolt 73030P (Genvolt Ltd., Shropshire, United Kingdom) type high-voltage DC power supply together with a KDS 100 (KD Scientific Inc., Holliston, USA) type syringe pump. The distance between the needle and the collector was always set to 15 cm and the volumetric flow rate was 1 mL h−1. The RH and temperature were measured with a Testo 610 manual hygro and thermometer (Testo Ltd., Alton Hampshire, United Kingdom) within the electrospinning chamber of the homemade device. The humidity was controlled between 35% and 65% relative humidity level by using a Trotec B7E ultrasonic humidifier (Trotec, Heinsberg, Germany). Silica gel was put into the electrospinning device to achieve a low relative humidity level. The applied voltages during electrospinning are summarized in Table 1.
2.3 Scanning Electron Microscopy
For SEM, pieces of fiber samples were placed on metal studs with carbon-loaded double-sided tape and conductive silver paint. In the case of insulating samples (such as polymers), the coating was necessary to perform high-resolution imaging. Here, the samples were carbon coated (thickness of about 200 Å) using an AUTO 306 carbon evaporator (BOC Edwards, West Sussex, United Kingdom). Observations were performed with a JEOL JSM 7800F LV field emission SEM (JEOL, Akishima, Tokyo, Japan). Secondary electron images were acquired with an accelerating voltage of 2 keV, a low probe current value, the smallest objective lens aperture, and a working distance of 10 mm to limit polymer degradation. The determination of the average fiber diameter was carried out by the ImageJ program (Figure S1, Supporting Information). The diameter of 100 fibers was measured from at least three different images with a magnification of 5000× or 2500×, from which the average of the diameters, as well as the standard deviation, were calculated.
2.4 Conductivity Measurement
Conductivity measurements were carried out for two different purposes. First, the CaCl2 content of the fibrous meshes was determined by measuring the CaCl2 release from the meshes with a Mettler–Toledo SevenCompact Duo S213 Benchtop pH/Conductivity meter (Mettler-Toledo, Switzerland). After weighing the samples, it was immersed in 20 mL of distilled water and stirred at 100 rpm with an IKA RCT basic magnetic stirrer (IKA-Werke GmbH & Co., Staufen, Germany). The conductivity was measured every 10 min in the first hour, after that, once every hour until it reached saturation. Second, the precursor polymer solutions used for electrospinning were measured with the same equipment to determine the effect of the salt concentration on the conductivity.
2.5 Viscosity Measurement
To measure the viscosity of the precursor solutions, an SV-10 Sine-wave Vibro-type vibrational viscometer was used (A&D Company Ltd, Japan). The precursor solutions were loaded into a cuvette which was thermostated at 25 °C (similar to the temperature applied during electrospinning). The equipment measured viscosity by detecting the electric current necessary to resonate the sensor plates at a constant frequency of 30 Hz and amplitude of less than 1 mm. The measurement was carried out until the viscosity remained constant.
2.6 Determination of the Pore Size Distribution Based on SEM Image Analysis
The pore size determination was carried out by analyzing the SEM images with 2500× magnifications by using ImageJ based on the protocol published by Hojat et al.[27] First, the Set Scale tool was used to establish an accurate measurement scale for the image. Then, a cropping was performed to eliminate the bottom information band. The Window/Level tool was then applied to optimize the brightness and contrast ratios. Following this, the Threshold tool was employed to identify the specific intensity range (55–65%) that retained focused fibers while eliminating background elements. After thresholding, the Make Binary tool facilitated the conversion of the image to binary, which was then inverted to make fibers black against a white background. Finally, the Analyze Particle tool was employed to create fiber outlines and define the inter-fiber spaces. The presence of small fibers prevented the use of Erode or Dilate tools, resulting in artifacts resembling small pores. To mitigate these artifacts, the Z-Scoring method was applied, with a defined threshold of 0.05 points to provide accurate results. Statistical evaluation of the pore size data was carried out using the Mann–Whitney U test. A difference was considered statistically significant if p < 0.05.
2.7 Confocal Microscopy Measurement
To demonstrate the 3D structure of the fibrous matrices on a microscopic level, the autofluorescence property of PSI[20] was measured by confocal microscopy. The Z-stack measurements were carried out by Nikon Eclipse Ti2 Inverted Research Microscope (Nikon, Japan) with a 20× objective. The 3D images were taken by the Abberior Imspector software and processed by the ImageJ program. To create 3D images, first, the Window/Level tool was applied to optimize the brightness and contrast ratios of each stack. Afterward, the Smoothing plugin was used and Gaussian smoothing with sigma = 1 was applied. The 3D images were constructed by 3Dviewer plugin.
2.8 Attenuated Total Reflectance Fourier-Transformed Infrared Spectroscopy
The measurements were conducted with a Jasco FTIR-4700 spectrometer with an ATR PRO ONE Single-Reflection Diamond head (Able&Jasco, Japan). The wavenumber range was 4000–400 cm−1, the resolution was 2 cm−1, and every spectrum was calculated from the average of 128 scans. Before every sample, the background was measured to get a more accurate spectrum. The results were evaluated by using the Jasco Spectra Manager program, by applying baseline, ATR head correction, and means-movement smoothing.
2.9 Thermogravimetry Measurement
TGA spectra of the electrospun meshes and powder mixtures were carried out by using a TGA Q500 thermogravimeter (TA instruments, USA). The tests were carried out on samples with a mass of ≈5 mg between 30 and 700 °C at a heating rate of 10 °C min−1 under nitrogen purge flow (60 mL min−1).
2.10 X-ray Diffraction Measurement
XRD studies were performed using a D8 Advance type diffractometer (Bruker AXS, Karlsruhe, Germany) with a Cu-Kα cathode (λ = 1.54 Å) operating at 40 mA current and 40 kV voltage. The collection of data has been performed by a LYNXEYE XE-T type linear detector. The scan rate was 4.8° min−1 with a scanning step of 0.02° in the 2Θ range of 5° to 75°.
2.11 Statistical Analysis
Statistical evaluation of the fiber diameter data was carried out using the Kruskal–Wallis nonparametric ANOVA followed by a median test. A difference was considered statistically significant if p < 0.05.
For the presentation of the effect of different factors “The Design & Analysis of Experiments: Central composite, non-factorial, surface designs” was used by Statistica 14.0.1.25 (Copyright 1984–2020 TIBCO Software Inc.). The dependent factor was the diameter (µm), while the independent factors were humidity (%), and the CaCl2/PSI (m/m) ratio.
3 Results and Discussion
3.1 Effect of the Polymer Concentration on the Microstructure and Diameter of the Fibers
The SEM images in Figure 1 show the dependence of the fiber morphology on the PSI concentration.
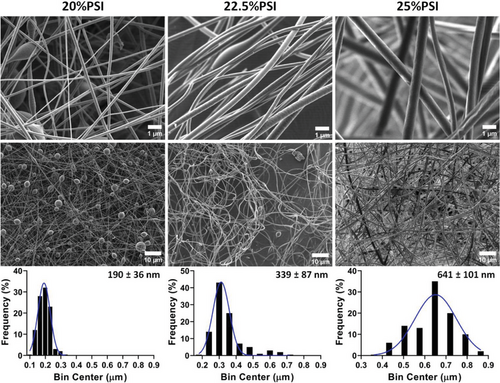
As the results show, the PSI concentration highly influences both the microstructure and the average diameter of the electrospun fibers. Significant bead formation can be observed on the SEM image at 20 w/w% PSI concentration, but the increase in the PSI concentration eliminated these structural artifacts (Figure 1). On the other hand, the increase in the PSI concentration resulted in a higher average fiber diameter and a wider diameter distribution which differences proved to be significant according to the statistical analysis (Table 2). These effects can be explained by the higher viscosity of the precursor polymer solution since the polymer concentration has no noticeable effect on the conductivity. These tendencies correlate well with the literature data about the precursor solution viscosity's effect and the previous findings related to PSI fibers.[28]
| PSI concentration [w/w%] | Viscosity [mPas] | Conductivity [µS cm−1] | Avg. fiber diameter [nm] |
|---|---|---|---|
| 20 | 203 ± 29 | 6.3 ± 1.2 | 190 ± 36a) |
| 22.5 | 480 ± 25 | 6.5 ± 0.9 | 339 ± 87a) |
| 25 | 985 ± 85 | 6.2 ± 1.1 | 641 ± 101a) |
- a) significant difference (p < 0.05) between PSI concentrations.
3.2 Effect of the CaCl2 Concentration on the Micro and Macrostructure of the Electrospun Meshes
To investigate the effect of the concentration of CaCl2 at different polymer concentrations, consistent ambient RH (48–55%) and electrospinning parameters were used. Adding CaCl2 to the 25 w/w% PSI solution drastically increased the viscosity and induced gelation, thus fiber formation could not be carried out. Therefore, the effect of CaCl2 on the fiber formation, as well as on the micro and macrostructure of the fibers was investigated only at 20 and 22.5 w/w% PSI concentration. SEM micrographs were used to present the morphological changes, while the macroscopical appearance of the samples was demonstrated by photos taken directly after electrospinning (Figure 2).
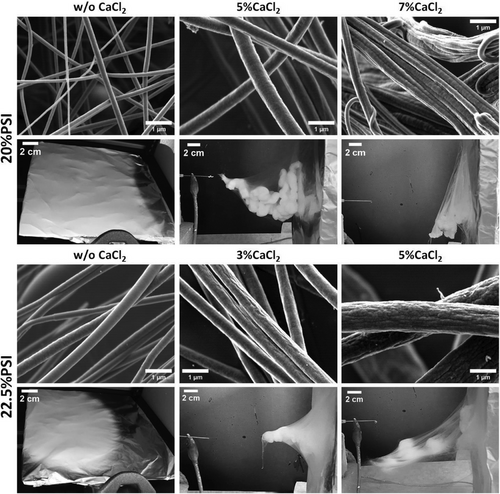
As the SEM images show, introducing CaCl2 to the PSI solutions resulted in mostly homogenous fibers and significantly reduced the bead formation in the case of 20 w/w% PSI concentration, especially at 5% CaCl2 (Figures 1 and 2 and Figure S2, Supporting Information, and Table 3). The stabilization effect of the salt can be explained by the enhanced conductivity of the precursor solution. Adding salt to the polymer solution increases the charge density on the polymer and the surface of the polymer jet; therefore, the electrostatic force pulling the jet toward the collector is higher. This causes a higher elongation of the polymer jet which can eliminate the bead formation.[29, 30] Besides this effect, the presence of CaCl2 increased the viscosity of the precursor solution, which resulted in a higher average fiber diameter in almost all the cases (Table 3). Furthermore, at the conditions where a 3D mesh formation was induced by CaCl2, the concentration of the salt did not have a significant effect. However, the effect of the concentration of CaCl2 on the microscopic and macroscopic structures of the samples proved to be slightly different in the case of the two PSI concentrations. At 20 w/w% PSI concentration, adding CaCl2 at 5 w/w% concentration resulted in homogenous fibers with smooth surfaces and higher average fiber diameter, while adding 7 w/w% CaCl2, the average fiber diameter decreased. However, we can observe on the SEM images (Figure 2 and Figure S2, Supporting Information) that the higher CaCl2 concentration induced significant changes in the microstructure of the PSI mesh. Several fused fibers can be observed. Furthermore, big spherical blobs appeared that also contained several fused fibers, which change made the determination of the fiber diameter challenging (Figure 2 and Figures S2 and S3, Supporting Information). This change can be explained by the slow gelation of the precursor solution, which mainly occurred during fiber formation. This gelation can be explained by the complex formation between the C═O group of the PSI molecules and the Ca2+ ions, which becomes more significant at higher CaCl2 concentrations.[31, 32] At 22.5 w/w% PSI concentration, 5 w/w% of CaCl2 increased the average fiber diameter and resulted in a wider distribution (Figure S3, Supporting Information) compared to 3 w/w%, which can be explained by the higher viscosity.[33] He et al. experienced a similar effect in the case of the electrospinning of polyvinylidene fluoride nanofibers at different FeCl3 concentrations.[34] At this composition (22.5%PSI/5%CaCl2) the gelation did not occur.
| PSI concentration [w/w%] | CaCl2 concentration [w/w%] | Viscosity [mPas] | Conductivity [µS cm−1] | Avg. fiber diameter [nm] |
|---|---|---|---|---|
| 20 | 0 | 203 ± 29 | 6.3 ± 1.2 | 190 ± 36a) |
| 5 | 374 ± 50 | 1349 ± 140 | 520 ± 75a), b) | |
| 7 | 814 ± 82 | 1130 ± 230 | 194 ± 59a) | |
| 22.5 | 0 | 480 ± 25 | 6.5 ± 0.9 | 339 ± 87a) |
| 3 | 833 ± 75 | 706 ± 78 | 532 ± 71a), b) | |
| 5 | 1090 ± 102 | 983 ± 92 | 1205 ± 294a), b) |
- a) significant difference (p < 0.05) to the closest CaCl2 concentration;
- b) significant difference (p < 0.05) to the 0 w/w% CaCl2 concentration.
Besides the change in the average fiber diameter, the addition of CaCl2 to the precursor solution affected the surface morphology of the fibers and induced wrinkled fiber formation, which is more significant at higher CaCl2 concentrations (Figure 2). The occurrence of the wrinkled fiber surface is explained by the formation of thin skin on the surface of the liquid jet, which collapses,[35] by the formation and collapse of droplets formed on the surface of the jet,[36] or by the phase separation on the surface of the polymer jet.[37] However, inorganic salt additives are able to precipitate on the surface of the fibers as was demonstrated in the case of nylon-6/GaCl3,[38] polyamide-6/CaCl2,[39] and chitosan/different salt fibers[40] resulting in amorphous surface structure. Pai and co-workers also demonstrated that the surface morphology of polystyrene fibers significantly depends on the relative humidity of the environment, and low humidity favors the formation of wrinkled fibers.[41]
The macroscopic appearance was also influenced by the concentration of CaCl2. As can be seen in Figure 2, at higher CaCl2 concentrations, the fibers were collected at a lower position than the spinning needle, which indicates heavier fibers than at lower CaCl2 concentrations. This can be explained by the higher density of the CaCl2 compared to the PSI. Higher CaCl2 concentrations induced gelation of the PSI solutions after a certain time which can also explain the microscopic and macroscopic inhomogeneities.
According to the previous observations and the literature, CaCl2 and PSI concentration, their ratio are all crucial parameters, influencing the micro and macrostructure of the electrospun meshes. Furthermore, RH can influence these fiber properties which effect can be also more relevant when CaCl2 is present due to its strong interaction with vapor water. For a better understanding of the effect of humidity and to exert the gelation effect, only 20%PSI/5%CaCl2 and 22.5%PSI/3%CaCl2 samples were used in the following experiments.
3.3 Effect of the Relative Humidity on the 3D Structure of Electrospun PSI/CaCl2 Fibers
In the previous experiment, we demonstrated that adding CaCl2 to the precursor solution induced 3D fiber formation regardless of the different PSI/CaCl2 ratios, and also affected the microscopic structure of the fibers. In this section, our intention is to demonstrate that the RH has an important role in 3D fiber formation, therefore fibers were produced at different RH levels and the obtained structures were analyzed (Figures 3 and S4, Supporting Information).
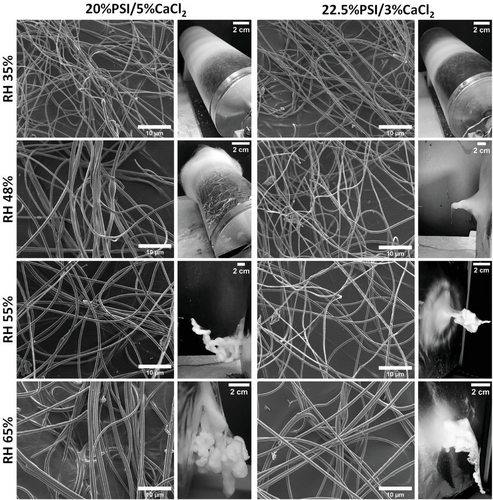
As the SEM images show in Figure 3, fibers have no defect at any RH level at the microscopic scale, but the effect of humidity has a high impact on the surface morphology and macroscopic structure of the meshes. Under 48% RH, there was no 3D formation of the meshes and the fibers obtained have smooth surfaces with constant diameters lengthwise. Above 48% RH, and if CaCl2 was added to the precursor solution, meshes started to grow out from the collector plane and formed a random 3D structure. According to the pictures, the higher RH caused a more robust 3D formation, and at some point, the meshes reached the tip of the needle (Video S1, Supporting Information). On the other hand, no 3D formation was experienced without adding CaCl2 to the precursor solution at any RH level (Figure S5, Supporting Information), which results indicate that interaction between the water in the vapor phase and CaCl2 can be crucial for 3D formation of electrospun PSI meshes.
The effect of both the humidity and inorganic additive on the 3D formation of electrospun meshes was already demonstrated in the literature, however, the connection between the two parameters has not been presented.[17, 42] Cheng et al. demonstrated that RH level significantly influences the macroscopic appearance of the cellulose acetate electrospun fibers. They experienced that under 50% RH, there was no 3D formation; furthermore, the increase of RH significantly influenced the macroscopic morphology of the meshes, which findings are in good correlation with our results.[15] Huang and co-workers presented similar results during the production of silk-fibroin fibers at low temperatures.[43] To produce 3D fiber macrostructures, inorganic or polymer additives are mainly used in the sacrificial agent strategies,[44] although few examples can be found where the mixture of polymer and inorganic precursor solution resulted in 3D inorganic nanofibrous scaffolds.[13, 45, 46]
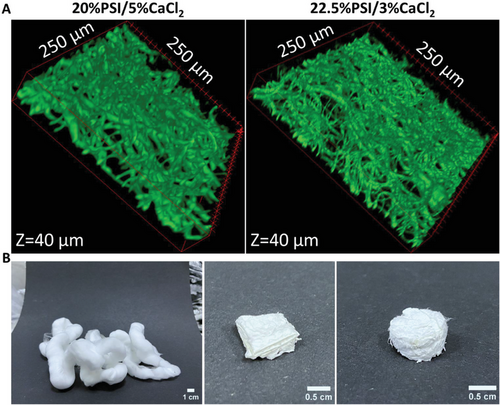
The microscopic 3D structure of the 20%PSI/5%CaCl2 and 22.5%PSI/3%CaCl2 fibrous matrices is demonstrated by using Z-stack images captured by confocal microscopy (Figure 4A). The images show the top 40 µm depth of the samples since at more depth no fluorescence signal was detected due to the scattering and absorption of the emitted photons. The images represent the loose structure of the fibers and show several voids between the fibers with a size of several tens of micrometers (Figure S6, Supporting Information), which is ideal for example biomedical applications in wound healing or tissue engineering.[11] As we represent in Figure 4B, the random structure of the fibrous matrix can be shaped according to the final application.
To determine the pore-size distribution of the samples and compare the 3D structure of the samples on a microscopic level, the SEM images were analyzed according to the protocol published by Hotaj and co-workers[27] (Table 4). The distribution of the pore sizes shows that each sample contains a high number of small pores (1–3 µm) and the number of the pores decreases by their size quasi exponentially (Figure S6, Supporting Information) similar to the literature data.[47, 48] The results show that the RH did not affect the pore size when CaCl2 was not applied during the electrospinning while RH showed a slight effect on the pore size when CaCl2 was mixed in the precursor solution (Table 4). In these cases at 48% RH level the mean, the median, and the maximum value of the pores were increased significantly according to the statistical analysis which is the consequence of the 3D mesh formation.[42]
| Sample | 20%PSI | 20%PSI/5%CaCl2 | 22.5%PSI | 22.5%PSI/3%CaCl2 | ||||
|---|---|---|---|---|---|---|---|---|
| RH | 35% | 48% | 35% | 48%* | 35% | 48%* | 35% | 48%* |
| Mean (µm) | 2.37 | 3.89 | 2.63 | 6.47 | 4.35 | 3.17 | 4.75 | 7.44 |
| Median (µm) | 1.49 | 1.08 | 1.39 | 3.17 | 2.4 | 1.85 | 1.99 | 3.17 |
| Max (µm) | 25.85 | 40.36 | 41.9 | 60.65 | 32.6 | 34.69 | 66.15 | 108.22 |
- * indicates the statistically significant difference to the lower RH value (p < 0.05).
3.4 Effect of the Relative Humidity on the Microstructure of Electrospun PSI/CaCl2 Fibers
The effect of the humidity on the microstructure and diameter distribution of electrospun polymer fibers is thoroughly investigated and presented in the literature,[17] but not in connection with salt additives. To demonstrate the effect of the humidity on the fiber diameter, its distribution, and the average fiber diameter were determined (Figure 5).
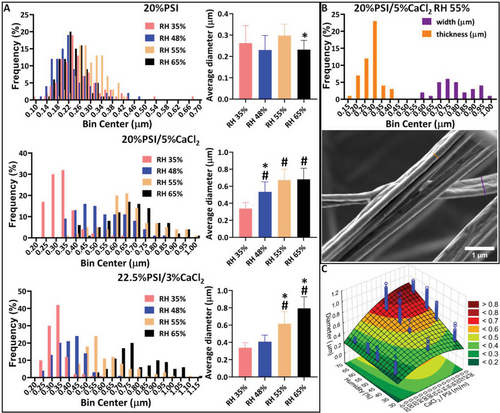
As the results show, the higher the humidity, the higher the average fiber diameter is (Figure 5A) in the case of both compositions of the precursor solution with CaCl2. However, distribution graphs show that at higher RH, the distribution of the fiber diameter is getting wider, and for example, in the case of the 22.5%PSI/3%CaCl2 two populations can be seen at 65% RH. On the other hand, if no CaCl2 was added to the precursor solution, the humidity did not show any influence on the average fiber diameter (Figure 5A) but higher RH significantly reduced the bead formation (Figure S5, Supporting Information). A similar effect on the bead formation was observed in the case of the electrospinning of poly(carbonate urethane),[49] polystyrene,[50] and poly(vinyl chloride) fibers.[50] Besides the fiber diameter, the humidity also had a high influence on the microstructure of the fibers containing CaCl2. As we described previously, the addition of CaCl2 induced the formation of wrinkled fibers (Figure 2), which effect proved to be RH dependent. Similar dependency on the RH was already described in the case of polyetherimide,[51] polyacrylonitrile,[52] and polycaprolactone fibers.[53] Besides, wrinkled fibers at 55% RH ribbon-like structure with a wrinkled surface were obtained, which was more relevant in the case of 20%PSI/5%CaCl2 (Figure 5B). This finding correlates well with the fact that humidity-induced change in the surface morphology of hydrophobic fibers was described between 40% and 50% RH.[17] These results indicate that the change in the surface morphology is caused by the non-solvent effect of the vapor water, which at a low RH level induces a wrinkled surface, and later on ribbon-like structure.[17] At a high RH, the solidification of the PSI fiber is significantly faster, which results in the complete solidification of the polymer jet therefore the fiber diameter also increases[54] (Figure 5A). According to these results, the joint effect of the humidity and CaCl2 is affecting both the macroscopic appearance of the fibers (3D structure) and the microscopic structure as well, since the crystallization and water adsorption of CaCl2 is highly humidity dependent. Abid et al. also described that the presence of a certain hydrophobic molecule, namely phenylalanine affects the size and structure of CaCl2 nanoparticles during crystallization from aerosol.[55] Our results and the previously mentioned finding highly indicate the interaction between the CaCl2 and vapor state water which can occur not just in crystal formation but also at a molecular level.
According to the surface design fitting and the statistical analysis (Figure 5C and Table S1, Supporting Information) the two independent factors, namely the CaCl2/PSI (m/m) and RH (%), show a significant linear effect (L) on the dependent factor, namely the fiber diameter (µm). Moreover, the interaction of the linear part of the two independent factors also significantly affects the fiber diameter. These are indicated by the low p-values which are lower than 0.05. By comparing the two independent factors with each other we can recognize that the quadratic factor (Q) of the CaCl2/PSI (m/m) has a significant effect on the fiber diameter while the Q factor of RH is not significant. This result indicates that the CaCl2/PSI (m/m) has a higher influence on the fiber diameter than the RH (Table S1, Supporting Information).
We also made an effort in the statistical analysis to investigate the effect of the PSI and CaCl2 content on the fiber diameter (Table S2, Supporting Information). This analysis proved that the linear effect of all the independent factors, as well as the interaction of the linear parts of the PSI content (%) and humidity (%) (1L by 3L), and CaCl2 (%) and humidity (%) (2L by 3L) on the fiber diameter, is significant. These results prove that both CaCl2 and RH are key elements in the fine-tuning of the microscopic structure of the PSI fibers and show a strong interaction between the parameters.
3.5 FTIR, TGA, and XRD Analysis of PSI/CaCl2 Fibers and Powder Mixtures with the Same Composition
Since CaCl2 proved to be crucial for the 3D fiber formation, we aimed to investigate the relationship between the polymer, CaCl2, and vapor water. At first, the presence of CaCl2 in the fibrous meshes was proved by measuring the release of the CaCl2 by conductometry (Figure S7, Supporting Information). As the results show, almost all of the CaCl2 was released from both samples after 2 h (20%PSI/5%CaCl2 96%, 22.5%PSI/3%CaCl2 82%) which results prove the successful incorporation of the CaCl2 into the PSI fibers.
To investigate the composition of the different fibers and the interaction between the water and CaCl2, FTIR spectroscopy (Figures 6A and S8, Supporting Information), XRD (Figure 6B), and TGA analysis were carried out (Figure 5C). FTIR measurement of dehydrated and hydrated CaCl2 shows that pure CaCl2 signals are very weak, and a small amount of water can cover the characteristic peaks of CaCl2. The peaks of the water at 1630 and 3250 cm−1 increased very quickly after the dehydration of CaCl2, which can be explained by the water absorbed from the air (Figure S8A, Supporting Information).
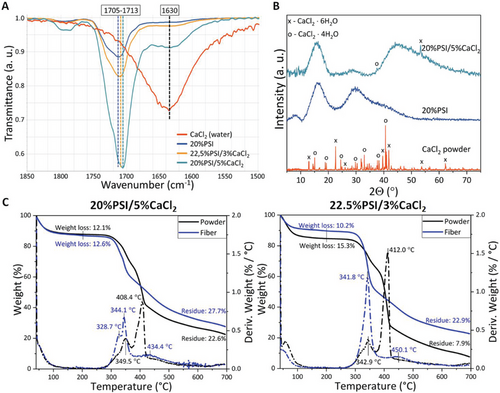
The appearance of the peak at 1630 cm−1 in every electrospun sample proves that all of the samples contain some water, and its quantity shows an increasing tendency with the CaCl2 concentration. If we compare the spectrum of the electrospun fibers with a mixture of the same components in powder form (Figure 6A and Figure S8B, Supporting Information), we can observe that the relative intensity of the water peak compared to the intensity of the peak at 1710 cm−1 is higher and it increases more with the concentration of the CaCl2 (Figure 6A). The peak at 1710 cm−1 peak represents the asymmetric vibration of the C═O group in the PSI. This means that the water content of the electrospun fibers is smaller than that of the same materials mixed together in a powder form, which indicates that the water content of the electrospun fibers may be found mainly in the crystalline state in CaCl2·XH2O. The other relevant difference between the spectra of the electrospun fibers and the powder mixtures is the exact position of the vibration peak of the C═O group at around 1713 cm−1. While it shifts to lower wavenumbers in the case of the electrospun fibers (Figure 6A), it does not shift for the powder samples (Figure S8B, Supporting Information). This change indicates the interaction between the PSI and the CaCl2 at a molecular level. Wei et al. described that the addition of CaCl2 to polyamide-6 fibers induces the shift of the C═O characteristic peak on the FTIR spectra, which shift is proportional to the CaCl2 content.[56] They hypothesized that the Ca atom coordinated with the O atom in the C═O group, therefore, the Ca atom became negatively, while the O atom became positively charged. Since PSI contains two C═O groups in every monomer, we can apply the same assumption to our system.
To support the FTIR results, XRD measurements were carried out on the fibrous samples with and without CaCl2. Inorganic additives can alter the crystal structure of polymers resulting in hybrid crystal structures.[57] As we can see in Figure 6B, the CaCl2 applied in our experiment is completely crystalline and contains a mixture of CaCl2·4H2O and CaCl2·6H2O, which were formed due to interaction with humidity. As we can see, pure PSI fibers can be considered almost completely amorphous, as was also described in our previous paper.[24]
The addition of calcium chloride to PSI fibers resulted in an increase of amorphous halo between 40 and 60 2Θ degrees, with some small peaks corresponding to the crystalline state of CaCl2-based hydrates. The lack of a high number of peaks shows that the dispersion of CaCl2 and its hydrates is uniform, similarly as was described by Jaworska et al.[58] These findings support our previous hypothesis and indicate that the solidification of PSI and CaCl2 mainly occurs simultaneously. These results lead us to the assumption that CaCl2 induces the early solidification of the polymer jet, which can be related to the 3D mesh formation.
The more relevant difference can be seen on the TGA curve of the electrospun fibers with different compositions and the powder mixture of the same compositions (Figure 6C). The results show that the CaCl2/PSI powder mixtures decompose in two steps around 345 and 410 °C which are related to the decomposition of PSI.[59] In contrast, the main decomposition step of the electrospun fibers can be found at the lower temperature (345 °C), while the main decomposition peak at 410 °C completely disappears from the DTGA curve (Figure 6C). CaCl2 can be used to catalyze the pyrolysis of cellulose as was described by Shimada and co-workers.[60] The mechanism can be explained by the coordination bonds between the polymer C═O groups and the Ca atom,[61, 62] which catalyzes the decomposition of the amide groups or, in our cases, the imide groups as well. A slight decrease can be seen on the TGA curve of the electrospun fibers between 100 and 300 °C while no change can be explored in this temperature region on the TGA curves of the powder mixture. This result indicates that crystalline water bounded stronger in the fiber's structure than in the powder mixtures in which there is no strong chemical interaction between CaCl2 and PSI.[60] The XRD results also support the hypothesis of molecular interaction between the crystalline water and PSI since the characteristic Bragg peaks of CaCl2 almost completely disappeared (Figure 6B). The TGA curves of the fibers prepared on the different humidity levels show that the environmental humidity has no tendentious effect on the water content of the polymer fibers (Figure S9, Supporting Information). We can also see that the residual mass is higher in the case of electrospun fibers than in the case of powder mixtures which can also indicate a strong interaction on the molecular level between the CaCl2 and PSI.
4 Conclusion
Inorganic additives, such as CaCl2, and RH level can play a key role in tuning the micro and macrostructure of electrospun fibers; however, the joint effect of inorganic salt and ambient humidity has never been investigated before. In this work, we aimed to reveal that the addition of CaCl2 makes PSI-based electrospun fibers more sensitive to ambient humidity and it gives us the opportunity to produce random 3D fibrous meshes that can be shaped for the final application (Figure 4B). Besides the macrostructure, the surface morphology, as well as the fiber diameter, highly depends on the RH when CaCl2 is introduced into the precursor PSI solution. On the contrary, without CaCl2, almost no effect of the RH was recognizable on the micro and macrostructure of the electrospun fibrous meshes. The FTIR, XRD, and TGA investigation revealed that CaCl2 highly coordinated with the polymer and almost completely amorphized during electrospinning. These changes in the microstructure can highly affect the solidification process and kinetics of the polymer jet, which causes significant changes in the micro- and macrostructure of PSI-based electrospun meshes. Our results show that the proper selection of inorganic salt additive and environmental humidity can induce 3D mesh formation during electrospinning and that might be used for finetuning the surface morphology and fiber diameter of different electrospun fibers.
Acknowledgements
D.J. and A.J.-H. contributed equally to this work therefore both are considered as last authors. This research was supported by NKFIH FK 137749, TKP2021-EGA-23, NKFIH FK138501, ÚNKP-21-3-II-SE-56, and EFOP-3.6.3-VEKOP-16-2017-00009 research grants.
Conflict of Interest
The authors declare no conflict of interest.
Open Research
Data Availability Statement
The data that support the findings of this study are available on request from the corresponding author. The data are not publicly available due to privacy or ethical restrictions.


