Impact of Abdominal Aortic Calcification Among Liver Transplantation Recipients
Abstract
Abdominal aortic calcification (AAC) is known as a risk factor of coronary artery disease, stroke, hyperphosphatemia, chronic inflammation, diabetes, and decreased estimated glomerular filtration rate. However, the clinical implications of incidental AAC findings in liver transplantation (LT) have not been evaluated in terms of posttransplantation survival and complications. Therefore, we analyzed the relationships between the AAC level and the outcomes following LT. A total of 156 consecutive patients who underwent LT between January 2007 and December 2014 were divided into 2 groups according to their AAC level (<100 mm3 or ≥100 mm3), as calculated using the Agatston method. Even after propensity matching, the survival time was significantly longer in the low-AAC group compared with that in the high-AAC group (median survival time, 4.5 versus 3.0 years; P < 0.01). A multivariate analysis identified high AAC level (hazard ratio, 2.2) and old donor age (hazard ratio, 2.2) as prognostic factors for overall survival. In conclusion, high AAC is an independent unfavorable prognostic factor in LT.
Abbreviations
-
- AAC
-
- abdominal aortic calcification
-
- BSI
-
- bloodstream infection
-
- CI
-
- confidence interval
-
- CIT
-
- cold ischemia time
-
- CKD
-
- chronic kidney disease
-
- CMV
-
- cytomegalovirus
-
- CRP
-
- C-reactive protein
-
- CT
-
- computed tomography
-
- CVD
-
- cardiovascular disease
-
- DM
-
- diabetes mellitus
-
- EDV
-
- end-diastolic velocity
-
- eGFR
-
- estimated glomerular filtration rate
-
- GPS
-
- Glasgow prognosis scale
-
- GRWR
-
- graft-to-recipient weight ratio
-
- HBV
-
- hepatitis B virus
-
- HCC
-
- hepatocellular carcinoma
-
- HCV
-
- hepatitis C virus
-
- LT
-
- liver transplantation
-
- MELD
-
- Model for End-Stage Liver Disease
-
- mGPS
-
- modified Glasgow prognosis scale
-
- OR
-
- odds ratio
-
- OS
-
- overall survival
-
- PSV
-
- peak systolic velocity
-
- PVF
-
- portal vein flow
-
- RI
-
- resistance index
Aortic calcification is a risk marker for cardiovascular disease (CVD) because it has been associated with coronary artery disease and stroke in the general population.1-3 Aortic calcification can be quantitatively measured on abdominal computed tomography (CT) as the aortic calcification index, a widely used measure that expresses calcification in 12 sectors as a percentage. In addition, abdominal aortic calcification (AAC) is easily evaluated on abdominal CT.4 AAC prevalence, patterns, and severity in the living kidney donor population have been reported.5 Living donors with a high AAC level require close observation because such patients have a higher probability of delayed renal function recovery after donation.4 Furthermore, an initial report demonstrated that thoracic aortic calcification in renal transplantation recipients predicts both cardiovascular events and all-cause mortality.6 However, the clinical implications of incidental AAC findings in liver transplantation (LT) have not been evaluated in terms of posttransplantation survival from complications. Therefore, the objective of the present study was to evaluate the impact of the AAC level on the outcomes after LT. Specifically, we assessed the relationship between the preoperative AAC level and overall survival (OS) after LT, as well as the impact of AAC on inflammatory markers and severe infectious diseases.
Patients and Methods
STUDY PATIENTS
A total of 156 LTs were performed in our unit between January 2007 and December 2014, including 141 living donor LTs and 15 deceased donor LTs. Data concerning the recipient at the time of the transplant (age, sex, Model for End-Stage Liver Disease [MELD] score, Child-Pugh classification, graft-to-recipient weight ratio [GRWR], ABO incompatibilities, hepatitis B virus [HBV] surface antigen level, hepatitis C virus [HCV] antibody level, AAC level, presence of diabetes, presence of hepatocellular carcinoma [HCC], serum C-reactive protein [CRP], serum albumin, operative time, and bleeding volume), as well as the donor’s age and cold ischemia time (CIT), were collected from electronic records. The rates of postoperative and longterm complications (including CVD, new incidence of diabetes, chronic renal failure, and de novo cancer) as well as OS were determined from posttransplantation electronic records. The study protocol was approved by the ethics committee of our hospital (E-1410).
CHRONIC RENAL FAILURE
Chronic renal failure was defined as a decreased estimated glomerular filtration rate (eGFR < 15 mL/minute/1.73 m2) with the exception of acute renal dysfunction.
BLOODSTREAM INFECTION
Bloodstream infection (BSI) was defined according to the criteria proposed by the Centers for Disease Control and Prevention.7 A blood culture test was performed in patients with an increased temperature of above 38℃. The isolation of bacteria and fungus (other than common skin contaminants) from 1 or more blood cultures in the presence of clinical symptoms was considered as proof of a BSI. The present study included cases in which infections developed within 30 days after surgery, and the first episode of BSI was documented.
GLASGOW PROGNOSIS SCALE AND MODIFIED GLASGOW PROGNOSIS SCALE
The Glasgow prognosis scale (GPS) was calculated as previously described (patients with a CRP of 1 mg/dL were allocated a score of 0, those with a CRP > 1 mg/dL or albumin < 3.5 g/dL received a score of 1, and those with a CRP > 1 mg/L and albumin < 3.5 g/dL received a score of 2).8 The modified Glasgow prognosis scale (mGPS) was also calculated as previously described (patients with a CRP of 1 mg/dL were allocated a score of 0, those with a CRP > 1 mg/dL received a score of 1, and those with a CRP > 1 mg/L and albumin < 3.5 g/dL received a score of 2).9 The GPS and mGPS are well known and are the most extensively validated systemic inflammation-based prognostic scores.
AORTIC ABDOMINAL CALCIFICATION
CT angiographies were performed using a standardized examination protocol on a 320-detector row CT scanner (Aquilion ONE ViSION, Toshiba Medical Systems, Japan). The AAC score was calculated using AZE VirtualPlace Lexus64 Anatomia software (AZE Inc., Tokyo, Japan). Using the Agatston method,9 the AAC volume was automatically calculated for calcifications located in the abdominal aorta (from the origin of the renal artery to the iliac bifurcation) with attenuation greater than the predefined 130 Hounsfield units level. Patients were divided into 2 groups according to the AAC level (<100 mm3 or ≥100 mm3).4
DOPPLER ULTRASONOGRAPHY OF THE LIVER
We evaluated the blood flow to the graft on postoperative day 1 using Doppler ultrasonography in 97 LT recipients between 2009 and 2014. The resistance index (RI), peak systolic velocity (PSV), and end-diastolic velocity (EDV) were investigated at the position of the hepatic artery anastomosis, and the portal vein flow (PVF) was checked at the level of the portal trunk.
STATISTICAL ANALYSIS
The longterm survival was estimated and compared using Kaplan-Meier and log-rank statistics. To adjust for differences in baseline characteristics, 1-to-1 propensity score models were constructed on the basis of each patient's estimated propensity score (based on the recipient’s age, donor’s age, sex, MELD score, Child-Pugh classification, GRWR, ABO incompatibilities, HBV surface antigen, HCV antibody level, AAC level, presence of diabetes, presence of HCC, operative time, bleeding volume, and CIT). Statistical analyses, including propensity score matching, were performed using JMP statistical software (JMP 13; SAS Institute Inc., Cary, NC). P values <0.05 were considered statistically significant.
Results
CHARACTERISTICS OF PATIENTS
The cohort included 95 men and 61 women with an overall mean age at the time of the transplant of 54.9 ± 10.4 years. There were 141 living donor LTs and 15 deceased donor LTs. Patient characteristics and surgical procedures prior to propensity score matching are summarized in Table 1. In the unmatched population, the high-AAC group had significantly more men and a higher mean age compared with that in the low-AAC group. For early mortality (within 1 year after LT, n = 27), the causes of death were as follows: infectious diseases, n = 20 (74.1%); liver failure, n = 3 (11.1%); CVD, n = 2 (7.4%); and other, n = 2 (7.4%). In contrast, for late mortality (over 1 year after LT, n = 21), the causes of death were as follows: infectious diseases, n = 9 (42.9%); HCC recurrences, n = 5 (23.8%); liver failure, n = 3 (14.3%); and CVD, n = 2 (9.5%). There was a significantly higher percentage of deaths related to infectious diseases in early mortality than in late mortality (74.1% versus 42.9%; P = 0.03). In late mortality, severe infectious diseases and CVD caused more than 50% of the deaths.
| Low-AAC Group (n = 90) | High-AAC Group (n = 66) | P Value | |
|---|---|---|---|
| Sex | 0.11 | ||
| Male | 50 | 45 | |
| Female | 40 | 21 | |
| Recipient age, years | 51.6 ± 11.5 | 59.3 ± 6.6 | <0.01 |
| Donor age, years | 38.0 ± 12.4 | 39.0 ± 12.5 | 0.61 |
| MELD points | 17.8 ± 7.5 | 19.4 ± 9.4 | 0.23 |
| Child-Pugh | <0.01 | ||
| A | 14 | 1 | |
| B | 30 | 18 | |
| C | 46 | 47 | |
| GRWR, % | 1.0 ± 0.5 | 1.0 ± 0.5 | 0.91 |
| ABO incompatibilities | 0.61 | ||
| Positive | 12 | 7 | |
| Negative | 78 | 59 | |
| Virus | 0.04 | ||
| No virus | 32 | 37 | |
| HCV | 41 | 20 | |
| HBV | 17 | 9 | |
| Diabetes | 0.08 | ||
| Positive | 39 | 38 | |
| Negative | 51 | 28 | |
| Hepatocellular carcinoma | 0.10 | ||
| Positive | 16 | 19 | |
| Negative | 74 | 47 | |
| Operative time, minutes | 786.4 ± 149.0 | 744.8 ± 111.4 | 0.06 |
| Bleeding volume, mL | 5219.8 ± 4122.9 | 4822.5 ± 2812.3 | 0.50 |
| CIT, minutes | 151.2 ± 136.5 | 151.7 ± 130.9 | 0.98 |
| Type of donor | 0.85 | ||
| Deceased | 9 | 6 | |
| Living donor | 81 | 60 |
PROPENSITY SCORE MATCHING TO EVALUATE THE INFLUENCE OF RECIPIENT AAC
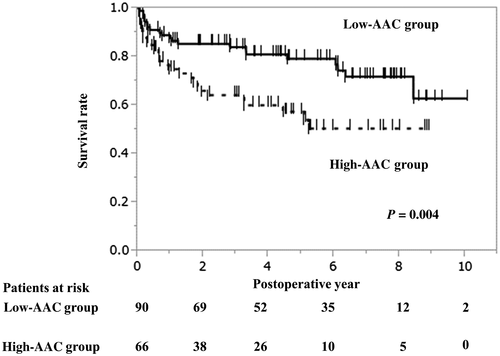
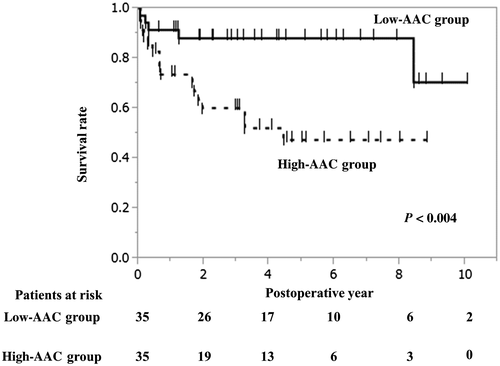
In the Kaplan-Meier survival curve analysis, the longterm survival was significantly worse in the high-AAC group than in the low-AAC group (P = 0.004; Fig. 1). In the propensity score–matched cohort (Fig. 2), the high-AAC group still had significantly worse survival compared with that in the low-AAC group. The 1-, 3-, and 5-year survival rates were 75.9%, 64.2%, and 57.5% in the high-AAC group, respectively, and were 87.7%, 84.0%, and 79.2% in the low-AAC group, respectively (Fig. 2). The postoperative complications are summarized in Table 3.

| Low-AAC Group (n = 35) | High-AAC Group (n = 35) | P Value | |
|---|---|---|---|
| Sex | 0.31 | ||
| Male | 21 | 25 | |
| Female | 14 | 10 | |
| Recipient age, years | 56.6 ± 8.7 | 56.9 ± 7.2 | 0.87 |
| Donor age, years | 37.5 ± 11.4 | 36.4 ± 11.1 | 0.69 |
| MELD points | 16.3 ± 7.6 | 18.9 ± 6.3 | 0.11 |
| Child-Pugh | 0.51 | ||
| A | 0 | 1 | |
| B | 12 | 14 | |
| C | 23 | 20 | |
| GRWR, % | 1.0 ± 0.5 | 1.0 ± 0.5 | 0.80 |
| ABO incompatibilities | 0.23 | ||
| Positive | 5 | 2 | |
| Negative | 30 | 33 | |
| Virus | 0.87 | ||
| No virus | 15 | 13 | |
| HCV | 13 | 15 | |
| HBV | 7 | 7 | |
| Diabetes | 0.81 | ||
| Positive | 14 | 15 | |
| Negative | 21 | 20 | |
| Hepatocellular carcinoma | 0.53 | ||
| Positive | 5 | 7 | |
| Negative | 30 | 28 | |
| Operative time, minutes | 743.6 ± 118.5 | 770.5 ± 117.4 | 0.34 |
| Bleeding volume, mL | 4393.3 ± 3038.0 | 5294.8 ± 2762.1 | 0.20 |
| CIT, minutes | 143.3 ± 141.7 | 166.0 ± 155.5 | 0.53 |
| Type of donor | 0.69 | ||
| Deceased | 4 | 3 | |
| Living donor | 31 | 32 |

| Before Matching | After Matching | |||||
|---|---|---|---|---|---|---|
| Low AAC (n = 90) | High AAC (n = 66) | P Value | Low AAC (n = 35) | High AAC (n = 35) | P Value | |
| Biliary complication | 29 (32.2) | 19 (28.8) | 0.65 | 11 (31.4) | 9 (25.7) | 0.60 |
| CMV infection | 39 (43.3) | 31 (47.0) | 0.65 | 12 (34.3) | 13 (37.1) | 0.80 |
| Portal vein stenosis | 1 (1.1) | 1 (1.5) | 0.83 | 1 (2.9) | 1 (2.9) | >0.99 |
| Postoperative hemorrhage | 17 (18.9) | 16 (24.2) | 0.42 | 3 (8.6) | 8 (22.9) | 0.19 |
| BSI within 30 days | 16 (17.8) | 22 (33.3) | 0.03 | 5 (14.3) | 11 (31.4) | 0.09 |
| BSI within 1 year | 23 (25.6) | 28 (42.4) | 0.03 | 8 (22.9) | 14 (40.0) | 0.12 |
| Hepatic artery thrombosis | 0 (0) | 0 (0) | — | 0 (0) | 0 (0) | — |
| Clinical rejection | 15 (16.7) | 16 (24.2) | 0.24 | 7 (20.0) | 7 (20.0) | >0.99 |
Note:
- Data are given as n (%).
RISK FACTORS FOR A POOR PROGNOSIS
Univariate analyses revealed that a high donor age and high recipient AAC level were statistically significant predictors of a poor prognosis. In a multivariate logistic regression analysis of the factors associated with a poor prognosis in the univariate analyses, donor age ≥ 50 years (odds ratio [OR], 2.2; 95% confidence interval [CI], 1.1-4.0; P = 0.01) and recipient AAC level ≥ 100 mm3 (OR, 2.2; 95% CI, 1.3-4.0; P < 0.01) remained as independent risk factors (Table 4).
| Factors | Univariate Analysis | Multivariate Analysis | |||||
|---|---|---|---|---|---|---|---|
| n | 3-Year Survival | 5-Year Survival | P Value | HR | 95% CI | P Value | |
| Age | 0.19 | ||||||
| ≥60 years | 56 | 81.5% | 78.7% | ||||
| <60 years | 100 | 72.7% | 66.2% | ||||
| Sex | 0.40 | ||||||
| Male | 95 | 74.6% | 67.5% | ||||
| Female | 61 | 77.8% | 75.3% | ||||
| Donor age | <0.01 | 2.2 | 1.2-4.0 | 0.01 | |||
| ≥50 years | 33 | 62.7% | 52.6% | ||||
| <50 years | 123 | 79.5% | 75.0% | ||||
| MELD | 0.31 | ||||||
| ≥20 | 53 | 70.9% | 64.9% | ||||
| <20 | 103 | 78.6% | 73.2% | ||||
| GRWR | 0.69 | ||||||
| ≥0.8% | 50 | 71.0% | 68.8% | ||||
| <0.8% | 106 | 75.1% | 71.0% | ||||
| AAC | <0.01 | 2.2 | 1.3-4.0 | <0.01 | |||
| ≥100 | 66 | 64.2% | 57.5% | ||||
| <100 | 90 | 84.0% | 79.2% | ||||
| ABO incompatibilities | 0.37 | ||||||
| Yes | 19 | 63.2% | 63.2% | ||||
| No | 137 | 77.8% | 71.2% | ||||
| DM | 0.33 | ||||||
| Yes | 35 | 74.2% | 61.2% | ||||
| No | 121 | 76.2% | 72.5% | ||||
| Virus | 0.62 | ||||||
| Non | 69 | 73.7% | 68.2% | ||||
| HCV | 61 | 76.2% | 70.0% | ||||
| HBV | 26 | 80.8% | 75.7% | ||||
| HCC | 0.62 | ||||||
| Yes | 79 | 76.2% | 66.2% | ||||
| No | 77 | 75.5% | 73.8% | ||||
CORRELATIONS BETWEEN THE RECIPIENT AAC LEVEL AND LONGTERM COMPLICATIONS
Correlations between the recipient AAC level and longterm complications are shown in Table 5. There were no significant group differences in the longterm complications, including CVD, diabetes, severe renal dysfunction, and de novo cancer among the 121 patients alive at 1 year after transplantation (high-AAC group, n = 44; low-AAC group, n = 77).
| Low-AAC Group (n = 77) | High-AAC Group (n = 44) | P Value | |
|---|---|---|---|
| CVD | 1 (1.3) | 3 (6.8) | 0.14 |
| New incidence of diabetes | 23 (29.9) | 14 (31.8) | 0.82 |
| Severe renal dysfunction | 2 (2.6) | 3 (6.8) | 0.35 |
| De novo cancer | 3 (3.9) | 4 (9.1) | 0.26 |
NOTE:
- Data are given as n (%).
CORRELATIONS BETWEEN THE AAC LEVEL AND INFLAMMATORY MARKERS
Table 6 shows the correlations between the AAC level and inflammatory markers. The preoperative serum albumin level in the high-AAC group was significantly lower than that in the low-AAC group (2.9 ± 0.5 g/dL versus 3.2 ± 0.5 g/dL; P < 0.01). In the high-AAC group, 9.1%, 65.2%, and 25.8% of patients had a GPS of 0, 1, and 2 points, respectively, whereas in the low-AAC group, the distribution was 26.7%, 62.2%, and 11.1%, respectively (P < 0.01). In the high-AAC group, 74.2%, 0.0%, and 25.8% of patients had a mGPS of 0, 1, and 2 points, respectively, whereas in the low-AAC group, the distribution was 82.2%, 6.7%, and 11.1%, respectively (P < 0.01). AAC was strongly related to the systemic inflammation-based prognostic scores. After propensity score matching, there were no significant group differences in the GPS and mGPS.
| Low-AAC Group (n = 90) | High-AAC Group (n = 66) | P Value | |
|---|---|---|---|
| CRP, mg/dL | 0.7 ± 1.1 | 1.1 ± 1.8 | 0.06 |
| Albumin, g/dL | 3.2 ± 0.5 | 2.9 ± 0.5 | <0.01 |
| GPS, n | <0.01 | ||
| 0 | 24 | 6 | |
| 1 | 56 | 43 | |
| 2 | 10 | 17 | |
| mGPS, n | <0.01 | ||
| 0 | 74 | 49 | |
| 1 | 6 | 0 | |
| 2 | 10 | 17 |
FINDINGS ON ULTRASONOGRAPHY
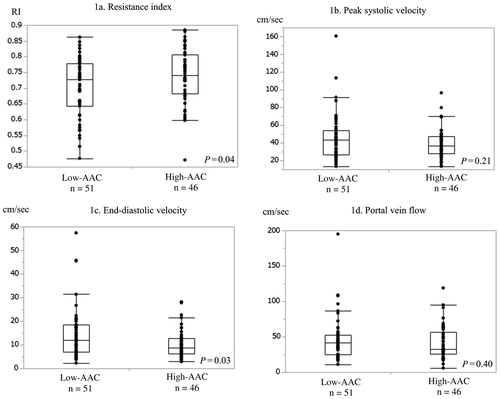
Figure 3 shows the findings on ultrasonography. The RI was significantly higher in the high-AAC group than in the low-AAC group (0.70 ± 0.09 versus 0.74 ± 0.09; P = 0.04). In addition, the EDV was also significantly lower in the high-AAC group than in the low-AAC group (10.4 ± 6.0 cm/seconds versus 14.4 11.1 cm/seconds; P = 0.03). There were no significant group differences in the PSV and PVF.

Discussion
The present study revealed a high AAC level as an independent poor prognostic factor for LT recipients. Furthermore, a high AAC level was strongly associated with worse survival. As no previous publications have evaluated the impact of the degree of AAC on OS in LT, the present study is the first to demonstrate the influence of AAC on the risk of unfavorable longterm outcomes after LT. Aortic calcification is a well-known risk marker for CVD.1-3 In addition, several studies have evaluated the clinical implications of AAC as a specific disease state and have shown that AAC is associated with hyperphosphatemia, chronic inflammation, diabetes, and decreased eGFR among patients with chronic kidney disease (CKD).10 Furthermore, a strong relationship between AAC and coronary artery calcification has been reported in patients with CKD.11 Another group reported that elevated levels of several inflammatory biomarkers, including β2-microglobulin, fibroblast growth factor 23, interleukin 8, and interleukin 18, are associated with arterial calcification in patients with CKD.10 Furthermore, aortic calcification was shown to be a strong predictor of stroke in a large previous study.1 Thus, the present results add to the literature on the deleterious effects of high AAC by demonstrating that a high AAC level is a risk factor for a poor prognosis after LT.
On the basis of the present results, the AAC level should be estimated preoperatively to plan the risk management. AAC can be detected using various complimentary methods, including plain lateral abdominal X-ray films (straightforward, low radiation dose, only semiquantitative at best) and CT-based examinations, with either manual or automatic algorithms to speedily and reproducibly detect and quantify calcified sections of the vessel walls.12 Given recent advancements in imaging devices, the AAC level can be calculated and quantified accurately and automatically.4
Diabetes has been associated with the presence of aortic calcification in patients on prevalent dialysis.13 Diabetes is also associated with worse event-free survival and mortality.6 However, in the present study, there was no difference in the new onset of diabetes between patients with low and high AAC. In addition, numerous reports have demonstrated that AAC is a risk factor of CVD.1-3, 6 However, in the present study, the high-AAC group did not have a statistically higher risk of CVD or severe chronic renal dysfunction compared with that of the low-AAC group, possibly due to the small sample size.
Inflammatory cells present in arteriosclerotic lesions, such as macrophages and T lymphocytes, are known to be involved in the progression of vascular calcification.14 In the present study, the AAC level had a close relationship with the GPS and mGPS, and this level reflects the systemic inflammatory response. The systemic inflammatory response may be worse because of malnutrition and reduced preoperative immunocompetence, suggesting that compromised immunocompetence may influence infections.15, 16 The GPS was also reported as the better predictive system in patients with HCC after living donor LT in our population.17 Therefore, the finding that a high AAC level leads to poorer survival and a high systemic inflammatory response is highly compelling.
In elderly patients, frailty is a state of vulnerability to a poor resolution to homeostasis after stress and is a consequence of a cumulative decline in multiple physiological systems over the lifespan.18 AAC is considered to be one of the most representative factors of frailty. Consistent with this, the high-AAC group had a high prevalence of diabetes, CVD, severe renal dysfunction, inflammatory status, de novo cancer, and so on. Thus, the activities of daily living may decrease in recipients with a high AAC level. Furthermore, organ dysfunction is likely to occur in the long term. Surprisingly, recipient age was not a risk factor for OS in our department. In contrast, the present study showed that the recipient AAC level is an important risk factor of not only longterm but also short-term survival. In particular, high inflammatory status was increased in the high-AAC group. This finding suggests that AAC reflects one aspect of frailty in the recipients before LT. The present study results suggest that chronic inflammation led by arteriosclerosis caused partial organ dysfunction, potentially due to frailty.
Although the present study provides new information on the impact of AAC on LT outcomes, it has several limitations because of the small sample size. In addition, many unknown issues involving aortic calcification, including the mechanisms involved, remain undetermined. Larger cohorts are necessary to further investigate the impact of AAC in LT.
In conclusion, the present retrospective study demonstrated that recipient AAC is associated with OS after LT with a high AAC level as an independent unfavorable prognostic factor.
Potential conflict of interest
Nothing to report.


