The impact of broader regional sharing of livers: 2-year results of “Share 35”
Potential conflict of interest: Nothing to report.
The data reported here have been supplied by the United Network for Organ Sharing as the contractor for the Organ Procurement and Transplantation Network (OPTN). The interpretation and reporting of these data are the responsibility of the author(s) and in no way should be seen as an official policy of or interpretation by the OPTN or the US Government.
Abstract
In June of 2013, the Organ Procurement and Transplantation Network (OPTN) implemented regional sharing for Model for End-Stage Liver Disease (MELD)/Pediatric End-Stage Liver Disease (PELD) candidates with scores reaching 35 and above (“Share 35”). The goal of this distribution change was to increase access to lifesaving transplants for the sickest candidates with chronic liver disease and to reduce the waiting-list mortality for this medically urgent group of patients. To assess the impact of this change, we compared results before and after policy implementation at 2 years. Overall, there were more liver transplants performed under Share 35 and a greater percentage of MELD/PELD 35+ candidates underwent transplantation; waiting-list mortality rates in this group were also significantly lower in the post-policy period. Overall adjusted waiting-list mortality was decreased slightly, with no significant changes in mortality by age group or ethnicity. Posttransplant graft and patient survival was unchanged overall and was unchanged for the MELD/PELD 35+ recipients. In conclusion, these data demonstrate that the Share 35 policy achieved its goal of increasing access to transplants for these medically urgent patients without reducing access to liver transplants for pediatric and minority candidates. Although the variance in the median MELD at transplant as well as the variance in transport distance increased, there was a decrease in overall liver discard rates and no change in overall cold ischemia times following broader sharing of these organs. The OPTN will continue to monitor this policy, particularly for longer-term posttransplant survival outcomes.Liver Transplantation 22 399-409 2016 AASLD
Abbreviations
-
- CIT
-
- cold ischemia time
-
- DRI
-
- donor risk index
-
- DSA
-
- donor service area
-
- HRSA
-
- Health Resources and Services Administration
-
- MELD
-
- Model for End-Stage Liver Disease
-
- OPO
-
- organ procurement organization
-
- OPTN
-
- Organ Procurement and Transplantation Network
-
- PELD
-
- Pediatric for End-Stage Liver Disease
-
- UNOS
-
- United Network for Organ Sharing
Under the direction of the Organ Procurement and Transplantation Network (OPTN), policies for allocating and distributing (sharing) deceased donor organs have evolved continuously since 1986, based on current scientific evidence. The United Network for Organ Sharing (UNOS) operates the OPTN under contract from the Health Resources and Services Administration (HRSA). All transplant centers in the United States are required to be members of the OPTN and as such must submit complete and accurate data on donors, waiting-list candidates, and transplant recipients used in the assessment of its operation. This assessment includes monitoring of policies related to organ allocation and distribution for efficacy and adherence to the Final Rule.1
Since 2002, deceased donor livers have been allocated according to the Model for End-Stage Liver Disease (MELD) for candidates (12+ years of age) and a similar model for Pediatric End-Stage Liver Disease (PELD) for pediatric candidates. Previous studies 2-4 have demonstrated the benefits of the MELD system, which assigns scores based on objective medical criteria in the form of clinical laboratory values. When additional criteria are met, such patients may receive additional MELD/PELD points in the form of exception scores used for allocation. A special medical urgency category (status 1) is reserved for a subset of candidates with acute liver failure who are most likely to die within 7 days without a liver transplant and for certain chronically ill pediatric candidates.
Distribution refers to the arrangement of geographic units for organ allocation by MELD/PELD. For this purpose, OPTN sharing areas consist of local, regional, and national tiers. The local distribution area consists of the smallest unit, candidates waiting within the donor service area (DSA). Each of the 11 allocation regions includes a unique subset of DSAs as defined by UNOS. Beyond regions, the national tier includes all remaining candidates waiting in the United States.
Regional sharing for candidates with MELD/PELD scores of 15 or higher, implemented in 2005, was based on analyses demonstrating the net transplant benefit for patients with MELD scores above that threshold.5 Regional sharing for status 1 candidates was shown to reduce the waiting-list mortality for this group of medically urgent patients.6 Sharma et al.7 showed that a group of candidates with higher MELD/PELD scores (35+) had waiting-list mortality rates that were similar to those of status 1 candidates. To address this and related issues, several important changes to the distribution of adult donor livers were implemented in June 2013. These changes included extending regional sharing of livers to MELD/PELD 15+ candidates on a national basis, implementing regional sharing of livers to MELD/PELD 35+ candidates (“Share 35”), and national sharing of livers and intestines to liver-intestine candidates. The latter change was intended to address the high mortality in candidates with intestinal failure awaiting a combined liver-intestine transplant relative to those requiring a liver alone, in large part due to candidate-donor size constraints and the availability of multivisceral grafts.
The principal focus of the present study is to assess the impact of the Share 35 policy at the 2-year mark. We sought to determine if the policy met its goal of reducing the waiting-list mortality for candidates with a MELD score ≥35 (MELD/PELD 35+) without introducing unintended consequences, such as reduced access to liver transplants for pediatric and minority candidates. Consequently, although the Share 35 policy is based on adult donor allocation, transplants resulting from both adult and pediatric donation are shown in this study.
Patients and Methods
General
This study used data from OPTN. The OPTN data system includes data on all donors, wait-listed candidates, and transplant recipients in the United States, submitted by the members of OPTN, and it has been described elsewhere (https://optn.transplant.hrsa.gov/data/about-data/). The HRSA, US Department of Health and Human Services, provides oversight to the activities of the OPTN contractor.
For the majority of analyses, data were provided for 2 eras. The pre-implementation era included data from 6/18/2011 to 6/17/2013, whereas the post-implementation era included data from 6/18/2013 to 6/18/2015. Each period consists of 730 days. Unless otherwise noted, all MELD/PELD scores were those used for allocation (ie, they include additional exception points).
All analyses were performed using SAS, version 9.3 (SAS Institute, Cary, NC) and were based on OPTN data as of September 4, 2015. All P values are 2-sided.
Waiting List, Transplants, and Liver Discards
Waiting-list demographics were obtained from the OPTN transplant candidate registration form. Cold ischemia time (CIT) of the donor liver was obtained from the OPTN transplant recipient registration form. The donor risk index (DRI), a measure of donor quality, was calculated according to Feng et al.8 Larger values of the DRI are associated with donor livers of less quality. Organ travel was based on the distance between the donor hospital and the transplant center and was calculated using the longitude and latitude of each institution. Data on livers that were not recovered and livers that were recovered for transplant but not transplanted were obtained from the OPTN deceased donor registration form. Tests for differences in the proportions of patient demographics between the post- and pre-implementation eras were based on the chi-square distribution. Tests for differences in continuous variables were based on the t distribution or the Wilcoxon rank sum test. Testing for the difference in the variance of the median allocation MELD/PELD score between eras was performed using the F test. The trend in the number of MELD/PELD 35+ candidates on the waiting-list snapshot over time was estimated using a linear spline with 1 knot on the date of the Share 35 implementation.
Waiting-list Outcomes
Removals for death as well as “too sick” were treated as deaths. However, if a candidate was removed from the list for too sick and that same candidate was discovered on a subsequent listing, that candidate was not considered to have been removed for too sick (recoded to “other removal”). Records for candidates who were multiply listed were combined into 1 registration. Prevalent candidates on the list at the beginning of each era had delayed entry into the risk set using left truncation.
- Deceased donor transplant.
- Death/too sick.
- Other removals.
Candidates who had not yet experienced any event were censored as of the end of the applicable period. For each registration, a candidate could experience at most 1 event. The covariate used in the analysis was the allocation MELD/PELD for each candidate at the start of the period (for prevalent candidates) or the initial allocation MELD/PELD for incident candidates. The laboratory MELD/PELD was used for status 1 candidates and candidates who were inactive at the start of the period. The analysis was performed independently for each era using all candidates, and an overall analysis was used to assess formally the impact of the era. A separate analysis was performed for each era excluding those candidates who at some point entered the MELD/PELD 35+ category.
For candidates initially entering the MELD/PELD 35+ category in each era, transplant rates and death rates within 90 days were estimated using a cumulative incidence analysis10 to account for competing risks. In this analysis, the pre-implementation era cohort included candidates entering MELD/PELD 35+ between 6/18/2011 and 90 days before 6/17/2013. The pre-implementation era cohort was shortened to avoid overlap with the post-implementation era data. Similarly, the post-implementation era cohort included candidates entering MELD/PELD 35+ between 6/18/2013 and 90 days before 6/18/2015. Confidence intervals for the competing risks outcomes were calculated by the method described by Aalen.11
Posttransplant Outcomes
Unadjusted patient and graft survival was assessed using the Kaplan-Meier method.12 Adjusted patient and graft survival was estimated using Cox regression modeling.13 For these analyses, all transplants in the pre-implementation era cohort were used and transplants from 6/18/2013 to 03/13/2014 were used in the post-implementation era cohort to allow for sufficient follow-up. In the pre-implementation era cohort, 98% of recipients were followed for a minimum of 12 months. In the post-implementation era 6-month cohort, approximately 65% of recipients were followed up to that point, with 80% having follow-up information as late as 350 days after transplant. Only primary transplants were considered in the analysis of patient survival, whereas all transplants were used in the analysis of graft survival. For the patient survival analysis, survival time was calculated from the first transplant to the latest follow-up for the recipient, regardless of the number of transplants. Patient survival time was censored at the latest follow-up if the recipient was alive, and graft survival time was censored at the latest follow-up if the liver was functioning. All observations were censored after 365 days. Cox regression models of patient survival were adjusted for recipient age, whether the recipient had a MELD/PELD exception score at the time of transplant, and the DRI, which is calculated using CIT and several factors related to donor quality. In addition to the factors used in the models for patient survival, Cox regression models of graft survival included a factor for previous transplant. Tests for differences in unadjusted survival were performed using the log-rank test.14
Results
Transplants
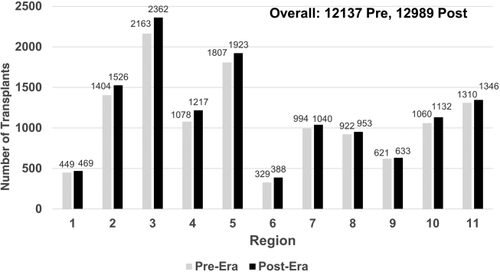
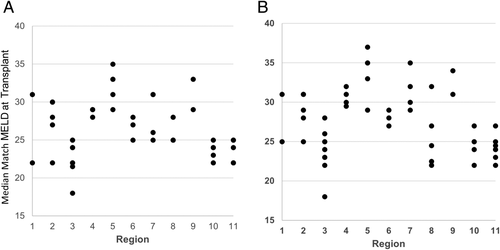
There were 12,989 deceased donor liver transplants in the post-implementation era, compared to 12,137 in the pre-implementation era. This was an increase of 852 transplants. As shown in Fig. 1, this increase was consistent across all regions. Of the 12,989 transplants, 26.5% were performed in the MELD/PELD 35+ group in the post-implementation era. Of these, 12.9% had MELD/PELD exceptions. In the pre-implementation era, 18.5% of transplants were performed in the MELD/PELD 35+ group, and of these, 11.4% had exceptions. The overall median MELD/PELD scores at transplant also increased from 27 to 28, with scores in the post-implementation era ranging from 25 to 35 across regions. Figure 2A,B shows that the variance in the median MELD/PELD at transplant also increased, from 14.4 in the pre-implementation era to 16.8 in the post-implementation era (P = 0.56). The demographics of recipients were relatively unchanged between eras, as shown in Table 1.
| Factor | Pre- implementation Era | Post- implementation Era | P Value |
|---|---|---|---|
| Age, years, median | 56.0 | 57.0 | 0.01 |
| Male, % | 66.2 | 65.6 | 0.35 |
| Ethnicity, % | 0.49 | ||
| White | 68.5 | 69.2 | |
| Hispanic | 14.6 | 14.0 | |
| Black | 10.8 | 10.8 | |
| Asian | 4.6 | 4.5 | |
| American Indian/Alaska Native | 0.7 | 0.6 | |
| Multiracial | 0.6 | 0.7 | |
| Native Hawaiian/other Pacific Islander | 0.3 | 0.2 | |
| Diagnosis at transplant, % | 0.001 | ||
| Noncholestatic cirrhosis | 51.3 | 50.0 | |
| Malignant neoplasms | 25.6 | 26.7 | |
| Cholestatic liver disease/cirrhosis | 6.7 | 7.1 | |
| Acute hepatic necrosis | 4.0 | 4.3 | |
| Metabolic disease | 3.7 | 3.7 | |
| Other liver disease | 3.7 | 2.5 | |
| Biliary atresia | 2.5 | 2.7 | |
| Other (text) | 1.9 | 2.4 | |
| Benign neoplasms | 0.6 | 0.6 | |
| Not reported | 0.0 | 0.0 |
- NOTE: Pre-implementation era from 6/18/2011 to 6/17/2013 (n = 12,137). Post-implementation era from 6/18/2013 to 6/18/2015 (n = 12,989). Due to rounding, the total for some categories may exceed 100%.
The level of regional sharing also increased from 20.8% to 32.0%. The number of liver-intestine transplants increased from 83 to 154. There was a slight increase in the number of liver-kidney transplants (936 versus 1118), increasing from 7.7% to 8.6% of all deceased donor liver transplantations.
Organ Travel Distance, CIT, and DRI
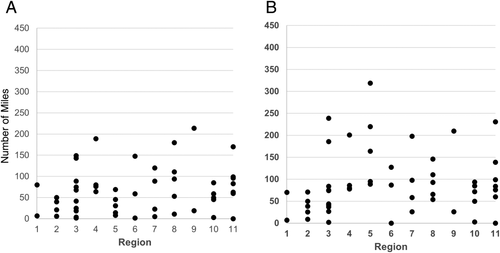
As shown in Table 2, the overall median organ travel distance increased from 58 to 82 miles in the post-implementation era (P < 0.001). The variance in this metric by DSA increased substantially (P = 0.003) in the post-implementation era, driven largely by the changes in region 5 (Figs. 3A,B). Little or no change was seen in CIT (P = 0.30), although there were a few more outliers in the post-implementation era. There was an overall very slight increase in the DRI (P = 0.001). Interestingly, however, the DRI for regional shares showed a marginal decrease, indicating slightly better organs were being used in these recipients (P = 0.02).
| Factor | Pre-implementation Era | Post-implementation Era |
|---|---|---|
| Distance organs traveled, miles, median | ||
| Overall | 58 | 82 |
| Local | 22 | 22 |
| Regional | 231 | 238 |
| National | 671 | 633 |
| CIT, hours, median | ||
| Overall | 6.1 | 6.1 |
| Local | 5.9 | 5.7 |
| Regional | 6.7 | 6.6 |
| National | 8.0 | 7.6 |
| DRI, median | ||
| Overall | 1.3 | 1.3 |
| Local | 1.3 | 1.3 |
| Regional | 1.5 | 1.4 |
| National | 1.6 | 1.6 |
- NOTE: Pre-implementation era from 6/18/2011 to 6/17/2013. Post-implementation era from 6/18/2013 to 6/18/2015. Metrics were calculated for the overall United States and separately for transplants occurring locally, regionally, and nationally.
Livers Not Used
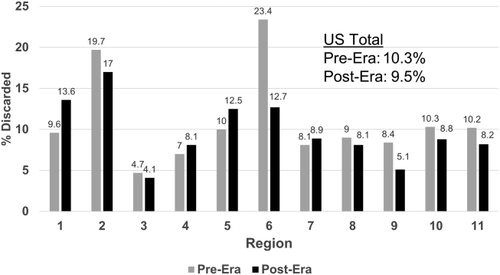
In the pre-implementation era, there were 2235 donors from whom a liver was not recovered. This was 13.7% of all donors in the period. In the post-implementation era, there were also 2235 donors from whom a liver was not recovered (12.9% of donors; P = 0.04). It should be noted that there were 870 more donors in the post-implementation era. Whole liver discards (recovered for transplant but not transplanted) were also reduced, falling from 1355 (10.3%) to 1338 (9.5%; P = 0.04). Although most regions experienced a decrease in the discard rate, there were some regions that experienced an increase (Fig. 4).
Waiting-list Dynamics
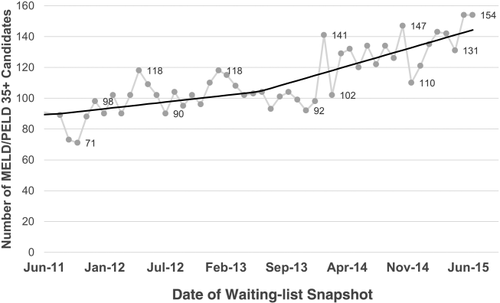
Table 3 shows the number of waiting-list additions by era and allocation score at listing. Over 600 additional candidates were added to the waiting list in the post-implementation era, with 58% in the MELD/PELD 15-34 category, and over 39% in the MELD/PELD 35+ group. Figure 5 shows the number of candidates with MELD/PELD allocation scores of 35+ on a waiting-list snapshot during the study period. Although there were some fluctuations from month to month, there was an increasing trend in the number of these candidates that was enhanced with Share 35 from approximately 100 in the pre-implementation era months to more than 120 in the post-implementation era months.
| Status 1 | <15 | 15-34 | 35+ | Inactive | Total | ||||||
|---|---|---|---|---|---|---|---|---|---|---|---|
| n | % | n | % | n | % | n | % | n | % | ||
| Pre-implementation era | 891 | 3.8 | 10,141 | 43.2 | 10,629 | 45.3 | 1441 | 6.1 | 357 | 1.5 | 23,459 |
| Post-implementation era | 872 | 3.6 | 10,229 | 42.4 | 11,005 | 45.7 | 1695 | 7.0 | 306 | 1.3 | 24,107 |
| Net | -19 | +88 | +376 | +254 | -51 | +648 | |||||
- NOTE: Pre-implementation era from 6/18/2011 to 6/17/2013. Post-implementation era from 6/18/2013 to 6/18/2015. The last row contains the net increase in the post-era relative to the pre-era.
Pretransplant Outcomes
There were 37,656 candidates on the waiting list during the pre-implementation era, of which 5798 (15.4%) were removed because of death or being too sick. In the post-implementation era, there were 37,929 candidates on the waiting list, of which 5903 (15.6%) were removed for death or being too sick. Because of the net increase in more medically urgent patients during the post-implementation era, waiting-list mortality adjusted for starting MELD is appropriate when comparing the results across eras.
Overall adjusted waiting-list mortality rates and mortality rates for adults, pediatrics, and by ethnicity are shown in Figs. 6–9. To show the difference in adjusted mortality rates by era, each figure shows the expected waiting-list mortality over time for hypothetical candidates with a MELD/PELD score of 15 at the beginning of each era. The overall adjusted mortality rate was slightly lower in the post-implementation era (Fig. 6), although this rate was found to be within the confidence limits of the pre-implementation era mortality rates (Fig. 7). In addition, the overall adjusted hazard of mortality was not significantly different by era (P = 0.70). There were no differences in mortality rates across eras for adult and pediatric candidates (Fig. 8). Likewise, no differences in mortality rates across eras were found by ethnicity (Fig. 9). Although African American and Hispanic candidates appeared to fare slightly better under Share 35, their adjusted hazard of mortality was not significantly different across eras (P = 0.45 for African Americans and P = 0.44 for Hispanics). In a separate analysis, excluding candidates who entered the MELD/PELD 35+ category in each era, waiting-list mortality rates were nearly identical by era (Figs. 10 and 11).
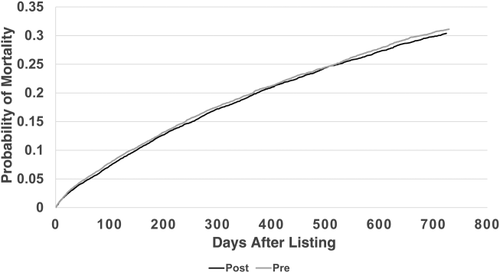
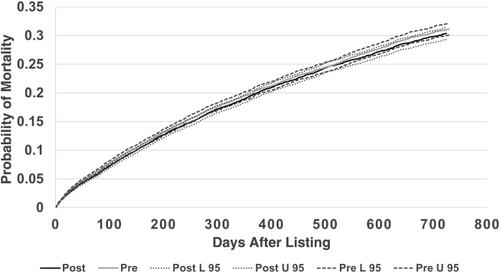
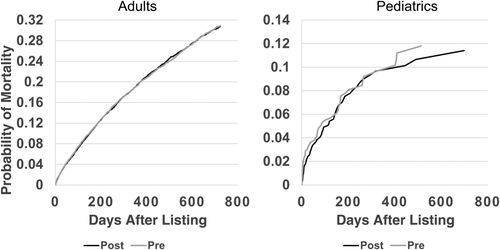
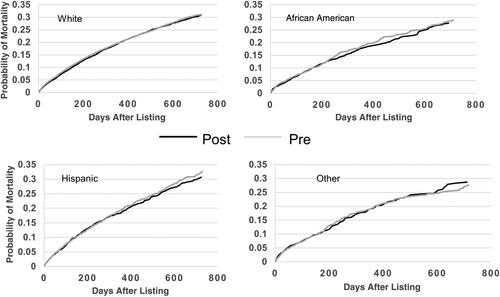

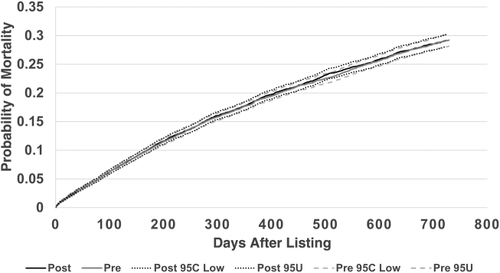
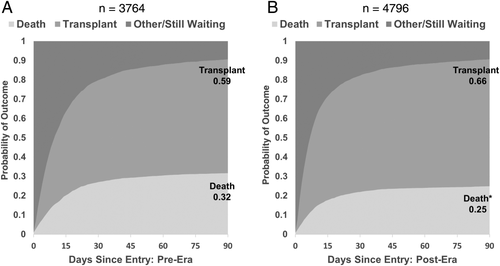
Figure 12A,B shows the results of a competing risks analysis from the time of the candidate's first entry into the MELD/PELD 35+ category in both eras. Although these candidates were captured in the overall analysis, the outcomes for this specific group of candidates during both eras were of interest. Candidates in the post-implementation era were more likely to be transplanted within 90 days (66% versus 59%; P < 0.05) and were less likely to die while waiting (25% versus 32%; P < 0.05). In the post-implementation era, 92% of the candidates who entered the MELD/PELD 35+ category and underwent transplantation received their transplants while remaining in the MELD/PELD 35+ category, compared to 85% of the candidates in the pre-implementation era. In both eras, approximately half of the candidates who entered the MELD/PELD 35+ category and died did so while remaining in the MELD/PELD 35+ category.
For liver-intestine candidates, the probability of receiving a combined liver-intestine transplant within 12 months increased from 30.2% in the pre-implementation era to 46.8% in the post-implementation era (P < 0.05). Death rates within 12 months fell slightly, but not significantly, from 12.4% to 11.4%.
Posttransplant Outcomes
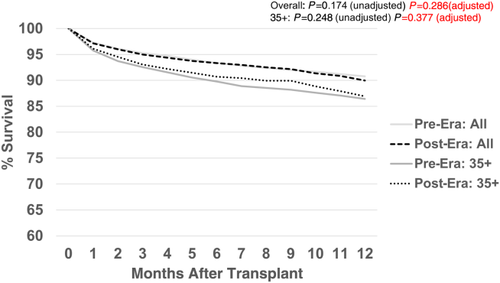
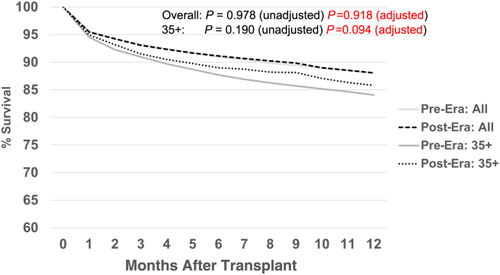
Figure 13 shows the comparison of 12-month patient survival for the primary deceased donor liver transplants performed in each era. There were no significant differences in survival (pre- versus post-) for either the overall group or the MELD/PELD 35+ group. Likewise, there were no significant differences in graft survival by era (Fig. 14) for either the overall group or the MELD/PELD 35+ group. Cox regression models comparing patient and graft survival also showed no significant differences by era (data not shown).
Discussion
On the basis of the results of the first 2 years of Share 35, there were many positive benefits, especially to the most-urgent chronic liver disease candidates. Massie et al.15 showed similar results in an analysis of Share 35 at 1 year. We felt it important to assess the impact of this policy using longer-term data, and to identify any potential negative consequences to pediatrics, ethnic minority groups, and liver-intestine candidates. There was an overall increase in the number of deceased donor liver transplantations, although this increase is not necessarily attributable to Share 35. The percentage of candidates transplanted with MELD/PELD exceptions continues to be a concern of the OPTN. Although the percentage of MELD/PELD 35+ recipients increased from 18.5% to 26.5%, there was also a slight increase in the percentage of MELD exceptions in this category. Nearly twice as many liver-intestine recipients underwent transplantation, with almost a 20% increase in the number of liver-kidney transplants. Although the overall organ travel distance increased slightly (24 miles), as expected, the overall DRI and CIT were unchanged. Many transplant centers alter their surgical scheduling practices for distant donors. This explains the historically weak correlation observed between CIT and the distance between the donor hospital and the transplant center. Apparently, such behavior changes also occurred in response to the Share 35 policy. Because the median allocation MELD/PELD at transplant increased, so did the variance in that metric, highlighting some of the ongoing disparities in the current regional distribution system reported by Massie et al.,16 such as the rate of transplant and death on the waiting list across DSAs. The variance in the median travel distance by DSA also increased significantly, although a substantial portion of this increase was driven by the increased distances in region 5. Although some feared that the increased sharing with this policy would result in an increase in liver discards, this was not the case. The overall number and rate of discards fell in the post-implementation era, perhaps partially explaining the increase in the total number of transplants.
Because donor livers are a precious resource, there has been some concern in the community about the possible futility of transplanting the sicker candidates. At what point does a candidate become too sick to transplant? Merion et al.5 found that even adult candidates with a MELD score of 40 received a net survival benefit within the first year after transplant. It is possible that current practice already selects for the subset of MELD/PELD 35+ candidates that will benefit from a liver transplant, bypassing the truly futile patients. It would be important to revisit this net benefit analysis at some point in the future in order to verify that this is happening under Share 35.
It is interesting to note the increase in waiting-list additions that have occurred since the implementation of the policy, in particular those candidates with MELD/PELD scores of 35 and above. Apparently, Share 35 provided the incentive for programs to list some patients who otherwise would not have received an opportunity for a liver transplant. However, even though over 600 additional candidates were added to the waiting list in the post-implementation era, the overall adjusted pretransplant death rate was slightly lower, although this difference did not reach statistical significance. In fact, no significant increases were observed in the pretransplant mortality rate by age group (pediatric/adult), ethnicity, or in the lower MELD/PELD categories. On the other hand, MELD/PELD 35+ candidates underwent transplantation at a significantly higher rate and died at a significantly lower rate in the post-implementation era. In addition, in this early review, there were no significant changes in posttransplant patient or graft survival, either overall or for the subgroup of MELD/PELD 35+ recipients. This provides some evidence that futile transplants are occurring no more often under Share 35 than they occurred in the pre-implementation era. However, extended follow-up on these recipients will be necessary to assess the longterm impact of Share 35.
Because the OPTN does not collect financial data related to transplantation, this analysis did not address the cost implications of transplanting more patients in the higher MELD/PELD categories. Axelrod et al.17 showed that based on University Health Consortium data, transplant costs were strongly associated with the recipient's severity of illness as captured by the MELD score. Gentry et al.18 posited that broader sharing has a limited impact on CIT but will significantly increase the proportion of transplants that are transported by flying rather than driving. Both data on organ acquisition charges and recipient charges have been collected by the OPTN Liver and Intestinal Organ Transplantation Committee as it studies the financial implications of broader sharing for the most urgent candidates. Clearly, the implications of cost must be considered to determine the full impact of broader sharing, not only on the lives of candidates and recipients but to the system as a whole.
Finally, as this study demonstrates, broader sharing across the current boundaries of the 11 regions does not reduce the large variance in access to patients with liver disease based on their MELD scores. In order for the current system to transform into one in which there can be more equitable access to these lifesaving organs, increases in cost will most certainly be seen by OPOs and transplant centers. Hopefully, these increased pretransplant costs will be offset by the cost savings that result from transplanting the most medically urgent candidates in this group at lower MELD scores. Most importantly, transplant centers and OPOs will need to work together even more closely than ever to find ways to improve efficiency and collaboration to change behavior in current practice.


