Relevance of activated hepatic stellate cells in predicting the development of pediatric liver allograft fibrosis
Potential conflict of interest: Nothing to report.
Abstract
Activated hepatic stellate cells (HSCs) are the main collagen-producing cells in liver fibrogenesis. With the purpose of analyzing their presence and relevance in predicting liver allograft fibrosis development, 162 liver biopsies of 54 pediatric liver transplantation (LT) recipients were assessed at 6 months, 3 years, and 7 years after LT. The proportion of activated HSCs, identified by α-smooth muscle actin (ASMA) immunostaining, and the amount of fibrosis, identified by picrosirius red (PSR%) staining, were determined by computer-based morphometric analysis. Fibrosis was also staged by using the semiquantitative liver allograft fibrosis score (LAFSc), specifically designed to score fibrosis in the pediatric LT population. Liver allograft fibrosis displayed progression over time by PSR% (P < 0.001) and by LAFSc (P < 0.001). The ASMA expression decreased in the long term, with inverse evolution with respect to fibrosis (P < 0.01). Patients with ASMA-positive HSCs area ≥ 8% at 6 months (n = 20) developed a higher fibrosis proportion compared to those with ASMA-positive HSCs area ≤ 8% (n = 34) at the same period of time and in the long term (P = 0.03 and P < 0.01, respectively), but not at 3 years (P = 0.8). ASMA expression ≥ 8% at 6 months was found to be an independent risk factor for 7-year fibrosis development by PSR% (r2 = 0.5; P < 0.01) and by LAFSc (r2 = 0.3; P = 0.03). Furthermore, ASMA expression ≥ 8% at 3 years showed an association with the development of fibrosis at 7 years (P = 0.02). In conclusion, there is a high proportion of activated HSCs in pediatric LT recipients. ASMA ≥ 8% at 6 months seems to be a risk factor for early and longterm fibrosis development. In addition, activated HSCs showed inverse evolution with respect to fibrosis in the long term. Liver Transplantation 22 822–829 2016 AASLD.
Abbreviations
-
- ANOVA
-
- analysis of variance
-
- AR
-
- acute rejection
-
- ASMA
-
- α-smooth muscle actin
-
- CMV
-
- cytomegalovirus
-
- CSA
-
- cyclosporine
-
- EBER
-
- Epstein-Barr early region
-
- EBV
-
- Epstein-Barr virus
-
- HCV
-
- hepatitis C virus
-
- HSC
-
- hepatic stellate cell
-
- LAFSc
-
- liver allograft fibrosis score
-
- LB
-
- liver biopsy
-
- LRD
-
- living related donor
-
- LT
-
- liver transplantation
-
- MMF
-
- mycophenolic mofetil
-
- NS
-
- not significant
-
- PCR
-
- polymerase chain reaction
-
- PFIC
-
- progressive familial intrahepatic cholestasis
-
- PSR%
-
- picrosirius red
-
- PT
-
- portal tract
-
- S
-
- sinusoids
-
- ST
-
- steroids
-
- TAC
-
- tacrolimus
-
- US
-
- ultrasound
Currently more than 90% of the pediatric liver transplantation (LT) recipients become longterm survivors.1, 2 However, liver allograft fibrosis, described as an evolutive process with a longterm incidence of approximately 70%,3, 4 may threaten the outcome of the allograft, particularly in children who have a longer life probability. On the other hand, the concept of cirrhosis as an irreversible course has switched into a dynamic and potentially reversible stage where fibrosis reversion may depend on the removal of exposure to the specific etiology or to effective therapy.5, 6 Fibrosis occurs as a response to persistent parenchymal injury promoting the activation of fibrogenesis, characterized by excessive deposition of collagen in the extracellular matrix.7, 8 The damage of the liver parenchyma triggers the activation and proliferation of the hepatic stellate cells (HSCs), which are in a quiescent state and are the key cells in fibrogenesis. Activated Kupffer cells, aggregated platelets, monocytes, and damaged hepatocytes are sources of platelet-derived growth factor and transforming growth factor–β1, which trigger the intracellular signaling cascades that lead to HSC activation.9 Activated HSCs undergo transdifferentiation to myofibroblast-like cells with the consequent secretion and deposition of collagen type I and III in the damaged liver.10 The intense cytoplasmic α-smooth muscle actin (ASMA) immunoreactivity has been used to identify activated HSCs that show a myofibroblastic phenotype.11 Most of the clinical studies regarding activation of HSCs and fibrosis have been performed in adults with chronic viral hepatitis, some of them following LT secondary to hepatitis C virus (HCV). These studies endorse ASMA as a useful marker to identify the earliest stages of hepatic fibrosis.12, 13 However, scarce information is available regarding the ability of activated HSCs to anticipate fibrosis progression in pediatric LT recipients. To our knowledge, only 1 pediatric study has suggested the usefulness of ASMA expression as a marker of early fibrosis development. The study was performed in 2 living donor LT recipients who ceased immunosuppressant therapy and compared them with 6 patients on immunosuppression.14 Currently, no reports were found to analyze the evolution of activated HSCs over time and their correlation with liver allograft fibrosis in a cohort of pediatric LT recipients.
In a previous study, we designed and validated a semiquantitative liver allograft fibrosis score (LAFSc), which stages fibrosis deposition in the 3 main areas of the liver parenchyma—portal tracts (PTs), sinusoids (S), and centrilobular veins—instead of staging fibrosis only located in the portal triad because it is referred by the classical scores (METAVIR and Ishak scoring). LAFSc was shown to be superior for fibrosis assessment than the classical existing systems.15 Subsequently, we reported the evolution of liver allograft fibrosis in 54 pediatric longterm LT recipients at 6 months, 3 years, and 7 years after LT.4 Fibrosis was categorized by METAVIR and by the LAFSc system and correlated with fibrosis quantification by computer-based morphometric analysis on biopsy specimens stained with picrosirius red (PSR%) staining, which binds to collagen I, II, and III. The findings showed longterm fibrosis progression in 74% of post-LT patients. Consequently, this report analyzes the proportion of ASMA-positive HSCs over time in the previously studied pediatric LT recipients, correlating their evolution with fibrosis, and attempting to determine whether activated HSCs at 6 months after LT could predict allograft fibrosis development at 7 years.
Patients and Methods
The ASMA-positive HSCs area was assessed in the 162 protocol liver biopsies of the 54 previously studied4 pediatric LT recipients (sex ratio 1:1); median age at LT of 1.3 years (range, 0.2-15.7 years) at 6 months, 3 years, and 7 years. Demographic data, LT indication, type of graft, donor age, ischemia time, immunosuppression regimen as well as complications, and clinical evolution are summarized in Tables 1 and 2. The median post-LT follow-up of this series was 8.7 years (range, 7.0-14.5 years).
| Variable | Value |
|---|---|
| Number of patients | 54 (27 boys) |
| Number of liver biopsies | 162 |
| Age at LT, years | 1.3 (0.2-15.7) |
| Weight at LT, kg | 7.7 (3.8-53.7) |
| LT indication | |
| Biliary atresia | 30 (56) |
| PFIC | 9 (17) |
| Metabolic diseases | 8 (15) |
| Tumors | 5 (9) |
| Alagille syndrome | 2 (4) |
| LRD | 29 (54) |
| Deceased donor | 25 (46) |
| Donor age, years | 30.1 (0.4-50.3) |
| Ischemia time, minutes | 169.5 (68-892) |
| LT immunosuppression | |
| TAC+ ST | 24 (44) |
| TAC+ basiliximab | 23 (43) |
| TAC monotherapy | 7 (13) |
- NOTE: Data are given as median (range) or n (%).
| Variables | Periods of Evaluation | ||
|---|---|---|---|
| 0-6 Months | 6 Months to 3 Years | 4-7 Years | |
| Normal liver enzymes | 36 (67) | 41 (76) | 43 (80) |
| AR treated with ST | 22 (41) | 1 (2) | 1 (2) |
| Biliary complications | 13 (24) | 1 (2) | — |
| Vascular complications | 6 (11) | 1 (2) | — |
| Splenomegaly (US measurement) | 36 (66) | 12 (22) | 7 (13) |
| Glomerular filtration rate <90 mL/m | 7 (13) | 2 (4) | — |
| CMV-PCR positive | 9 (17) | — | 2 (4) |
| EBV-PCR positive | 25 (46) | 20 (37) | 26 (48) |
| Gamma-globulins> 15% | 14 (26) | 17 (31) | 26 (48) |
| Positive autoantibodies (>1/40) | 18 (33) | 10 (19) | 8 (15) |
| Lymphoproliferative disease EBER+ | 6 (11) | 4 (7) | — |
| Immunosuppression | 6 Months | 3 Years | 7 Years |
| TAC/ST | 28 (52) | 8 (15) | 2 (4) |
| TAC monotherapy | 22 (41) | 44 (81) | 43 (80) |
| TAC/ST/MMF | 3 (6) | — | 2 (4) |
| TAC/azathioprine | 1 (2) | 1 (2) | 2 (4) |
| CSA/ST/MMF | — | 1 (2) | 1 (2) |
| CSA | — | — | 1 (2) |
| TAC/MMF | — | — | 2 (4) |
| TAC levels, ng/dL | 9.3 ± 1.9 | 3.8 ± 1.9 | 3.0 ± 1.2 |
| CSA levels, ng/dL | — | — | 80 ± 12 |
- NOTE: Data are given as n (%) or mean ± SD.
ASMA Immunohistochemistry and Morphometric Analysis
New tissue samples of the previously studied liver biopsy (LB) specimens categorized according to post-LT follow-up of 6 months, 3 years, and 7 years were serially cut into 5-μm sections from paraffin blocks and processed for PSR% stain and ASMA immunostaining. Each liver section was deparaffinized and rehydrated in graded alcohol. Endogenous peroxidases were blocked by immersion in 3% H2O2 in methanol for 15 minutes. To ensure the optimal antigen retrieval, the slides were submitted to heat-induced epitope retrieval in a citrate buffer (pH 8) for 45 minutes at 100°C. After incubation with 1% bovine serum albumin for 30 minutes (room temperature) to block nonspecific binding sites, sections were incubated for 1 hour at 37°C with specific ASMA-mouse monoclonal primary antibodies (dilution 1:50; Dako, Glostrup, Denmark). Images representing the entire LB specimen were acquired using a 20× objective lens. Large bile ducts, vessels, and technical artifacts were manually excluded before image capture. Computerized analysis calculates the ASMA expression and the fibrosis area, by percentage, on a digitalized image of each LB specimen.16 Image acquisition of each tissue section and image analysis was performed by Axiovision (Carl Zeiss MicroImaging GmbH, Germany) and AxioVision software (AxioVs40 V4.7.1–08-2008; Fig. 1). A cutoff of 3% for ASMA-positive HSCs was assumed as the “normal average” found in healthy livers, as was described in previous publications.17, 18 Briefly, LAFSc score classified fibrosis deposition in PTs, S, and centrilobular areas; fibrosis was staged from 0 to 3 at each area (0 = absent, 1 = mild, 2 = moderate, and 3 = severe fibrosis), with a total score of 9.15 Mild fibrosis was considered to match with LAFSc 1 to 3; moderate fibrosis was considered to match with LAFSc between 4 and 6; and severe fibrosis was considered to match with LAFSc score between 7 and 9. Morphometric analysis and LAFSc categorization obtained at 6 months, 3 years, and 7 years were correlated with the ASMA-positive HSCs proportion. Additionally, the evolution of fibrosis categorized by LAFSc at the main areas of liver parenchyma (sinusoidal, centrilobular, and portal) and its correlation with ASMA expression was analyzed. We also evaluated the relation among ASMA expression with some histological features that could act as persistent liver injury such as portal inflammation, steatosis, necroinflammatory activity (represented by Ludwig score), and interface hepatitis. Their association with allograft fibrosis was addressed in the previous publication.4

Statistical Methods
The statistical software used was SPSS, version 18.0 (IBM, Chicago, IL). Results were expressed as percentage, median, mean and standard deviation, and statistical significance was assumed for P < 0.05. Pearson correlation was performed to evaluate the relationships among ASMA with LAFSc and PSR%. The Shapiro-Wilk test was used to check normal population distribution. Quadratic regression was used to analyze ASMA predictive values.
Results
Liver Allograft Fibrosis
Overall, 162 liver biopsies were reviewed: 4 (2.5%) showed no fibrosis by LAFSc with a mean PSR% of 5.9 ± 2.0; 89 (55%) displayed mild fibrosis (mean PSR% of 10.2 ± 4.9); 59 (36.4%) displayed moderate fibrosis (mean PSR% of 20.6 ± 8.3); and 9 (5.5%) showed severe fibrosis (mean PSR% of 26.8 ± 8.5).
Evolution of Fibrosis Over Time
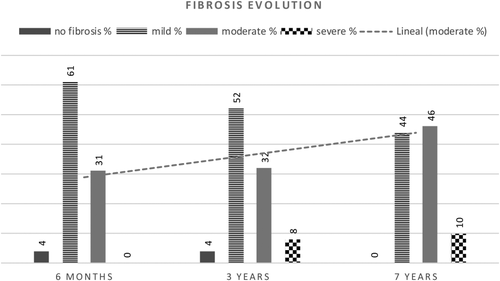
Liver allograft fibrosis displayed progression over time by the 2 methods studied. Fibrosis measured by morphometric analysis showed PSR% mean values of 14.0 ± 7.6, 11.6 ± 6.8, and 19.4 ± 9.6 at 6 months, 3 and 7 years, respectively (analysis of variance [ANOVA], P < 0.001; f = 13.8). The mean values of fibrosis scored by LAFSc were 2.9 ± 1.5, 3.3 ± 1.8, and 4.3 ± 1.8 at 6 months, 3 years, and 7 years, respectively, showing a linear evolution over time (ANOVA, P < 0.001; f = 11.3). Absence of fibrosis was observed in 2 patients at 6 months and 2 patients at 3 years, both of them developed fibrosis in the long term. Figure 2 represents the proportion of fibrosis scored by LAFSc. The evolution of fibrosis by areas categorized by LAFSc showed an overall increment from 6 months to 7 years as follows: sinusoidal 33%, centrilobular 45%, and portal 57%.

Evolution of ASMA-Positive HSCs Over Time
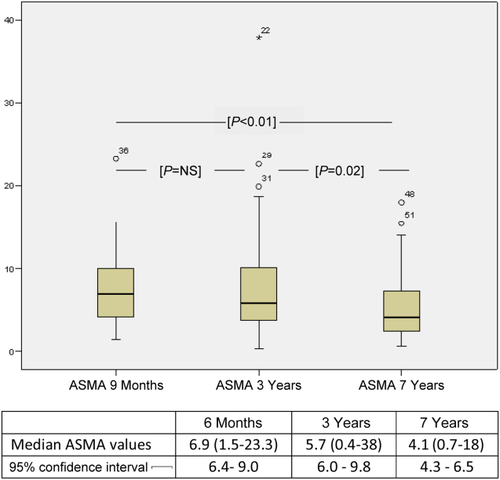
Overall, 46 of 54 (85%) patients did show ASMA expression > 3% at 6 months, 45 (83%) at 3 years, and decreased to 35 (65%) at 7 years. The proportion of ASMA-positive HSCs in the 4 biopsies without fibrosis was between 2.7% and 3.0%. As shown in Fig. 3, the median ASMA-positive HSCs decreased in the long term (P < 0.01), particularly between 3 and 7 years (P = 0.02).

Correlation Between ASMA and Fibrosis
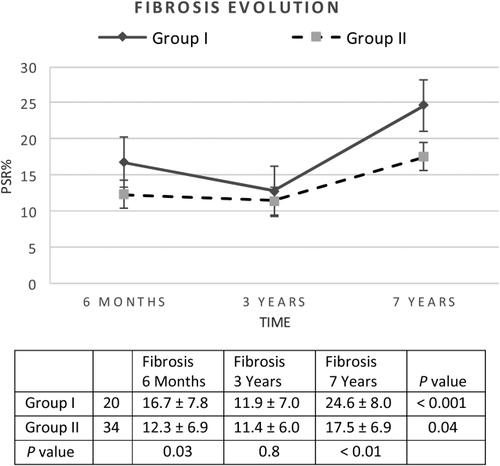
When evaluating the impact of ASMA expression at 6 months on early and longterm fibrosis quantified by PSR%, the analysis revealed that patients with ASMA-positive HSCs area ≥ 8% at 6 months (n = 20) showed a higher proportion of fibrosis compared to those with ASMA-positive HSCs area ≤ 8% (n = 34) at the same period of time and in the long term (P = 0.03 and P < 0.01, respectively), but not at 3 years (P = 0.8; Fig. 4). Nevertheless, ASMA-positive HSCs area ≥ 8% showed association in the early term, middle term, and long term when fibrosis was staged by LAFSc (P = 0.04, P = 0.04, and P = 0.02, respectively). The regression analysis could define values of ASMA ≥ 8% at 6 months as an independent risk factor for 7-year fibrosis development by using PSR% (r2 = 0.5; P < 0.01) as well as with the scores by LAFSc (r2 = 0.3; P = 0.03). Furthermore, ASMA-positive HSCs area ≥ 8% at 3 years showed association with the development of fibrosis at 7 years (P = 0.02).

Histological Features Related to Liver Allograft Fibrosis and ASMA
Table 3 summarizes the histological features that accompany fibrosis at each period of evaluation. Although, the unspecific inflammatory infiltrate showed a clear association with fibrosis at 6 months and 3 years (P < 0.001 and P < 0.001, respectively), ASMA expression did not show correlation with any of the evaluated histological features.
| Histological Features | 6 Months | 3 Years | 7 Years |
|---|---|---|---|
| No fibrosis | 4 (7) | 4 (7) | — |
| Isolated fibrosis | 2 (4) | 6 (11) | 14 (26) |
| Fibrosis + mild portal infiltrate | 6 (11) | 9 (17) | 14 (26) |
| Ductal proliferation | 20 (37) | 21 (39) | 20 (37) |
| Steatosis | 14 (26) | 14 (26) | 10 (19) |
| Unspecific inflammatory infiltrate | 46 (85) | 35 (65) | 27 (50) |
| Cholestasis | 8 (15) | 5 (9) | 1 (2) |
| Interface hepatitis | 9 (17) | 13 (24) | 2 (4) |
| Chronic active hepatitisa | — | 1 (2) | 2 (4) |
- NOTE: Data are given as n (%).
- a Increased liver enzymes with hypergammaglobulins or positive autoantibodies, plus portal inflammation with disruption of limiting plate and lobular hepatitis or plasma cell infiltration.
Discussion
Our study is the first report that analyzes the proportion and evolution of activated HSCs, quantified by ASMA immunostaining, in a cohort of pediatric LT recipients over time and its relationship with the development of fibrosis. Previous studies carried out in adult transplant patients with HCV recurrence have suggested that ASMA expression in posttransplant biopsies (4 months) could represent an early marker that predicts the subsequent development of fibrosis at 1 year.19 Cisneros et al.20 observed a correlation between the rate of fibrosis progression and the number of activated HSCs in LT patients with HCV recurrence compared to those with normal livers. The present analysis differs from the above-mentioned investigations in that the activated HSC assessment (ASMA expression) was performed in protocol liver biopsy specimens at 6 months, 3 years, and 7 years post-LT follow-up and correlated with fibrosis staged by a semiquantitative score (LAFSc) and a quantitative method (morphometric analysis, PSR%) at the same period and in the long term. In addition, none of our patients underwent transplantation due to HCV, avoiding the risk of HCV recurrence because it is a well-known accelerator of hepatic fibrosis.13, 19
As we addressed in a previous report, the liver allograft is exposed in the first months after transplant to more and severe injuries derived from technical and infectious complications as well as immunological events, among others that may have an impact on allograft fibrosis.4 In fact, 92% of children showed some degree of fibrosis development at 6 months, of whom two-thirds corresponded to mild fibrosis and one-third to moderate fibrosis. At the same time, 85% of patients did show high ASMA expression, assuming a cutoff value of 3% for ASMA-positive HSCs as the “normal average” of healthy livers, as has been described by Carpino et al. Indeed, the proportion of ASMA-positive HSCs in the 4 biopsies without fibrosis was <3.0%. Following this early period where the allograft is exposed to frequent parenchymal injuries, it should be noted that the majority of liver biopsies did show fibrosis progression in the long term. Moreover, in the assessment of fibrosis by areas, categorized by LAFSc, an overall increment from 6 months to 7 years was found as follows: sinusoidal areas 33%, centrilobular areas 45%, and portal areas 57%. Nevertheless, when analyzing the fibrosis progression by the most accurate quantitative assessment (PSR%), 2 well-differentiated periods were observed. The first period (between 6 months and 3 years) in which fibrosis did not progress and the second period (between 3 years and 7 years) in which fibrosis again increased. Concomitantly, a spectrum of diverse abnormal allograft histology was observed in most of the liver biopsy specimens, which could stimulate fibrogenesis perpetuation pathways with the consequent fibrosis progression, because infiltrating inflammatory cells also influence fibrogenesis by regulating the fibrogenic potential of resident HSCs.21 Among this wide range of abnormal histology, the unspecific inflammatory infiltrate showed correlation with fibrosis at 6 months and 3 years but not in the longterm. This observation could be explained in that because the fibrosis progressed, the persistent unspecific inflammatory infiltrate decreased from 85% at 6 months to 50% at 7 years. In contrast, the mild portal infiltrate increased from 11% at 6 months to 26% at 7 years.
This study suggests that the presence of a high early ASMA expression could have an early and longterm influence in the development of liver allograft fibrosis in pediatric LT recipients, because patients with ASMA expression ≥ 8% at 6 months developed more fibrosis at both 6 months and 7 years. Regarding the evolution of ASMA expression in the long term and because of the progression of fibrosis, it could be expected to find higher ASMA expression. However, the ASMA expression declines and displays an inverse evolution with respect to the fibrosis. Of interest, the pattern that follows this inverse evolution is parallel to the fibrosis progression observed in the quantitative assessment. In fact, although 83% of patients did show high ASMA values at 6 months, there was a period of ASMA expression stabilization between 6 months and 3 years (85%), and then, concurring with the period in which fibrosis again progressed, the ASMA expression decreased to 65% at 7 years. Consequent with this and assuming allograft fibrosis as a dynamic process with collagen formation and degradation, the older fibrotic tissue that persists longer than a year, characterized by poor cellularity and increased extracellular matrix crosslinking, could make the fibrotic bands more resistant to proteolytic degradation, being a critical determinant of fibrosis irreversibility, as was described recently.22 Moreover, Elastin, another noncollagenous matrix component, may also contribute to the resistance to fibrosis reversion.23
One of the main limitations of the present study has been the absence of liver biopsies in the donor or following the engraftment period, which could have provided information about the ASMA-positive HSCs area before the post-LT injuries could appear. Even more, it could be questioned whether a great number of HSCs present in the donor could promote HSC activation and recruitment to triggering fibrogenesis in the early posttransplant period.
In summary, despite the limitations of this study and the dynamics of fibrogenesis following LT, we have demonstrated that there is a high proportion of activated HSCs in pediatric LT recipients. An ASMA expression ≥ 8% at 6 months seems to be a risk factor for early fibrosis development as well as for development in the long term. In addition, there is an unexpected inverse evolution of the ASMA expression with respect to fibrosis in the long term.
Acknowledgment
The authors thank Santiago Perez-Hoyos, who supervised the statistical analyses.


