Metabolic scaling predicts posthepatectomy liver regeneration after accounting for hepatocyte hypertrophy
This study was supported by the Intramural Research Program of the National Institutes of Health, National Institute of Diabetes and Digestive and Kidney Diseases, project number Z01-DK075059-04.
Potential conflict of interest: Nothing to report.
Abstract
We adapted a mathematical model of posthepatectomy liver regeneration using data from a subset of patients in the Adult-to-Adult Living Donor Liver Transplantation Cohort Study. The original model addressed changes in the number of quiescent, primed, and proliferating cells. Our adapted model takes into account hypertrophy of primed and replicating cells, and it is better able to predict liver volume. In addition, by building off the hypothesis that cell cycle parameters are approximately the same across all mammals, we found that changing only a single parameter characterizing metabolic load could model liver regeneration in 5 species of mammals. In conclusion, we improved a mathematical model of liver regeneration, predicted mammalian liver regeneration based on metabolism, and found correlations between model parameters and physiological measurements from liver donors.
Abbreviations
-
- A2ALL
-
- Adult-to-Adult Living Donor Liver Transplantation Cohort Study
-
- ALT
-
- alanine transaminase
-
- BIC
-
- Bayesian information criterion
-
- CT
-
- computed tomography
-
- DQLFT
-
- Donor Quantitative Liver Function Tests
-
- ECM
-
- extracellular matrix
-
- GF
-
- growth factor
-
- IE
-
- intermediate-early
-
- IL
-
- interleukin
-
- JAK
-
- Janus kinase
-
- LDLT
-
- living donor liver transplantation
-
- M
-
- metabolic load parameter
-
- MMP
-
- matrix metalloprotease
-
- P
-
- primed hepatocyte
-
- Q
-
- quiescent hepatocyte
-
- R
-
- replicating hepatocyte
-
- SOCS3
-
- suppressor of cytokine signaling; SPECT, single-photon emission computer tomography
-
- STAT3
-
- signal transducer and activator of transcription 3
-
- TNF
-
- tumor necrosis factor
Living donor liver transplantations (LDLTs) are increasingly used to treat end-stage liver diseases such as hepatocellular carcinomas, nonalcoholic fatty liver disease, primary sclerosing cholangitis, and others, due to shortages of cadaveric organs. LDLTs have the advantage of proactive treatment before the recipient's condition deteriorates, but rare complications have occurred in donors.
The Adult-to-Adult Living Donor Liver Transplantation Cohort Study (A2ALL) was undertaken to investigate the risks and benefits to LDLT donors and recipients. A subset of donors in the A2ALL study was recruited for a detailed 6-month study of hepatic function and regeneration known as the Donor Quantitative Liver Function Tests (DQLFT) study.1 Liver volume measurements and blood measurements were taken at 4 time points (0 days, 4 days, 3 months, and 6 months after surgery) from these donors.
The DQLFT study was distinct in that it quantified liver regeneration during the initial 2-week period when human livers regenerate most quickly.2-6 These detailed data led us to make improvements in a mathematical model of rat liver regeneration developed by Furchtgott et al.7 and adapted with limited data for human liver regeneration by Periwal et al.8
Finally, liver regeneration has been studied in several other mammals besides humans and rats, such as mice, pigs, dogs, and rabbits. In this study, we tested the hypothesis that only varying the metabolic load parameter (M) between species while keeping all other cell cycle and biochemical parameters constant would allow us to predict liver regeneration in 5 mammalian species: mouse, rat, dog, rabbit, and human.
Materials and Methods
Mathematical Model
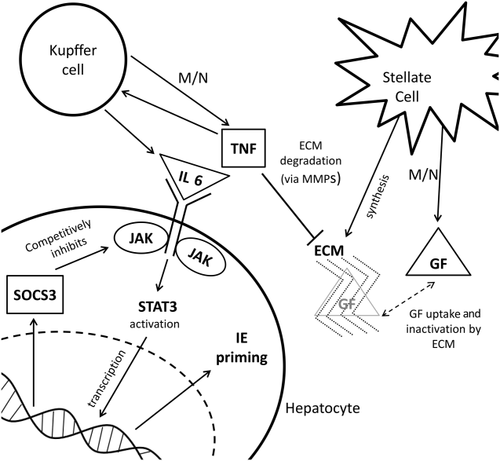
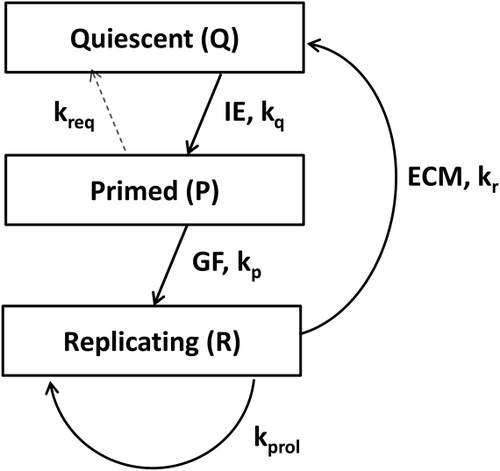
The model of liver regeneration is based on the work of Fausto and Riehle9 and tracks 3 populations of cells: quiescent, primed, and replicating. Hepatocytes transition from a quiescent to a primed state shortly after liver resection, and then they transition to a replicating state. After sufficient liver volume is achieved, the cells return to quiescence. The model replicates the biochemical changes that occur in liver regeneration (Fig. 1). Hepatocytes shift from quiescent to primed because of changes in intermediate-early (IE) gene expression. Growth factors (GFs) shift the cells from primed to replicating whereas extracellular matrix (ECM) accumulation and decreased cytokine and GF secretion returns replicating cells to quiescence (Fig. 2).10
Detailed explanations of the differential equations and parameters can be found in Furchtgott et al.7 We kept virtually all cell cycle and biochemical parameters the same as in this reference. The only parameter we allowed to vary is M. M is a theoretical measure of metabolic demand on the liver, normalized to the original mass of the donor liver. Thus, when a fraction f of the liver remains after surgery, the regeneration process is driven by M/f. This leads to a 1-parameter family of models, with cell cycle duration and transitions that vary when M is changed, and a stronger regenerative impulse for smaller remnant fractions, as demonstrated extensively in Furchtgott et al.7 Given the sparse sampling of time points available for most species, this avoids overfitting the data. Because M is species-dependent, the model shows differences in cell cycle duration between species. We used the adjusted value for kapop (the apoptosis rate parameter) used in Periwal et al.,8 which was 1/24 the rat kapop parameter.
Volume Multipliers
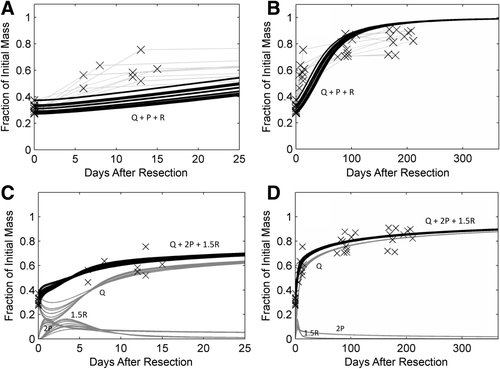
The existing model describes cell number changes, but computed tomography (CT) scans (or other imaging techniques) provide measurements of liver volume. Hypertrophy has also been observed in replicating hepatocytes (Rs).11 Although this hypertrophy is not a concern if the data only covers the beginning and close to the end of the liver regeneration process, the availability of the DQLFT data implies the model must take hypertrophy of cells into account in order to accurately compare cell number predictions with volume measurements. We adapted the model predictions to DQLFT data by including volume multipliers for primed and replicating cells. The model still describes the number of cells in the quiescent hepatocyte (Q), primed hepatocyte (P), or R states, but the volume multipliers allow the model to account for hypertrophy approximately.
The total number of hepatocytes is Q+P+R. To translate cell number to liver volume measurements, we included 2 volume multipliers for primed and replicating cells (2.0 and 1.5, respectively). The total volume of liver is therefore modeled to be Q + 2.0P + 1.5R.
We chose the value of 2.0 for the primed cell volume multiplier because of the assumption that a P about to undergo cell division would be twice as large as a quiescent cell. For replicating cells, we assumed half the cells were about to replicate and therefore twice the size of a quiescent cell, and that half the cells had finished replication and were the size of a quiescent cell. We averaged the 2 values together to get 1.5 for the value of the R cell volume multiplier. We note that this is a crude assumption based on the 2 extremes: a cell about to replicate and a daughter cell that has just been formed. In reality, cell sizes in any state should be modeled with a cell-size distribution, with probabilities for replication dependent on the cell size. Furthermore, the assumption that these volume multipliers are the same between species is a simplifying assumption due to the sparse time sampling of data available, and it is independent of the changes in cell cycle phases and duration that result from each species having a specific M.
Mammalian Data Sets for Model Fitting
Human
No animal or human studies were conducted for this paper. The use of data from the DQLFT study was approved by the A2ALL Cohort study. We used data from the 12 donors in the DQLFT study.1 Two patients were excluded because they were missing all but the initial measurement due to postoperative complications. Two of the 10 patients were missing day 7 measurements but were included. The 8 remaining patients had complete liver fraction measurements taken at 0 days, 7 days, 3 months, and 6 months after surgery. Resections ranged from 62.61% to 72.78%, with a mean of 68.77% and standard deviation of 3.07%.
Rat
Data points were extrapolated from the study by Tanoue et al.12 Seven-week old male Sprague-Dawley rats underwent a 70% hepatectomy, and regeneration was measured in 4-6 rats at each time point 0, 1, 3, and 7 days after surgery.
Mouse
Data points were extrapolated from the study by Shu et al.13 The mice were 8-12 weeks old and underwent a 68% hepatectomy, and regeneration was measured in at least 4 mice at each time point 0, 12, 24, 36, 48, 60, 72, and 96 hours after surgery.
Dog
Data points were obtained from the study by Child et al.14 Six mongrel dogs underwent a 70% hepatectomy, and regeneration was measured 35-57 days after surgery. Because of small sample sizes, liver regeneration was only measured at 1 time point.
Rabbit
Data points were obtained from the study by Fleig et al.15 Rabbits underwent a 60% hepatectomy. Regeneration was measured in 3-6 rabbits at each time point 0, 12, 15, 18, 21, 24, 30, 36, 40, 48, 72, 96, and 168 hours after surgery.
Mathematical and statistical analysis was performed in MATLAB, version 7.12.0 (Mathworks, Natick, MA). Data points from published figures were obtained using the open source DigitizeIt software.
Results
Improved Fit to DQLFT Data
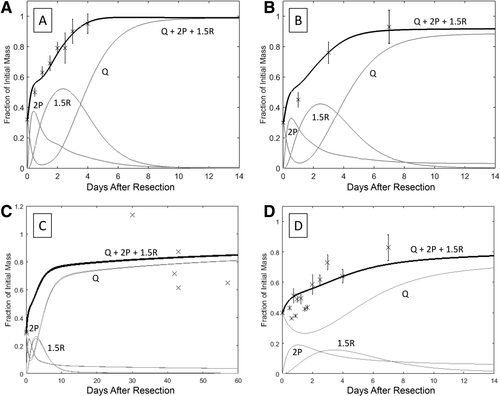
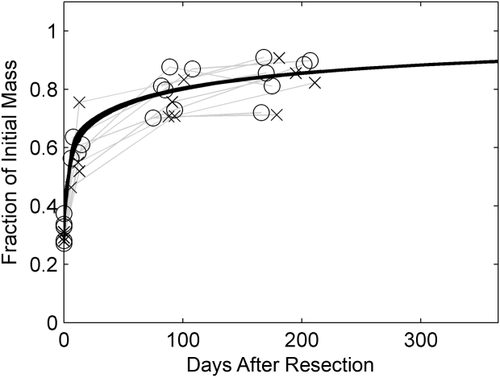
Reverting to using rat cell cycle parameters from Furchtgott et al.7 and optimizing the value of M led to a remarkably improved fit (Fig. 3A-D).
Multispecies Model of Mammalian Liver Regeneration
We hypothesized that because cell cycles are virtually the same among all mammals,16 rat, mouse, dog, rabbit, and human liver regeneration should have the same cell cycle and biochemical parameters. This is in contrast to the naïve scaling employed by Periwal et al.8 Thus, the only thing that needs to be changed in a multispecies model of liver regeneration is M. It should be noted that this parameter is fixed for each species independently and does not depend on an individual subject or animal.
We applied the model to 4 nonhuman species and used an optimized M value for each. Results are shown in Figs. 4 and 5, and the optimized M values are shown in Table 1.
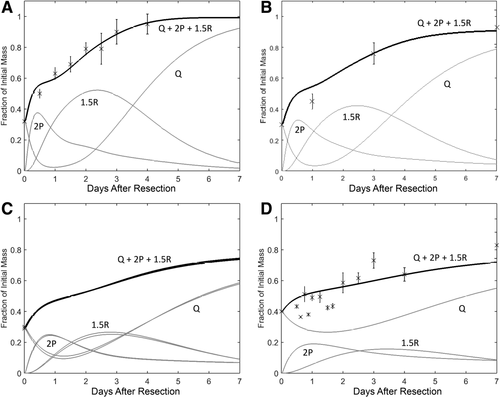
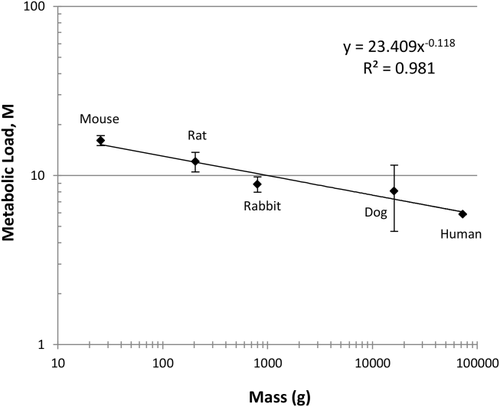
Because metabolic scaling is of great interest, we plotted the metabolic load as a function of the organism's mass (Fig. 6). The plot indicates a simple power law relationship between the metabolic load and mass (n = 5; P < 0.002).
To quantify the improved fit from adding the volume multipliers to the model, we calculated the Bayesian information criterion (BIC) for several species (Table 2).
| BIC With Volume Multipliers | BIC Without Volume Multipliers | |
|---|---|---|
| Human | 135.93 | 135.05 |
| Mouse | 325.11 | 447.55 |
| Rat | 73.23 | 97.87 |
| Total | 534.27 | 680.48 |
- NOTE: Lower BIC denotes a better fit. We were unable to calculate BIC for dog and rabbit due to limitations in data.
Discussion
This study adapted a mathematical model of liver regeneration to translate hepatocyte number to liver mass and found a simple power law scaling in a M of liver regeneration among mammalian species. This power law scaling in the M is cell number independent because it is defined as a metabolic load per hepatocyte and because differences in this parameter's values in distinct species lead to cell cycle differences independent of the fact that the lobes resected, and hence the remnant volume, differs from species to species. Thus, the metabolic scaling we find is independent of the morphology of liver in distinct species, which dictates achievable remnant fractions.
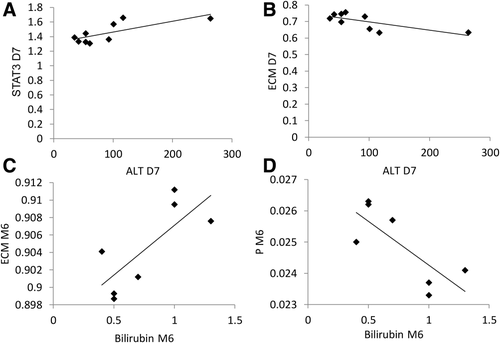
We calculated the correlation between the patient blood measurements from the DQLFT study with our model by using a correlation matrix (Tables 3 and 4; Fig. 7). Only alanine transaminase (ALT) at day 7 and bilirubin at month 6 had correlations with model molecular parameters. As a point of interest, a study of rhesus macaque liver regeneration by Gaglio et al.19 found serum ALT was highest 7 days after surgery.
| Model Parameters |
Day 7 ALT Correlation Coefficient (n = 9) |
P Value |
Month 6 Bilirubin Correlation Coefficient (n = 7) |
P Value |
|---|---|---|---|---|
| TNF | 0.7326 | 0.02 | –0.7598 | 0.048 |
| JAK | 0.7339 | 0.02 | –0.7601 | 0.047 |
| STAT3 | 0.7439 | 0.02 | –0.7615 | 0.047 |
| SOCS3 | 0.7288 | 0.03 | –0.7601 | 0.047 |
| ECM | –0.7195 | 0.03 | 0.7608 | 0.047 |
| IE | 0.7430 | 0.02 | –0.7592 | 0.048 |
| GF | 0.7356 | 0.02 | –0.7604 | 0.047 |
| Q | –0.7200 | 0.03 | 0.7594 | 0.048 |
| P | 0.6903 | 0.04 | –0.7698 | 0.043 |
| R | 0.7324 | 0.02 | ||
| Q+P+R | –0.7040 | 0.03 | 0.7612 | 0.047 |
| Value | σ | |
|---|---|---|
| Day 7 ALT, mean, units/L (n = 9) | 91 | 67 |
| Month 6 bilirubin, mean, mg/dL (n = 7) | 0.7 | 0.3 |
Though our model reasonably predicted liver regeneration in rats and mice, there was a discrepancy between our predictions and experimentally determined timing of DNA synthesis. Weglarz and Sandgren20 examined BrdU-labeled rat and mouse livers after two-thirds partial hepatectomy and found that rat hepatocytes begin DNA synthesis 20 hours after surgery, whereas mouse hepatocytes lag behind, beginning DNA synthesis 32-46 hours after surgery.
Although our model did not directly predict initiation of DNA synthesis, it did model primed cells. Our model predicted that mouse and rat hepatocytes shift into the primed state at about the same time and mouse Ps shift to the replicating state earlier than the rat's. This discrepancy could be due to slight differences in cell cycle kinetics between species. Moreover, we had no data on the ploidy distribution of cells in any of the 3 states in our model. Given such data, it would be possible to include DNA synthesis explicitly in the model dynamics. Our assumption that biochemical and cell cycle parameter differences between species depend only on the parameter M, while providing a reasonably good fit to the available data, could be improved upon with additional time points and more subjects.
We are aware that the accuracy of the M we generated for each species was limited by the data sets available. We recognize that there were only 5 species used, that the data on mouse and rat liver regeneration was averaged, and that there were only 6 dogs and 1 time point in the study by Child et al.14 Nevertheless, the power law scaling of body mass to the liver M is statistically significant and is in contrast to the curvature reported by Kolokotrones et al.21 for metabolism as a whole.
Another limitation of our model is that we posited rough estimates of volume multipliers based on Miyaoka et al.11 A model with variable volume multipliers could not be optimized as available data did not constrain the parameters adequately due to the sparsity of time points (data not shown). With data from more frequent time sampling, the model could be improved to determine these volume multipliers precisely. There may also be species dependence in the volume multipliers that we obviously cannot rule out. As noted, our model takes cell size in the proliferative stage to be a binary variable, with cells either about to replicate or daughter cells that have just been formed. Data on hepatocyte cell size distributions at different time points in the liver regeneration process does not appear to exist. Such data would be required to constrain a model taking continuous cell size distributions into account and would be an experimental tour-de-force involving a large number of animals.
The BIC values in Table 2 show that the model with volume multipliers is very strongly preferred for mouse and rat, but not as strongly for human. This may be because we used the 22% difference between CT/magnetic resonance imaging versus single-photon emission computer tomography (SPECT) estimates of liver volume found by Everson et al.1 as our estimate of the variance in computing the BIC for human, whereas the uncertainty in the animal data is considerably less.
Finally, we found that in contrast to results reported by Pomfret et al.,2 liver regeneration does not differ significantly between males and females. The study by Pomfret et al.2 of 27 male and 16 female living liver donors found that males had a statistically significant, larger percentage of regeneration. However, the DQLFT data and our model showed no difference between liver regeneration among the 4 men and 8 women in the DQLFT study (Fig. 8). The data shown in Marcos et al.4 also does not exhibit a separation between subjects based on sex. It could be that the remnant livers for males were smaller than for females in Pomfret et al.,2 leading to a more rapid regeneration driven by the larger resection rather than by sex.
Future studies could focus on modeling liver regeneration in recipients, sorted by end-stage liver diseases leading the recipient to require a transplant. Recipient liver regeneration occurs at a noticeably faster rate than that of donor liver regeneration,22, 23 and genes for cellular proliferation are up-regulated.24 This could be due to recipients receiving certain immunosuppressive treatments.25, 26
In conclusion, we were able to significantly improve an existing mathematical model of human liver regeneration with a detailed data set1 and simplify the application of this model to different mammalian species.
Acknowledgement
Data from the A2ALL study was the basis of the analysis in this article. This research was supported by the Intramural Research Program of the National Institutes of Health, NIDDK.


