TLR9 regulates the autophagy–lysosome pathway to promote dendritic cell maturation and activation by activating the TRAF6-cGAS-STING pathway
Abstract
Dysregulated maturation and activation of dendritic cells (DCs) play a significant role in the progression of systemic lupus erythematosus (SLE). The autophagy–lysosome pathway has been identified as a potential mechanism to inhibit DC activation and maturation, but its precise workings remain unclear. We investigated the role and regulatory mechanism of TLR9 in modulating the autophagy–lysosome pathway and DCs activation. The mRNA and protein expressions were assessed using qRT-PCR and/or western blot. NZBW/F1 mice was used to construct a lupus nephritis (LN) model in vivo. Cell apoptosis was analyzed by TUNEL staining. Flow cytometry was adopted to analyze DCs surface markers. Lyso-tracker red staining was employed to analyze lysosome acidification. Levels of anti-dsDNA, cytokines, C3, C4, urine protein and urine creatinine were examined by ELISA. The results showed that TLR9 was markedly increased in SLE patients, and its expression was positively correlated with SLEDAI scores and dsDNA level. Conversely, TLR9 expression showed a negative correlation with C3 and C4 levels. Loss-of function experiments demonstrated that TLR9 depletion exerted a substantial inhibition of renal injury, inflammation, and DCs numbers. Additionally, upregulation of TLR9 promoted DCs maturation and activation through activation of autophagy and lysosome acidification. Further investigation revealed that TLR9 targeted TRAF6 to activate the cGAS-STING pathway. Rescue experiments revealed that inactivation of the cGAS/STING signaling pathway could reverse the promoting effects of TLR9 upregulation on DCs maturation, activation, and autophagy–lysosome pathway. Overall, our findings suggested that TLR9 activated the autophagy–lysosome pathway to promote DCs maturation and activation by activating TRAF6-cGAS-STING pathway, thereby promoting SLE progression.
Abbreviations
-
- cGAS
-
- cyclic GMP-AMP synthase
-
- DCs
-
- dendritic cells
-
- ELISA
-
- enzyme-linked immunosorbent assay
-
- IFN
-
- interferon
-
- IL
-
- interleukin
-
- PBMCs
-
- peripheral blood mononuclear cells
-
- SLE
-
- systemic lupus erythematosus
-
- STING
-
- stimulator of interferon genes
-
- TLRs
-
- toll-like receptors
-
- TNF
-
- tumor necrosis factor
-
- TRAF6
-
- tumor-necrosis factor receptor-associated factor 6
-
- TUNEL
-
- terminal deoxynucleotidyl transferase-mediated dUTP nick-end labeling
1 INTRODUCTION
Systemic lupus erythematosus (SLE) is an autoimmune inflammatory connective tissue disease characterized by the deposition of autoantibodies and immune complexes, resulting in multiple organ damage.1 Although anti-inflammatory and immunosuppressive therapies represented by glucocorticoids and immunosuppressants have certain therapeutic effects on SLE, but the long-term outcomes remain suboptimal.2 The pathogenesis of SLE is known to be complex, involving genetic, epigenetic and immune factors; however, the exact mechanisms underlying the disease are not yet fully understood. Dendritic cells (DCs) are highly efficient antigen-presenting cells that play a crucial role in stimulating adaptive immune response and inducing immune tolerance.3 Under normal conditions, DCs exist in two forms, immature DCs and matured DCs. When stimulated, immature DCs can transform into matured DCs, expressing higher MHC II, co-stimulatory factors (e.g., CD25, CD40, CD69, CD80, CD83, and CD86), cytokines factors (e.g., IL-6, IL-10, IL-1β, and TNF-a) and type I interferon (e.g., IFN-α, IFN-γ), disruption of the balance between effector and regulatory T cell responses, and persistent production of autoantibodies by B-cells, which contribute to the progression of SLE.4, 5 Therefore, targeting the abnormal maturation and activation of DCs represents a potential treatment strategy for SLE.
Autophagy is a cellular process in which phagocytic cytoplasmic proteins or organelles are engulfed by vesicles and fused with lysosomes to form autophagolysosomes. This process facilitates the degradation of their contents, thereby fulfilling the metabolic requirements of cells and facilitating organelle renewal.6 Previous reports have shown that deficiency of autophagy-related gene could impede the antigen presentation capability of DCs to T cells and reduce the occurrence of autoimmune encephalomyelitis.7 In addition, the activation of autophagy in DCs is a critical mechanism driving their maturation, resulting in the production of innate cytokines and subsequent promotion of adaptive immune response.8 It was also shown that activation of lysosome function represents a crucial step in autophagy maturation, which promoted DCs to acquire enhanced capability to form and accumulate peptide–MHC class II complexes.9 Lysosome acidification and lysosome mediated degradation are prominent manifestations of activated lysosome functional, facilitating an increase in autophagy flux.10 Therefore, the inhibition of the autophagy–lysosome pathway holds promise for restraining DC activation and maturation during SLE progression, and the underlying mechanisms warrant further investigation.
Toll-like receptors (TLRs) are a highly conserved group of pattern recognition receptors that plays a crucial role in the SLE progression by activating adaptive immunity signaling pathways.11 Among the TLR family, TLR9 is particularly significant in regulating SLE progression by modulating inflammatory responses.12 Studies have reported a significant upregulation of TLR9 in peripheral blood mononuclear cells (PBMCs) of SLE patients, with its expression positively correlated with the SLE disease activity index (SLEDA).12 Moreover, TLR9 was excessively activated in SLE patients, and could lead to over-proliferation of mesangial cells to induce lupus nephritis.13 Rao et al. revealed that elevated TLR9 expression was positively associated with dsDNA in SLE patients and that loss of TLR9 resulted in markedly reduced IL-6, IL-10, and IL-1rα production in B cells.14 Moreover, the elevated TLR9 expression due to NCoR1 depletion was found to sustain a persistent type-I IFN response in DCs by enhancing IFN-β section and activating STAT signaling.15 It has also been proved that TLR9 could stimulate DCs activation by interacting with CD32.16 Collectively, these findings suggest that TLR9 may serve as a key regulator of DC activation and maturation during SLE development. However, the precise regulatory mechanisms underlying TLR9's effects remain unclear.
A previous study has demonstrated that TLR9 triggered the DCs activation by engaging tumor-necrosis factor receptor-associated factor 6 (TRAF6).17 Furthermore, TRAF6 plays a role in activating GMP-AMP synthase (cGAS) by regulating its ubiquitination, and it act as a positive regulator of the cGAS-stimulator of interferon genes (STING) pathway.18, 19 The cGAS-STING signaling pathway represented an essential pattern recognition and effector pathway in the innate immune system. It primarily recognizes cytoplasmic DNA molecules to induce IFN-1 mediated innate host immunity and has been implicated in promoting DCs maturation in SLE.20, 21 In addition, the cGAS-STING signaling pathway was involved in the regulation of autophagy–lysosome pathway.22 Based on the aforementioned evidences, it is hypothesized that TLR9 could activate the cGAS-STING pathway by upregulating TRAF6, thereby driving DCs maturation and activation. Our research provided a theoretical foundation for the development of novel therapeutic strategies targeting SLE.
2 MATERIALS AND METHODS
2.1 Clinical sample collection
Blood samples were collected from a total of 20 female SLE patients who were admitted to the Rheumatology and Immunology Department of Hainan Affiliated Hospital of Hainan Medical University. In addition, blood samples from 20 healthy women were collected as control samples. The diagnostic of SLE was based on the revised classification criteria for SLE established in 1997. Ethical approval for this study was obtained from the Ethics Committee of Hainan General Hospital, Hainan Affiliated Hospital of Hainan Medical University, and all participants provided informed consent prior to their involvement in the study.
2.2 Isolation of PBMCs
Fresh venous blood (5 mL) was collected from each participant using a sodium heparin tube, and the collected blood was thoroughly mixed. PBMCs were isolated and purified using Ficoll-Paque (Sigma–Aldrich, MO, USA). Briefly, the blood was carefully layered onto 5 mL of Ficoll-Paque and centrifuged at 600×g for 20min. The PBMC layer at the interface between the plasma and Ficoll-Paque, was collected and washed with phosphate-buffered saline (PBS). The cell suspension was centrifuged at 300×g for 5 min, and the isolated PBMCs were obtained and prepared for subsequent analysis.
2.3 Enzyme-linked immunosorbent assay (ELISA)
The levels of anti-dsDNA, C3, C4, interleukin (IL)-1β, IL-6, tumor necrosis factor (TNF)-α, IFN-α, urine protein and urine creatinine were measured using specific ELISA kits according to the manufacturer's instructions. The ELISA kits used for each parameter were as follows: anti-dsDNA level, BMASSAY anti-dsDNA ELISA kit (Beijing, China, 37,112); C3 level, Abcam C3 ELISA kit (Cambridge, UK, ab263884); C4 level, Abcam C4 ELISA kit (ab108824); IL-1β level, Solarbio IL-1β ELISA kit (Beijing, China, SEKH-0002); IL-6 level, Solarbio IL-6 ELISA kit (SEKH-0013); TNF-α level, Solarbio TNF-α ELISA kit (SEKH-0047); IFN-α level, Solarbio IFN-α ELISA kit (SEKH-0045); Urine protein level, BMASSAY urine protein detection kit (UPCK-25); Urine creatinine levels, BMASSAY urine creatinine detection kit (ZX-44110-96).
2.4 Animal experiments
All procedures involving animals were carried out strictly according to the guide for the Care and Use of Laboratory Animals, under the approval by the Ethics Committee of Hainan General Hospital, Hainan Affiliated Hospital of Hainan Medical University. A single-stranded CpG-c41 oligonucleotide (5′-TGGCGCGCACCCACGGCCTG-3′) was synthesized and purified by Sangon Biotech (China) and dissolved in saline for experimental use. Belimumab, a B-lymphocyte stimulator (Blys)-specific blocker, was purchased from MedChemExpress (NJ, USA). NZBWF1 female mice at 16 weeks of age were obtained from SJA LABORATORY Animal Co, Ltd. (Hunan, China) and housed in a facility with constant temperature (23 ± °C2) and 12-h light cycle. Proteinuria and body weight were measured weekly during domestication. At 23 weeks of age, the mice were assigned into three groups (n = 8/per group) based on similar average body weight and urine protein level: (1) Control group, in which mice injected with an equal volume of PBS solution; (2) BLys blocker group, in which mice injected intraperitoneally with BLys blocker (5 mg/kg) once a week; (3) TLR9 blocker group, in which mice injected intraperitoneally with TLR9 blocker (CpG-c41, 50 μg) once a week. Weekly injections were administered for the duration of the study. At week 42, all mice were euthanized by cervical dislocation, and samples of blood, urine, kidney and spleen were collected for further analysis.
2.5 Hematoxylin–eosin (HE) staining
The kidney tissue block was fixed in 4% paraformaldehyde for 12 h, followed by embedding in paraffin and cutting into sections of 4 μm thickness. The sections were dehydrated using different concentrations of alcohol. Subsequently, the sections were stained with HE using the instructions provided in the manual of the HE staining kit (Sigma–Aldrich, MO, USA). Finally, the stained sections were observed and analyzed under a microscope (Olympus, Tokyo, Japan).
2.6 Terminal deoxynucleotidyl transferase-mediated dUTP nick-end labeling (TUNEL) staining
The slices of kidney tissues were baked in over at 60°C for 30 min. After washing with PBS solution, the slices were incubated with 50 μL TUNEL mix (consisting of 5 μL enzyme solution and 45 μL label solution, Beyotime Shanghai, China) at 37°C for 1 h in the dark. Subsequently, the slices were further stained with diaminobenzidine (DAB) for 10 min at room temperature. Ultimately, the slices were visualized using a fluorescence microscope (Olympus). The apoptosis ratio was calculated as apoptosis cell number (green)/total cell number (blue) × 100%.
2.7 Isolation of splenic DCs
Spleen cells were isolated as previously illustrated.23 In brief, the spleen from NZBWF1 female mice was dissected into 1 mm3 pieces and digested into a single-cell suspension using collagenase type IV (1 mg/mL, Roche, Basel, Switzerland) and Dnase I (0.1 mg/mL, Roche) in hanks balanced salt solution at 37°C for 30 min. The digestion was terminated by adding 1 nM EDTA. The cell suspensions were then passed through a 100 μm Falcon nylon cell strainer, and the cells were resuspended in PBS. To detect DC subsets, the isolated cells was preincubated with CD11b antibody (Abcam, 1:100, ab8878) and CD11c (Abcam, 1:100, ab254183) antibodies for 30 min at room temperature, and then subjected to flow cytometry analysis (BD, NJ, USA).
2.8 Cell transfection
The full-length TLR9 cDNA was inserted into the LV5 vector (GenePharma, Shanghai, China) at NotI and BamHI sites to construct TLR9 overexpressing lentivirus (lv-TLR9). The short hairpin RNA against TRAF6 (sh-TRAF6, sense: GCAAGTATGAGTGTCCCATCT; antisense: ATGCGCCTGCATCTTCAGTTA) and it is negative control (shNC, sense: UUCUCCGAACGUGUCACGUTT; antisense: ACGUGACAC GUUCGGAGAATT) were designed and obtained from GenePharma (Shanghai, China), and further connected to LV5 vector. The recombinant LV5 vectors (lv-TLR9 vector) and LV5 control vector (Lv-NC) as well as the packaging vectors pGag/Pol and pVSV-G (GenePharma) were co-transfected into HEK293T cells using lipofectamine 3000 (Invitrogen, CA, USA) for 72 h, then the supernatant was collected. Splenic DCs (2 × 10⁴/well) were infected with the repackaged lentivirus combined with polybrene (5 μg/mL) for 24 h. The infected cells were selected using puromycin (1.0 μg/mL).
2.9 Quantitative real-time polymerase chain reaction (qRT-PCR)
- TLR9 (F): CTGCCTTCCTACCCTGTGAG
- TLR9 (R): GGATGCGGTTGGAGGACAA
- MHC II (F): TGGAGCAGATTAAACACGAGTG
- MHC II (R): CCGCCCGGAACTTTCTGAC
- CD80 (F): AAACTCGCATCTACTGGCAAA
- CD80 (R): GGTTCTTGTACTCGGGCCATA
- CD86 (F): CTGCTCATCTATACACGGTTACC
- CD86 (R): GGAAACGTCGTACAGTTCTGTG
- GAPDH (F): GGAGCGAGATCCCTCCAAAAT
- GAPDH (R): GGCTGTTGTCATACTTCTCATGG.
2.10 Western blot
Proteins were isolated from primary splenic DCs using RIPA buffer (Beyotime) and quantified using a BCA kit (Beyotime). Subsequently, a total of 20 μg protein was separated by 10% SDS-PAGE and transferred to a PVDF membrane (Millipore, MA, USA). The membrane was then blocked and incubated overnight with specific primary antibodies against TLR9 (Abcam, 1:1000, ab134368), LC3B (Abcam, 1:2000, ab192890), Beclin 1 (Abcam, 1:1000, ab210498), p62 (Abcam, 1:10,000, ab109012), LAMP1 (Abcam, 1:1000, ab62562), LAMP2 (Abcam, 1:500, ab13524), TRAF6 (Abcam, 1:2000, ab33915), cGAS (Abcam, 1:1000, ab251416), STING (Abcam, 1:1000, ab288157), and GAPDH (Abcam, 1:2000, ab8245). Afterward, the membranes were incubated with a secondary antibody (Abcam, 1:5000, ab7090) for 60 min. The blots were visualized by a GEL imaging system (Bio-Rad, CA, USA) and subsequently analyzed using the ImageJ software.
2.11 Flow cytometry
To assess the maturation and activation of DCs, the cells were washed with PBS containing FBS and 1% HEPES and stained with MHC II (Abcam, 1:100, ab55152), CD80 (Abcam, 1:100, ab134120) and CD86 (Abcam, 1:100, ab239075) antibodies for 30 min at room temperature. Subsequently, the cells were further incubated their corresponding secondary antibodies for 30 min. The detailed information of secondary antibodies used was as follows: MHC II: DyLight® 488 goat anti-mouse IgG (H + L) (Abcam, 1:500, ab96879), CD80: Alexa Fluor® 488 goat anti rabbit IgG (Abcam, 1:2000, ab150081) and CD86: Alexa Fluor® 488 goat Anti-Rabbit IgG H&L (Abcam, 1:2000, ab150077). Finally, the cells were immediately analyzed using flow cytometry (BD, NJ, USA), and FlowJo software was used for analysis.
2.12 Lyso-tracker red staining
Splenic DCs (1 × 10⁶ cells/mL) were incubated with Lyso-tracker red working solution (5 nM, Solarbio) for 30 min at 37°C, After incubation, the cells were stained with DAPI (Solarbio). Following a washing step, the cells were observed under a fluorescence microscope (Olympus).
2.13 Statistical analysis
All the data from three independent experiments were analyzed by the SPSS 19.0 software and expressed as means ± standard deviation (SD). Student t-test or one-way ANOVA was performed to determine the differences among groups. The p-value less than 0.05 was considered statistically significant.
3 RESULTS
3.1 TLR9 was highly expressed in SLE and positively correlated to SLE progression
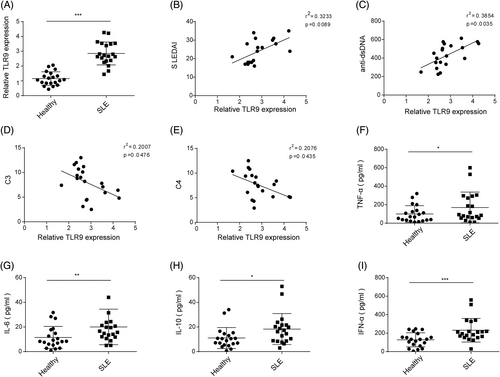
Blood samples were collected from SLE patients (n = 20) and healthy volunteers, and PBMCs were subsequently isolated. The TLR9 expression in PBMCs was found to be significantly higher in SLE patients compared to healthy volunteers (Figure 1A). In addition, a positive correlation was observed between TLR9 expression and dsDNA level and SLEDAI, while a negative correlation was found between TLR9 expression and C3 and C4 levels in clinical samples (Figure 1B–F). Furthermore, the levels of IL-6, IL-10, TNF-α, and IFN-α were significantly increased in the serum of SLE patients compared to healthy volunteers (Figure 1G–I). Collectively, these findings suggested that the upregulation of TLR9 might be associated with the progression of SLE.
3.2 TLR9 knockdown alleviated SLE-induced renal injury
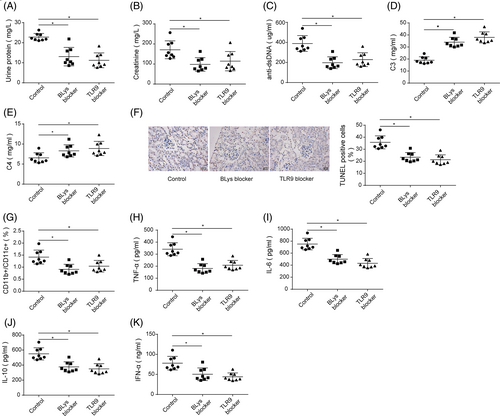
To further investigate the role of TLR9 in SLE, BLys blocker or TLR9 blocker was injected into NZBW/F1 mice. BLys blocker or TLR9 blocker injection reduced urine protein and urine creatinine levels as well as serum dsDNA level of NZBW/F1 mice, accompanied by increased levels of serum C3 and C4 (Figure 2A–E). The TUNEL staining subsequently demonstrated that BLys blocker or TLR9 blocker significantly reduced the rate of renal cell apoptosis in NZBW/F1 mice (Figure 2F). Moreover, the number of CD11b+/CD11c+ DCs in spleen tissues was markedly decreased following the injection of BLys blocker or TLR9 blocker injection (Figure 2G). Additionally, the serum levels of IL-6, IL-10, TNF-α, and IFN-α in NZBW/F1 mice were markedly reduced after BLys blocker or TLR9 blocker injection (Figure 2H–K). These results collectively indicated that the inhibition of TLR9 alleviated renal injury and inflammatory responses in vivo.
3.3 TLR9 overexpression promoted DC maturation and activation
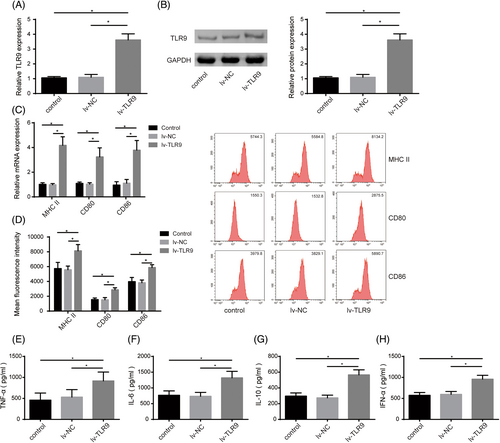
Abnormal maturation and activation of DCs facilitate SLE development.4 To probe the role of TLR9 in regulating DC maturation and activation, we induced TLR9 overexpression in DCs by infecting lv-TLR9. It was first observed that lv-TLR9 transfection significantly increased TLR9 expression level in DCs (Figure 3A,B). Furthermore, TLR9 upregulation markedly facilitated the expressions of MHC II and costimulatory factors (CD80 and CD86) (Figure 3C,D). In addition, the levels of IL-6, IL-10, TNF-α, and IFN-α in the supernatant of DCs were markedly increased by lv-TLR9 infection (Figure 3E-H). Taken together, TLR9 overexpression could accelerate DC maturation and activation.
3.4 TLR9 overexpression promoted DC autophagy and lysosome acidification
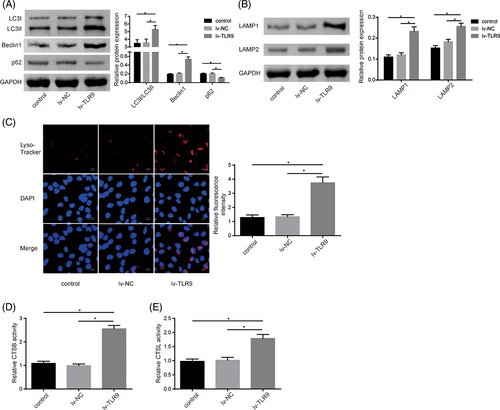
Autophagy–lysosome pathway activation contributes to DC activation and maturation during SLE progression.9 Thus, TLR9 overexpression was induced in DCs, and various indicators of autophagy and lysosomal acidification were subsequently assessed. As shown in Figure 4A, TLR9 overexpression in DCs led to the increases in the LC3II/I ratio and Beclin1 levels, while decreasing the p62 level, suggesting that TLR9 upregulation promoted autophagy flux during DC activation. Meanwhile, TLR9 overexpression significantly elevated the levels of lysosomal membrane proteins (LAMP1 and LAMP2) in DCs (Figure 4B). To further evaluate lysosomal function, Lyso-tracker red staining was performed, demonstrating enhanced lysosome acidification in DCs following TLR9 overexpression (Figure 4C). In addition, TLR9 overexpression markedly increased the activities of lysosome cysteine proteolytic enzymes (CTSB and CTSL) in DCs (Figure 4D,E). In summary, TLR9 overexpression enhanced autophagy activation and lysosome function during DCs activation.
3.5 TLR9 activated the cGAS-STING pathway through TRAF6
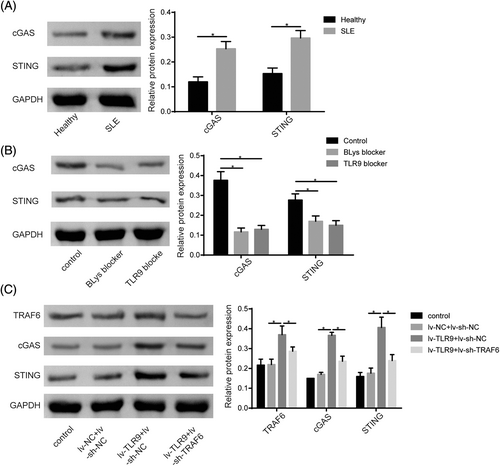
The cGAS/STING pathway was closely related to SLE progression.24 In our study, we observed a significant increase in cGAS and STING protein levels in PBMCs of SLE patients compared to healthy volunteers (Figure 5A). Furthermore, treatment with BLys blocker or TLR9 blocker in resulted in a reduction of cGAS and STING protein levels (Figure 5B). Given that TRAF6 was a downstream mediator of TLR signaling and was reported to positively regulate the cGAS/STING pathway,18 we investigated whether TLR9 could modulate cGAS/STING signaling by the regulation of TRAF6. Western blot assay uncovered that TLR9 upregulation significantly increased TRAF6, cGAS, and STING protein levels in DCs, while this effect was abolished by TRAF6 knockdown (Figure 5C). In conclusion, our findings suggested that TLR9 plays a role in activating the cGAS/STING pathway by acting on TRAF6.
3.6 cGAS-STING pathway inactivation partially reversed the promoting effect of TLR9 overexpression on DC maturation and activation
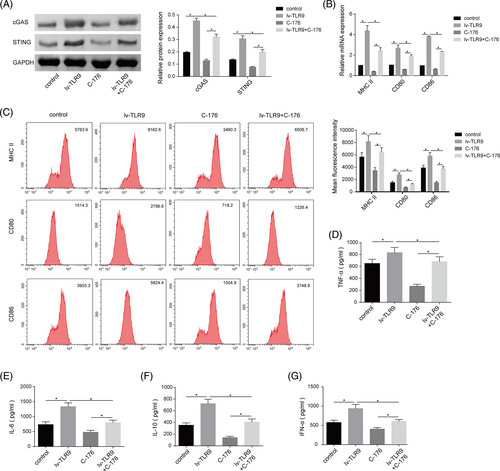
To investigate the functional association between TLR9 and cGAS-STING pathway in regulating DC maturation and activation during SLE development, DCs were transfected with lv-TLR9 or co-treatment with lv-TLR9 + C-176 (cGAS inhibitor). TLR9 overexpression resulted in increased cGAS and STING protein levels in DCs, while C-176 treatment had the opposite effect, effectively abolishing the facilitatory effect of TLR9 upregulation on cGAS and STING levels (Figure 6A). Furthermore, TLR9 upregulation enhanced the expression of MHC II, CD80, and CD86 in DCs, while cGAS inhibition remarkably reduced the expressions of these molecules, which reversed the promoting role mediated by TLR9 overexpression (Figure 6B,C). In addition, TLR9 overexpression significantly promoted the secretion levels of IL-6, IL-10, TNF-α, and IFN-α secretion levels in DCs, while the secretion levels of these cytokines were further reduced by cGAS inhibition (Figure 6D-G). To sum up, TLR9 overexpression promoted DC maturation and activation by activating the cGAS-STING pathway.
3.7 cGAS-STING pathway inhibition abolished the roles of TLR9 on the autophagy–lysosome function of DCs
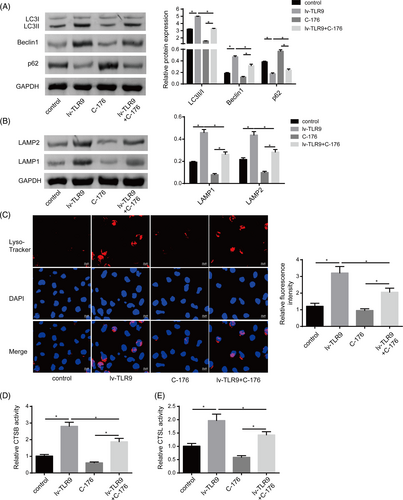
The functional relationship between TLR9 and the cGAS-STING pathway in regulating DC autophagy and lysosome acidification was subsequently investigated. As shown in Figure 7A, TLR9 overexpression exacerbated the LC3II/I ratio and Beclin1 level, while reduced p62 level in DCs, while all these changes were attenuated by cGAS inhibition. Furthermore, cGAS inhibition decreased the levels of lysosomal membrane proteins LAMP1 and LAMP2 levels in DCs, which counteracted the promoting roles of lv-TLR9 on LAMP1 and LAMP2 levels (Figure 7B). Consistent with these findings, Lyso-tracker red staining demonstrated that C-176 treatment inhibited lysosome acidification in DCs, which greatly restrained the promoting effect of TLR9 upregulation (Figure 7C). Moreover, the activities of lysosomal cysteine proteolytic enzymes CTSB and CTSL were enhanced in DCs with TLR9 overexpression, while their levels were further reduced by cGAS inhibition (Figure 7D). Taken together, these results indicated that TLR9 overexpression promoted DCs autophagy and lysosome acidification by activating the cGAS-STING pathway.
4 DISCUSSION
The importance of DCs-targeted therapies in the treatment of SLE has gained recognition.25 Autophagy and lysosomes play crucial roles in various aspects of DCs maturation and activation, such as antigen presentation, migration, and cytokine secretion. Notably, autophagy downregulation in DCs leads to a decrease in antigen presenting ability and reduced production of IFN-1.8 Moreover it is in turn to hampers the activation of efficient T and B cells, resulting in decreased production of autoantibodies and impaired IFN-1 signal transduction.9, 26 However, the underlying mechanism behind this process remains unclear. The key novel findings of the present study reveal that TLR9 activation plays a pivotal role in promoting DCs maturation and activation by activating the autophagy–lysosome pathway through the TRAF6-cGAS-STING pathway.
Previous research has highlighted the correlation between the TLR9 signaling pathway and the pathogenesis of SLE. Specifically, SLE patients with significantly increased TLR9 mRNA levels at the time of initial diagnosis tend to experience a poor short-term prognosis.27 This suggests that TLR9 plays a role in SLE development. It has been described that TLR9 accelerated SLE development by inducing the release of inflammatory factors through activating downstream inflammatory pathways, leading to a cascade of inflammatory reactions.28 Consistent with these findings, our study revealed that TLR9 expression was highly elevated in PBMCs of SLE patients, and its expression positively correlated with dsDNA levels while negatively correlated with C3 and C4 levels in clinical samples. Furthermore, TLR9 knockdown alleviated SLE-induced renal injury in an in vivo model. These results collectively indicated that TLR9 acted as a risk factor promoting SLE progression. Notably, it was previously illustrated that the endosomal DNA sensor TLR9 facilitated anti-dsDNA responses and SLE-like disease by activating IFN-1 signaling and IFN-I-producing DCs.29 Herein, it was observed that TLR9 overexpression facilitated DCs maturation and activation. The function of TLR9 on autophagy and lysosome function has been also studied. For instance, Lisa et al. demonstrated that TLR9 could mediate autophagosome–lysosome fusion.30 In addition, it was previously demonstrated that the activated TLR9 was transported to LAMP1 late endosomes/lysosome in human DCs to induce the production of proinflammatory cytokines and IFN-1, thus accelerating the development of SLE.31, 32 In our paper, it was observed that TLR9 overexpression promoted DCs autophagy and lysosome acidification. Therefore, we concluded that TLR9 upregulation promoted DCs maturation and activation by activating the autophagy–lysosome pathway, thereby accelerating SLE progression.
The role of cGAS-STING signaling in SLE pathogenesis has been widely reported. As proof, studies using Sting−/−MRL/Faslpr mice have shown that the absence of STING leads to more severe disease phenotype,33 while deficiency of cGAS or STING in DNaseII−/− mice reduces lupus-like symptoms.34, 35 Activation of dsDNA-induced cGAS-STING signaling has been identified as a key proinflammatory pathway in SLE progression, contributing to the expression of IFN-1 and proinflammatory cytokines.36 Additionally, TRAF6, an ubiquitin ligase that plays a role in determining cellular signaling, has been implicated as a positive regulator of cGAS-mediated innate immunity. A recent study has revealed that TRAF6 activated cGAS through increasing its polyubiquitination.19 In our study, we found that TLR9 activated cGAS-STING signaling by targeting TRAF6, indicating that the TRAF6-cGAS-STING pathway acted downstream of TLR9 in promoting SLE progression. Moreover, we also elucidated a novel regulatory pathway of TLR9 on cGAS-STING pathway.
The cGAS-STING pathway has been recognized as a crucial link between innate immunity and adaptive immunity by regulating IFN-1-mediated DCs maturation and migration.37 As recently revealed, cGAS-STING activation accelerates the development of SLE by promoting conventional DCs maturation and plasmacytoid DCs differentiation.21 Consistent with these findings, our results also confirmed that cGAS inhibition suppressed DCs maturation and activation, and this inhibition reversed the promoting effect of TLR9 upregulation on DC maturation and activation. The involvement of the cGAS-STING pathway in autophagy and lysosome function has also been investigated. STING-mediated trafficking-induced autophagy was considered a fundamental function of the cGAS pathway.38 Activation of the cGAS-STING pathway could induce aberrant autophagy, leading to aggravated organ injury.39 In the present study, we found that inhibiting cGAS activity suppressed DC autophagy and lysosome acidification, and this inhibition also reversed the promoting effect of TLR9 upregulation on DC autophagy and lysosome acidification.
In summary, our study provides novel insights into the role of TLR9 in promoting SLE progression. Taken together, our research reported for the first time that TLR9 activated the autophagy–lysosome pathway by activating the TRAF6-cGAS-STING pathway, resulting in enhanced DCs maturation and activation. These findings contributed to a comprehensive understanding of the mechanism underlying TLR9's involvement in SLE pathogenesis. Moreover, targeting TLR9 could be a promising therapeutic strategy for SLE treatment. Further research and development of TLR9-targeted therapies may hold potential for improving patient outcomes in SLE.
CONFLICT OF INTEREST STATEMENT
All authors declare no conflict of interest.


