Use of a Physiologically Based Pharmacokinetic Model for Quantitative Prediction of Drug–Drug Interactions via CYP3A4 and Estimation of the Intestinal Availability of CYP3A4 Substrates
Abstract
The purpose of this study was to predict the drug–drug interactions (DDIs) via CYP3A4 by estimating the extent of hepatic CYP3A4 inhibition based on a physiologically based pharmacokinetic (PBPK) model of both substrate and inhibitor and the increase in the intestinal availability (Fg) due to the enzyme inhibition. For the DDIs resulting from reversible inhibition of CYP3A4, the prediction using in vivo Ki values estimated from other clinical DDI studies and predicted in vivo Ki values calculated using the correlation between the log P and the in vivo Ki/in vitro Ki ratio was more accurate than that using in vitro Ki values. Incorporating inhibition of both intestinal and hepatic metabolism resulted in better prediction than that obtained considering inhibition in the liver alone, and all the DDIs (AUC increase by the inhibitor) were predicted within 2-fold accuracy when in vivo Ki values were used. In addition, Fg values were successfully back-calculated from the clinical DDI data based on the present model. In conclusion, the present PBPK model incorporating the in vivo Ki values was found to be useful for quantitative prediction of clinical DDIs and for estimation of the Fg values for CYP3A4 substrates for which intravenous data were not available. © 2015 Wiley Periodicals, Inc. and the American Pharmacists Association J Pharm Sci 104:3183–3193, 2015
Abbreviations
-
- Cb
-
- drug concentrations in the blood
-
- Ch
-
- drug concentrations in the liver
-
- CLh,int
-
- hepatic intrinsic clearance
-
- clog P
-
- computer-calculated log P
-
- CLr
-
- renal clearance
-
- CLtot
-
- total body clearance
-
- DDIs
-
- drug–drug interactions
-
- F
-
- bioavailability
-
- Fa
-
- fraction absorbed
-
- fb
-
- unbound fraction in the blood
-
- fe
-
- fraction of unchanged drug excreted in urine
-
- Fg
-
- intestinal availability
-
- Fh
-
- hepatic availability
-
- fm
-
- contribution of CYP3A4 to the metabolism of the substrate
-
- fp
-
- unbound fraction in the plasma
-
- Ht
-
- hematocrit
-
- Ig
-
- inhibitor concentration in the enterocytes
-
- k12
-
- transfer rate constant from the central compartment to the peripheral compartment
-
- k21
-
- transfer rate constant from the peripheral compartment to the central compartment
-
- ka
-
- absorption rate constant
-
- ke
-
- elimination rate constant
-
- kdeg
-
- the degradation rate constant of CYP3A4
-
- Ki,app
-
- the apparent dissociation constant between CYP3A4 and the inhibitor
-
- kinact
-
- the maximum inactivation rate constant
-
- Kp,h
-
- liver–plasma concentration ratio
-
- PBPK
-
- physiologically based pharmacokinetic
-
- Qh
-
- hepatic blood flow
-
- Rb
-
- blood to plasma concentration ratio
-
- REact,3A4
-
- ratio of the active enzyme relative to the total CYP3A4
-
- Tlag
-
- time-lag in drug absorption
-
- V1
-
- distribution volume of the central compartment
-
- Vh
-
- hepatic volume
-
- Xg
-
- amounts of the drugs in the intestine compartment
-
- Xsub
-
- amounts of the drugs in the peripheral compartment.
INTRODUCTION
CYP3A4 is the major enzyme of the cytochrome P450 family of enzymes, accounting for 82% and 40% of the total P450 enzyme content in the human small intestine and liver, respectively,1 and is the enzyme responsible for the metabolism of more than 50% of the top 200 drugs prescribed in the United States.2 Therefore, drug–drug interactions (DDIs) via the inhibition of CYP3A4 sometimes result in serious problems in clinical practice. Recently, attempts have been made to predict DDIs taking into account interactions in the intestine as well as those in the liver, as the first-pass effect in the intestine greatly contributes to the interactions via CYP3A4.3-5
A previous study suggested that in vivo Ki values estimated from the plasma concentration–time profiles of the substrate in the presence and absence of inhibitor in clinical DDI studies were lower than the in vitro Ki values, and that for DDIs resulting from reversible CYP inhibition, the prediction using in vivo Ki values was more accurate than that using in vitro Ki values.6
In this study, clinical DDI studies involving nine CYP3A4 substrates, which are listed as “in vivo sensitive CYP3A substrates” in the DDI draft guidance published by the United States Food and Drug Administration (US FDA),7 were searched for using the Metabolism Transport Drug Interaction Database (DIDB) established by the University of Washington. Using a physiologically based pharmacokinetic (PBPK) model incorporating the inhibition of both intestinal and hepatic metabolism, the AUC ratios were predicted for interactions involving the six substrates for which intravenous data were available, and the accuracy was compared among the results obtained using the in vivo Ki values estimated from clinical DDI studies, predicted in vivo Ki values and in vitro Ki values. For the remaining three substrates for which intravenous data were not available, the Fg values were back-calculated from the plasma concentration–time profiles obtained with or without inhibitors.
METHODS
Collection of the Pharmacokinetic Data
 ()
()| CLtot | CLr | CLh,intc | kac | V1c | k12c | k21c | Tlag | ||||||||||
|---|---|---|---|---|---|---|---|---|---|---|---|---|---|---|---|---|---|
| Substrate | F | (L/h) | (L/h) | Fh | Fg | Fa | fp | Rb | Kp,h | fmCYP3A4 | (L/h) | (1/h) | (L) | (1/h) | (1/h) | (1/h) | Reference |
| Aprepitant | 0.59 | 4.14 | 0 | 0.957 | 0.744 | 0.828 | 0.0035 | 0.615a | 5.06 | 0.98 | 760 | 0.818 | 85.8 | – | – | 0.922 | 9, 10 |
| (37) | (0.160) | (4.8) | (0.061) | ||||||||||||||
| Dronedarone | 0.04 | 64.2 | 1.54 | 0.351 | 0.114 | 0.996 | 0.003 | 0.628a | 5.09 | 1b | 20,800 | 0.791 | 415 | 0.239 | 0.0238 | 1.09 | 11 |
| (60,200) | (0.625) | (696) | (0.321) | (0.0498) | (0.15) | ||||||||||||
| Eplerenone | 0.69 | 8.26 | 0 | 0.914 | 0.788 | 0.958 | 0.41 | 0.923a | 0.628 | 0.657 | 20.2 | 1.74 | 36.2 | – | – | – | 12 |
| (0.5) | (0.14) | (1.2) | |||||||||||||||
| Ticagrelor | 0.36 | 14.4 | 0.00896 | 0.851 | 0.469 | 0.901 | 0.006 | 0.652 | 3.27 | 0.95 | 1860 | 0.491 | 49.3 | 0.191 | 0.0899 | – | 13 |
| (366) | (0.291) | (31.9) | (0.160) | (0.0686) | |||||||||||||
| Tolvaptan | 0.56 | 25.8 | 0 | 0.733 | 0.952 | 0.802 | 0.02 | 0.51 | 5.12 | 1b | 890 | 0.876 | 108 | – | – | – | 14 |
| (40) | (0.134) | (10) | |||||||||||||||
| Vardenafil | 0.145 | 65.6 | 0 | 0.321 | 0.503 | 0.9 | 0.0534 | 0.817 | 1.50 | 0.9 | 3040 | 1.96 | 206 | – | – | – | 15, 16 |
| (169) | (0.46) | (17) | |||||||||||||||
| CLr | CLh,int | ka | V1 | k12 | k21 | Ki,in vitro | Ki,in vivo | kinact | Ki,app | ||||||||
| Inhibitord | (L/h) | Fg | Fa | fp | Rb | Kp,h | (L/h) | (1/h) | (L) | (1/h) | (1/h) | (μg/L) | (μg/L) | (1/h) | (μg/L) | ||
| Erythromycin | 8.35 | 1.00 | 0.956 | 0.16 | 1 | 0.438 | 356 | 0.434 | 45.0 | – | – | 4.8 | 35,500 | ||||
| Fluconazole | 0.388 | 0.948 | 0.950 | 0.89 | 1 | 0.714 | 0.118 | 0.861 | 60.1 | – | – | 2910 | 5270 | ||||
| Indinavir | 6.59 | 1.00 | 1.00 | 0.4 | 1 | 0.529 | 114 | 2.13 | 41.4 | – | – | 411 | 0.264 | ||||
| Ketoconazole | 0.558 | 1.00 | 1.00 | 0.01 | 0.632 | 5.84 | 1100 | 1.08 | 33.0 | – | – | 10.6 | 0.821 | ||||
| Itraconazole | 1.55 | 1.00 | 0.885 | 0.002 | 0.58 | 6.67 | 10800 | 0.234 | 215 | 0.0797 | 0.0492 | 132 | 0.282 |
- a Calculated using Eq. 1.
- b Assumed to be 1 in consideration of being a sensitive in vivo CYP3A4 substrates.
- c Optimized by fitting analysis [fitted value (calculated S.E.)].
- d Parameters registered in DDI Simulator Ver. 2.1.
Calculation of the Pharmacokinetic Parameters for the CYP3A4 Substrates
The pharmacokinetic parameters of the six substrates for which intravenous data were available (aprepitant, dronedarone, eplerenone, ticagrelor, tolvaptan, and vardenafil) were estimated as follows.
 ()
() ()
() ()
() ()
() ()
() ()
() ()
() ()
()Fitting Analyses of the Blood Concentration–Time Profiles of the CYP3A4 Substrates Based on a PBPK Model
 ()
() ()
() ()
() ()
()
The substrate blood concentration profiles after a single oral administration were fitted into Eqs. 10–13 to obtain the optimized values of CLh,int, ka, V1, k12, k21, and Tlag using Phoenix WinNonlin. The hepatic volume (Vh) was fixed at 1.5 L.
Simulation of the Concentration Profiles of the CYP3A4 Substrates in Interaction Studies with Inhibitors
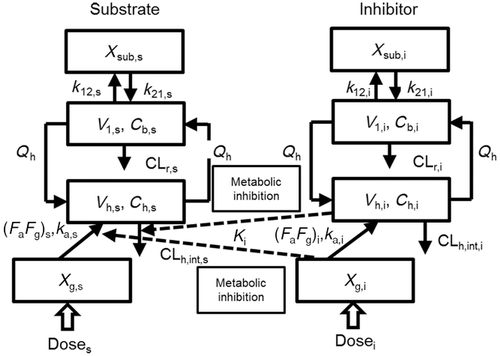
The changes in the concentrations of the substrates due to DDIs were predicted by simulating the concentration profiles of both substrates and inhibitors based on the PBPK model shown in Figure 1. According to this model, the concentration profiles of the substrate and the inhibitor can be expressed by the following differential equations, depending on the inhibition mechanism (reversible or time-dependent) and on whether the intestinal inhibition is incorporated or not. The parameters with subscripts “s” and “i” denote those for the substrate and inhibitor, respectively.
Method 1: Considering only Inhibition in the Liver
-
Reversible inhibition (inhibitors except for erythromycin)
 ()
() ()
() ()
() ()
() ()
() ()
() ()
() ()
() ()
()-
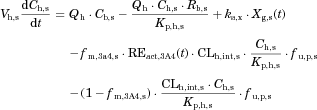
Time-dependent inhibition (erythromycin)
 ()
() ()
()Method 2: Considering Inhibition of both Intestinal and Hepatic Metabolism
 ()
() ()
() ()
()The metabolic Inhibition in the liver was estimated in the same manner as that for method 1. Plasma concentration–time profiles of the substrates with and without co-administration of inhibitors were simulated by the above two methods, and the AUC ratio (AUC increase by the inhibitor) was calculated for each case using DDI Simulator (Version 2.1; Fujitsu Kyushu Systems, Fukuoka, Japan). All the parameters for the substrates and inhibitors used in the analyses are summarized in Table 1. The inhibitor parameters, including the in vivo Ki values, were those registered in DDI Simulator.
Comparison of the Model Predictability
Fitting Analyses of the Blood Concentration–Time Profiles of the CYP3A4 Substrates Based on a PBPK Model with or Without Inhibitor for the Estimation of Fg
For the three substrates (dasatinib, everolimus, and quetiapine) for which the intravenous data were not available, the Fg value was back-calculated from the plasma concentration–time profiles with or without inhibitors. To validate this method Fg estimation, the Fg values of 12 substrates (aprepitant, dronedarone, ticagrelor, tolvaptan, vardenafil, midazolam, triazolam, zolpidem, diazepam, methylprednizolone, alprazolam, and alfentanil) for which intravenous data were available were first back-calculated from the concentration–time profiles obtained with or without inhibitors as follows: The substrate blood concentration profiles with or without inhibitors (ketoconazole or itraconazole) were fitted into Eq. 14 based on the simultaneous analysis of Eqs. 14–21, and 25–27, fixing the hepatic Ki values at those registered as the in vivo Ki in DDI simulator (Table 1), to obtain the optimized values of Tlag,s, CLh,int,s, ka,s, V1,s, k12,s, k21,s and Fg,s. Phoenix WinNonlin was used and the differential equations were numerically solved by using the Livermore Solver for ordinary differential equations for the non-stiff system, with the weight value fixed at 1/y or 1/y 2. Because the back-calculated Fg values for the 12 substrates were comparable to those calculated from the intravenous data using Eq. 5 (see Results section), this method for estimating the Fg was applied for dasatinib, everolimus, and quetiapine.
RESULTS
Fitting Analyses of the Concentration–Time Profiles of the CYP3A4 Substrates
The blood concentration profiles of the CYP3A4 substrates were fitted into Eqs. 10–13 based on the simple PBPK model (Fig. 1) to obtain the optimized values of CLh,int, ka, V1, k12, and k21. All the pharmacokinetic parameters for the substrates used in the analyses are summarized in Table 1 together with those estimated by the fitting analyses. As shown in supplementary Figure 1, the fitted curves for the substrate concentration profiles were close to the observed profiles.
Simulation of the CYP3A4 Substrates Concentration Profiles in Interaction Studies with Inhibitors
The substrate concentration changes due to DDIs were predicted by simulating the concentration profiles of both the substrates and inhibitors using Eqs. 14–27 based on the PBPK model shown in Figure 1, and the AUC ratios were calculated. Figure 2 shows the plasma concentration profiles of aprepitant and vardenafil with or without co-administration of ketoconazole simulated by methods 1 and 2. These two substrates were chosen because their concentration profiles with or without co-administration of typical strong inhibitor, ketoconazole, were available and also the profiles have been more successfully reproduced as compared to other substrates. For both aprepitant and vardenafil, the concentration profiles simulated by method 2, incorporating the inhibition of both intestinal and hepatic metabolism, were closer to the observed concentration profiles than those simulated by method 1, which only considered inhibition in the liver.
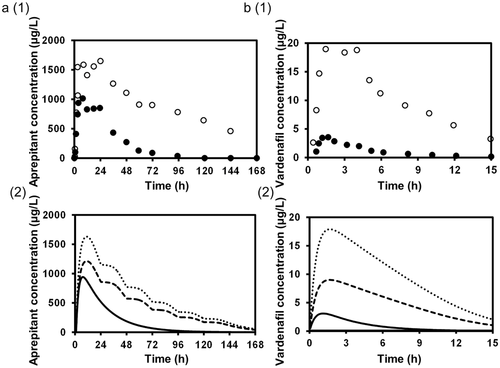
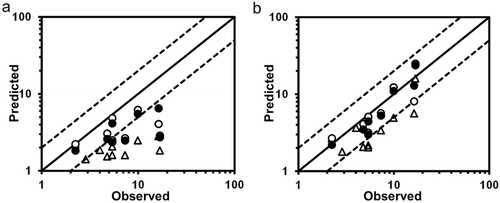
Table 2 summarizes the AUC ratios predicted by methods 1 and 2 using the in vitro Ki, predicted in vivo Ki and in vivo Ki values, and the relationship between the observed and predicted AUC ratios is shown in Figure 3. Method 1, which ignored the inhibition of intestinal metabolism, underestimated the observed AUC ratios in comparison to method 2. The smaller the original Fg of the substrate, the larger the difference tended to be between the observed AUC ratio and that predicted by method 1, and also the larger the prediction improvement by method 2. For the DDIs resulting from reversible inhibition of CYP3A4, the prediction using the predicted in vivo Ki values and in vivo Ki values estimated from clinical DDI studies was more accurate than that using the in vitro Ki values, for both methods 1 and 2. Table 3 shows the comparison of the predictability of the AUC ratios for DDIs resulting from reversible inhibition of CYP3A4. Both the GMFE values (2.11–3.59 and 1.31–1.99 for method 1 and 2, respectively) and RMSE values (6.65–8.14 and 3.02–4.81 for method 1 and 2, respectively) were lower for method 2 than for method 1. These values were lower when predicted in vivo Ki values or in vivo Ki values estimated from clinical DDI studies were used than when in vitro Ki values were used, for both methods 1 and 2. The AUC ratios for 12.5%–50.0% and 25.0%–100% of the eight studies were predicted within a 2-fold accuracy based on method 1 and 2, respectively, and the percentage was higher when predicted in vivo Ki values or in vivo Ki values estimated from clinical DDI studies were used than when in vitro Ki values were used, for both methods 1 and 2.
| AUC Ratio | |||||||||||||
|---|---|---|---|---|---|---|---|---|---|---|---|---|---|
| Predicted | |||||||||||||
| Substrate | Inhibitor | Observed | In vitro Ki | Predicted in vivo Ki | In vivo Ki | ||||||||
| Dose (mg) | Schedule | Dose (mg) | Schedule | Reference | Method 1 | Method 2 | Method 1 | Method 2 | Method 1 | Method 2 | |||
| Aprepitant | 125 | Single dose (day 5) | Ketoconazole | 400 | QD (day1–10) | 4.78 | 9 | 1.53 | 2.06 | 3.05 | 4.10 | 2.59 | 3.48 |
| Dronedarone | 200 | Single dose (day 8) | Ketoconazole | 200 | QD (day 1–8) | 16.8 | 11 | 1.83 | 15.9 | 2.87 | 24.9 | 2.73 | 23.7 |
| Eplerenone | 100 | Single dose (day 7) | Erythromycin | 500 | BID (day 1–7) | 2.87 | 23 | 1.41 | 1.78 | – | – | – | – |
| Eplerenone | 100 | Single dose (day 6) | Fluconazole | 200 | QD (day 1–6) | 2.24 | 23 | 2.22 | 2.68 | 2.22 | 2.68 | 1.83 | 2.20 |
| Eplerenone | 100 | Single dose (day 6) | Ketoconazole | 200 | BID (day 1–6) | 5.39 | 23 | 1.60 | 2.03 | 2.50 | 3.17 | 2.36 | 2.99 |
| Ticagrelor | 90 | Single dose (day 4) | Ketoconazole | 200 | BID (day 1–10) | 7.32 | 13 | 1.59 | 3.38 | 2.66 | 5.66 | 2.48 | 5.28 |
| Tolvaptan | 30 | Single dose (day 2) | Ketoconazole | 200 | QD (day 1–3) | 5.40 | 14 | 2.06 | 2.16 | 4.85 | 5.10 | 4.13 | 4.34 |
| Vardenafil | 20/5 | Single dose (day 4) | Erythromycin | 500 | TID (day 1–4) | 4.02 | 15 | 1.86 | 3.64 | – | – | – | – |
| Vardenafil | 10 | Single dose (day 7) | Indinavir | 800 | TID (day 1–7) | 16.3 | 15 | 2.82 | 5.60 | 4.06 | 8.06 | 6.48 | 12.9 |
| Vardenafil | 20/5 | Single dose (day 4) | Ketoconazole | 200 | QD (day 1–4) | 9.95 | 15 | 2.48 | 4.93 | 6.19 | 12.3 | 5.51 | 11.0 |
| In vitro Ki | Predicted in vivo Ki | In vivo Ki | ||||
|---|---|---|---|---|---|---|
| Method 1 | Method 2 | Method 1 | Method 2 | Method 1 | Method 2 | |
| GMFE | 3.59 | 1.99 | 2.11 | 1.37 | 2.20 | 1.31 |
| RMSE | 8.14 | 4.81 | 7.00 | 4.29 | 6.65 | 3.02 |
| % within 2-fold error | 12.5 | 25.0 | 50.0 | 87.5 | 50.0 | 100 |
- Method 1, the prediction assuming only inhibition in the liver; method 2, the prediction assuming inhibition of both intestinal and hepatic metabolism; GMFE, the geometric mean fold error; RMSE, the root mean square error.
Estimation of Fg for the CYP3A4 Substrates
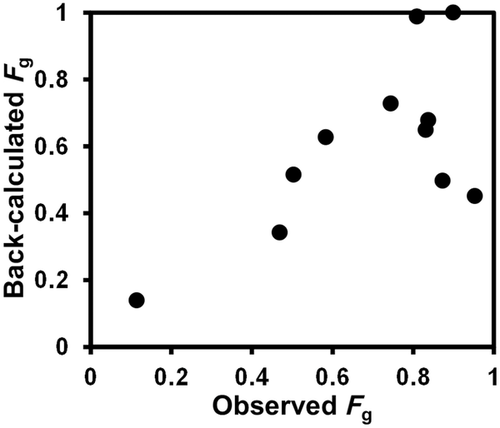
The Fg values of the CYP3A4 substrates for which intravenous data were available were back-calculated from their concentration–time profiles obtained with or without inhibitors (ketoconazole or itraconazole) using the parameters listed in Table 1 and Supplementary Table S1. As shown in Figure 4 and Supplementary Table S2, the back-calculated Fg values were comparable to those calculated from the intravenous data using Eq. 5.
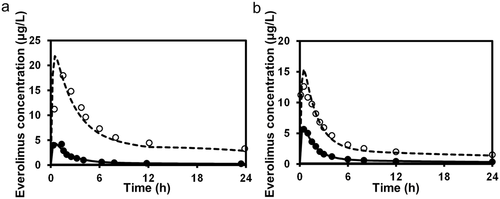
For the three substrates (dasatinib, everolimus, and quetiapine) for which intravenous data were not available, the substrate blood concentration profiles obtained with or without inhibitors (ketoconazole or erythromycin) were fitted into Eq. 14 based on the simultaneous analysis of Eqs. 14-16, 18-21, and 23-27 to obtain the optimized values of Tlag,s, CLh,int,s, ka,s, V1,s, k12,s, k21,s, and Fg,s. The parameters fixed and optimized in the analyses are summarized in Supplementary Tables S1 and S4, respectively. The fitted curves were close to the observed profiles, as shown in Figure 5 (e.g., for the case of everolimus), and the Fg values of dasatinib, everolimus, and quetiapine were estimated as 0.744, 0.219–0.391, and 0.538–0.800, respectively. The values of Fg in the presence of inhibitor, calculated by multiplying those under the control condition and the increase estimated using Eq. 25, reached nearly 1 for all the cases, indicating complete inhibition of the intestinal metabolism in the presence of inhibitor. A larger contribution of inhibition in the intestine in the overall interaction was estimated in the case of a smaller Fg value under the control condition.
DISCUSSION
The present study investigated whether the DDIs via CYP3A4 can be quantitatively predicted by estimating the extent of hepatic CYP3A4 inhibition based on simple PBPK modeling of both the substrate and inhibitor and incorporating the increase in the Fg due to the intestinal enzyme inhibition.
For the DDIs resulting from reversible inhibition of CYP3A4, the prediction using predicted in vivo Ki values and in vivo Ki values was more accurate than that using in vitro Ki values (Table 2 and Fig. 3). The fold difference in the predicted and observed AUC ratios ranged from 0.55 (DDI between eplerenone and ketoconazole) to 1.41 (DDI between dronedarone and ketoconazole) using method 2 with the in vivo Ki, which we think is acceptable. Considering that ketoconazole is involved as an inhibitor in both of the above DDIs, the differences might be associated with the substrate characteristics, such as low bioavailability of dronedarone (4%), but the reasons are unknown.11 Because the prediction using in vitro Ki values underestimated the observed AUC ratios, either predicted in vivo Ki values or in vivo Ki values should be used for a more accurate prediction of DDIs. When the possibility of a candidate compound being a CYP3A4 inhibitor is to be evaluated and its in vivo Ki value is unavailable, use of predicted in vivo Ki values, estimated from the log P and the in vitro Ki value, is recommended.
The AUC ratios for 12.5%–50.0% and 37.5%–100% of the DDI studies were predicted within 2-fold accuracy based on method 1 and 2, respectively, indicating that the prediction by method 2 was more accurate than that by method 1 (Table 3). It is important for quantitative predictions of DDIs via CYP3A4 to take into account the interaction in the intestine as well as that in the liver. In the present study, the increase in the values of Fg due to the intestinal enzyme inhibition was estimated using a static model and incorporated into the PBPK model, whereas the ADAM (Advanced Dissolution Absorption and Metabolism) model is used in other prediction models such as the Simcyp Simulator (Simcyp Limited, Sheffield, UK) for dynamic prediction of intestinal absorption, transport, metabolism and DDIs.26 Although the ADAM model allows for estimation of the intestinal absorption of low-solubility compounds and also the DDI predictions considering the differential distribution of CYP3A4 along the intestine, it requires a large number of input parameters, some of which are not necessarily possible to estimate with accuracy. From that viewpoint, our prediction model with Fg estimation using a static model has the advantage of requiring much fewer parameters.
Four of the CYP3A4 substrates analyzed in the present study (aprepitant, 9 ticagrelor,13 tolvaptan,14, 27 and vardenafil28) are also reported as substrates of P-glycoprotein, and two of the CYP3A4 inhibitors (erythromycin29 and ketoconazole29) are also known to inhibit P-glycoprotein. Although DDIs via P-glycoprotein were not incorporated in the present model, the AUC ratios for DDIs involving these compounds were predicted within 2-fold accuracy by method 2 using in vivo Ki values (Table 3), suggesting a minor contribution of P-glycoprotein inhibition. In addition, membrane transport is unlikely to be a rate-limiting step in the intestinal absorption of a highly permeable and highly soluble drug such as vardenafil.15
For the three substrates (dasatinib, everolimus, and quetiapine) for which intravenous data were not available, the Fg values were back-calculated from the plasma concentration–time profiles obtained with or without inhibitors. To validate this method for Fg estimation, the Fg values of 12 substrates for which intravenous data were back-calculated from the concentration–time profiles obtained with or without inhibitors (ketoconazole or itraconazole). We found that the back-calculated Fg values were comparable to those calculated from the intravenous data (Fig. 4). Several methods of predicting Fg have been reported as follows: Nishimuta et al.30 developed a method for predicting Fg that is applicable to low-permeability compounds based on metabolic clearance from metabolic stability assays using human liver microsomes for CYP3A4 substrates, and the permeability values obtained by parallel artificial permeability assay (PAMPA). Gertz et al.31 reported that Fg can be estimated from interaction studies with grapefruit juice, assuming complete inhibition of CYP3A4-mediated intestinal metabolism and no effects on the hepatic enzymes or the fraction absorbed of the drug. Hisaka et al.32 evaluated the Fg from the changes in the AUC and elimination half-life of the drug caused by DDIs. Because it is important for quantitative predictions of DDIs via CYP3A4 to take into account the increase in the values of Fg, the present method for estimating Fg would be useful for CYP3A4 substrates for which intravenous data are not available. The Fg values of dasatinib, everolimus, and quetiapine were estimated as 0.744, 0.219–0.391, and 0.538–0.800, respectively (Table 4). The Fg values of cyclosporin and midazolam have been estimated to be 0.4–0.79 and 0.29–0.68, respectively, based on intravenous and oral data obtained from different clinical studies,3 both showing 2-fold variation. Therefore, the 1.79-fold and 1.49-fold variation in the Fg values of everolimus and quetiapine, respectively, estimated from different clinical DDI studies, may be regarded as acceptable.
| Substrate | Inhibitor | |||||||||||||||
|---|---|---|---|---|---|---|---|---|---|---|---|---|---|---|---|---|
| Dose | Dose | Observed | Fgb with | Fold Change | CLh,inta | kaa | V1a | k12a | k21a | Tlaga | ||||||
| (mg) | Schedule | (mg) | Schedule | AUC ratio | References | Fag | Inhibitor | in Fg | (L/h) | (l/h) | (L) | (l/h) | (l/h) | (L/h) | ||
| Dasatinib | 20 | QD | Ketoconazole | 200 | BID | 4.84 | 33 | 0.744 | 1.00 | 1.34 | 3360 | 6.00 | 136 | – | – | 1.47 |
| (day 1–6) | (day 1–6) | (0.099) | (375) | (27.50) | (10) | (0.15) | ||||||||||
| Everolimus | 2 | Single dose | Ketoconazole | 200 | BID | 15.3 | 24 | 0.219 | 0.999 | 4.55 | 69.5 | 3.25 | 15.3 | 0.493 | 0.0993 | – |
| (day 5) | (day 1–5) | (0.020) | (7.7) | (0.55) | (2.3) | (0.101) | (0.0164) | |||||||||
| Everolimus | 2 | Single dose | Erithromycin | 500 | TID | 4.52 | 25 | 0.391 | 0.970 | 2.48 | 96.9 | 6.00 | 26.7 | 0.408 | 0.0925 | – |
| (day 5) | (day 1–9) | (0.024) | (14.7) | (1.03) | (1.8) | (0.037) | (0.0170) | |||||||||
| Quetiapine | 25 | Single dose | Ketoconazole | 200 | QD | 6.22 | 34 | 0.538 | 0.999 | 1.86 | 178 | 6.00 | 130 | – | – | 0.326 |
| (day 4) | (day 1–4) | (0.060) | (16) | (4.66) | (13) | (0.086) | ||||||||||
| Quetiapine | 200 | Single dose | Erithromycin | 500 | TID | 2.29 | 35 | 0.800 | 0.995 | 1.25 | 147 | 6.00 | 181 | – | – | 0.0749 |
| (day 4) | (day 1–4) | (0.098) | (9) | (2.70) | (13) | (0.0317) | ||||||||||
- a Optimized by fitting analysis [fitted value (calculated S.E.)].
- b The values of Fg in the presence of inhibitor, calculated by multiplying those under the control condition and the increase estimated using Eq. 25.
In conclusion, the present PBPK model for both CYP3A4 substrates and inhibitors, incorporating the increase in the Fg value due to the intestinal enzyme inhibition, was found to be useful for quantitative prediction of clinical DDIs when combined with the in vivo Ki values. Based on the present PBPK model, the Fg values for CYP3A4 substrates for which intravenous data were not available were also successfully back-calculated using the plasma concentration profiles obtained from clinical DDI studies.


