Joint coverage analysis in progressive collapsing foot deformity
Nicola Krähenbühl and Amy L. Lenz are equally contributed to this study.
Abstract
Progressive collapsing foot deformity (PCFD) is characterized by a progressive subluxation of the peritalar bones and respective joints. Two-dimensional conventional radiographs are limited in their ability to visualize the peritalar bones and joints with adequate detail to describe the complex three-dimensional deformity. An improved understanding of the relationship between joint coverage and deformity would allow clinicians to use coverage analysis to distinguish among the stages of PCFD. The aim of this study was to analyze the joint coverage of the six articular relationships within the talocrural, subtalar, and Chopart joints using weightbearing computed tomography (WBCT) scans. Ten individuals with a flexible hindfoot and ten individuals with a rigid hindfoot presentation of PCFD were compared to twenty-seven asymptomatic control individuals. The three most relevant findings are: (I) the anterior-medial facet of the subtalar joint contains the greatest reduction in coverage for patients with a rigid deformity, (II) an increase in talonavicular overlap (TNO) moderately correlated with a decreased coverage in the: tibiotalar, anterior-medial subtalar, talonavicular joints, and (III) the calcaneocuboid joint lacks radiographic values to adequately quantify alignment and coverage. To conclude, there were significant differences in coverage area of various articulating regions throughout the hind- and midfoot when comparing PCFD patients to asymptomatic control individuals. Relevant radiographic measures correlating to articular coverage areas of clinical interest were identified, possibly helping to better quantify PCFD in clinical practice.
1 INTRODUCTION
Progressive collapsing foot deformity (PCFD), formally known as adult acquired flatfoot deformity, is a complex deformity due to the involvement of soft tissue disorders such as posterior tibial tendon dysfunction, valgus alignment of the hindfoot, abduction of the midfoot, and loss of the medial longitudinal arch.1-3 Hind- and midfoot function relies heavily on the interplay of the peritalar bones and joints.4 Posterior tibial tendonitis is a common presentation of PCFD and is assumed to be a primary cause of the deformity; however, recent research has concluded that dysfunction of the PTT may not be the main cause of deformity in PCFD.4-6 Subluxation of the peritalar bones and joints is also frequently used as a marker for PCFD, specifically the anterior-medial facet of the subtalar joint.7 When treating PCFD clinicians aim to preserve as much peritalar joint motion as possible, yet, joint-sacrificing procedures, such as realignment fusions, are often used to obtain and maintain correction of the deformity in more complex cases.8 However, a fusion is a permanent loss of range of motion and not an optimal first step for less complex PCFD cases.8, 9 It is important to note that greater complexity of the deformity can be associated with secondary findings such as loss of joint flexibility, subfibular impingement, sinus tarsi impingement, and posterior process fractures of the talus.2, 10 Given that surgical planning is dependent on the complexity of the deformity, accurate differentiation using imaging diagnostics is of great interest.
Conventional radiographs may not capture the intricate three-dimensional (3D) nature of the hindfoot due to bony superposition. The subtalar and talonavicular (TN) joints are especially difficult to assess in patients suffering from PCFD.6, 11 Therefore, weightbearing computed tomography (WBCT) is gaining popularity in imaging PCFD patients.12-14 Historically, PCFD has been diagnosed using patient history, physical examinations, alongside two-dimensional (2D) measurements derived either from conventional radiographs or single slice CT images. However, with the recent advancements in 3D WBCT, the assessment of various hind- and midfoot deformities found in PCFD can be performed in greater detail.2, 15, 16 One notable drawback to 3D measurements is the inherent time and training required to reliably measure these values in a clinical setting. Recently developed software obtains semiautomated 3D measurements derived from WBCT scans, making these measures less time-consuming and, therefore, more practical in a clinical setting.11
Although the use of 3D WBCT technology allows for a precise radiographic assessment of PCFD,2 it remains unclear how this information can improve the assessment of PCFD in daily practice. Therefore, the aims of this current study were to (I) quantify the differences in coverage of articulating areas between asymptomatic control individuals and patients with PCFD, (II) correlate coverage values to clinically relevant measures commonly assessed from conventional radiographs, and (III) establish which of those measures could aid in identifying peritalar joint coverage in individuals with PCFD. We hypothesized that subtalar and TN joint articular coverage would be decreased when compared to asymptomatic controls. We additionally hypothesized that clinical presentation of subfibular impingement, sinus tarsi impingement, and posterior process fractures of the talus would be more frequently observed in PCFD patients with comparably lower articular joint coverage (e.g., more complex deformities). We lastly hypothesized that not all commonly used clinical measures would highly correlate with coverage differences noted in patients with PCFD.
2 METHODS
2.1 Data source and study population
In this IRB-approved retrospective cohort study, two groups of 10 individuals were formed, creating the flexible (age: 50.3 ± 14.2 years; 4 females, 10 feet in 10 patients) and rigid (age: 70.1 ± 17.0 years; 9 females, 10 feet in 10 patients) PCFD groups. Additionally, 27 asymptomatic control individuals (age: 50.0 ± 7.3 years; 20 females, 27 feet in 27 patients) were screened for asymptomatic flatfoot deformities and were only included if presenting with an overall neutral hindfoot alignment (Kantonsspital Baselland). Inclusion criteria involved patients with PCFD that failed conservative treatment (physical therapy and orthopedic insoles for at least 6 months).2 Exclusion criteria consisted of patients with any history of foot or ankle trauma, neurologic and/or systemic diseases, coalition, ankle instability, ankle/hindfoot osteoarthritis, midfoot osteoarthritis, or history of hind- or midfoot surgery.2 Differentiation of flexible and rigid PCFD was done via examination by an experienced foot and ankle surgeon. Patients included in the rigid PCFD cohort demonstrated a nonreducible deformity with manual manipulation and an inability to reach a tiptoe position during a single leg heel raise when standing on the affected foot; whereas in the flexible PCFD cohort, the deformity could be reduced, and patients were able to perform a single leg heel raise.2
2.2 Image acquisition and processing
Each participant underwent a WBCT scan in a standing position, with the foot neutrally aligned (Planmed Verify, Planmed Oy, 0.4 mm3 isometric voxels). WBCT images were automatically segmented to create 3D models of the tibia, fibula, talus, navicular, cuboid, and calcaneus (DISIOR Bonelogic Ortho Foot and Ankle 2.1, Helsinki, Finland). These methods have previously been validated.2 Manual segmentation was completed in Mimics 22.0 to refine and finalize the initial automatic segmentations (Mimics 22.0; Materialise). 3D bone models were consistently smoothed and decimated for analysis (3-matic 16.0, Materialise). Lastly, a board-certified orthopedic surgeon screened all WBCT scans for the presence of subfibular impingement, sinus tarsi impingement, and posterior process fractures of the talus.
2.3 Coverage analysis
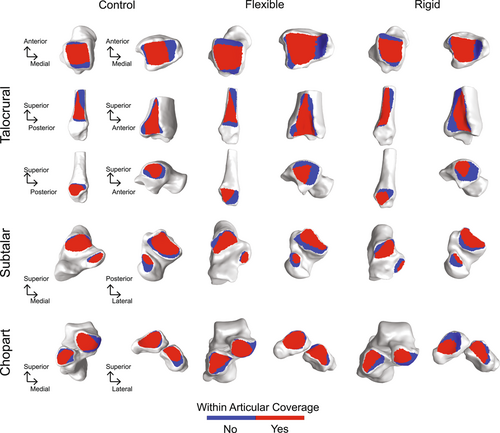
Joint coverage analysis was performed for seven articular relationships of interest within three joint complexes: talocrural joint (tibiotalar, tibiofibular, and talofibular), subtalar joint (anterior/medial, and posterior facets), and the Chopart joint complex (TN and calcaneocuboid [CC]). Within each articular relationship, patient-specific general regions were isolated using consistent 2nd principal curvature thresholds in PostView software (v2.2.0; FEBio). Joint coverage regions were defined as within coverage where the normal vectors intersected between opposing surfaces of the two bones. The resulting joint coverage was reported in surface area (mm2) for each mated region (Figure 1).
2.4 Statistical analysis
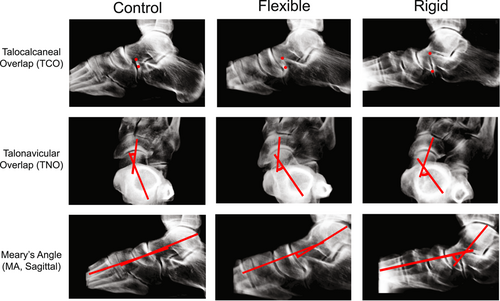
Statistical analysis was performed to evaluate paired articular surface areas within patient groups using a paired t-test and individual coverage surface areas across the three patient groups using an analysis of variance analysis with Tukey's post hoc analysis. Pearson correlation coefficients were calculated to measure the strength of the linear relationships between articulating coverage area and clinically relevant values. The following 3D measures were identified from the DISIOR reports to be clinically relevant for the correlation analysis: talar tilt, Meary's angle (MA; sagittal/axial), lateral talar station, calcaneal inclination angle, hindfoot moment arm, hindfoot alignment angle, talocalcaneal angle (TCA; axial/lateral), TN overlap (TNO), and talocalcaneal overlap (TCO) (Figure 2). A total of 168 linear relationships were evaluated that consisted of 12 clinical measures with respect to 14 joint coverage areas. Pearson correlation coefficients of 0.90−1.00 (−0.90 to −1.00) were considered very high; 0.70−0.90 (−0.70 to −0.90) high; 0.50−0.70 (−0.50 to −0.70) moderate; and 0.00−0.50 (0.00 to −0.50) were low and negligible.17
3 RESULTS
3.1 Talocrural coverage
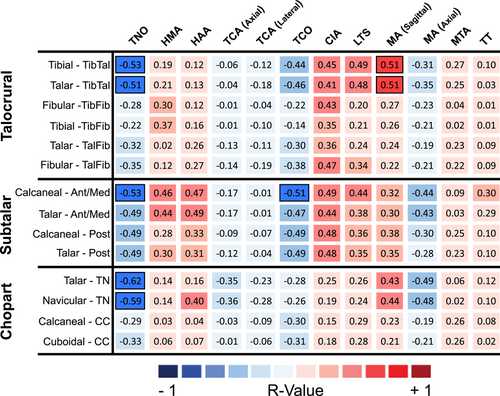
When comparing each of the PCFD groups to the asymptomatic control individuals we found statistically significant joint coverage area reductions within the tibiotalar, tibiofibular, and talofibular joints (Tables 1 and 2). Within the tibiotalar joint we observed talar coverage area reductions of 14% (p = 0.0042) for the flexible PCFD group and 18% (p = 0.0009) for the rigid PCFD group when each was compared to the asymptomatic control individuals. We also observed significant coverage area reductions within the tibiofibular joint for the flexible and rigid PCFD groups when compared to asymptomatic control individuals. The flexible group had a tibial and fibular coverage area reduction of 42% (p = 0.0005) and 36% (p = 0.0001) respectively, while the rigid group had a tibial and fibular coverage area reduction of 18% (p = 0.0047) and 17% (p = 0.0011). When comparing the flexible and rigid PCFD groups, we found that the rigid group had a larger area of joint coverage of the tibiofibular joint; with an increase of 30% (p = 0.0348) on the tibia, and 42% (p = 0.0074) on the fibula. Our talofibular comparisons found statistically significant coverage area reductions for both the flexible and rigid PCFD groups when compared to asymptomatic control individuals. The rigid group had a reduction of fibular coverage area of 18% (p = 0.0056) and talar coverage area by 24% (p = 0.0392) compared to asymptomatic control individuals. Whereas the flexible group only had a fibular coverage area reduction by 23% (p = 0.0097) compared to the asymptomatic control individuals. Talofibular coverage was greater on the talar articular surface for only flexible and rigid patient groups (Table 1 and 2). We found moderate correlation between TNO tibial (−0.53) and talar (−0.51) coverage values, as well as moderate correlation of the MA (sagittal) tibial and talar coverage values (both were 0.51) (Figure 3). Subfibular impingement was clinically observed on WBCT in five out of the ten (50%) rigid PCFD individuals, but none in the flexible cohort.
| Control, mm2 | Flexible, mm2 | Rigid, mm2 | |||||
|---|---|---|---|---|---|---|---|
| Mean | SD | Mean | SD | Mean | SD | ||
| Talocrural joint complex | Tibiotalar joint | ||||||
| Talar coverage | 791.9 | 83.4 | 674.8 | 92.3 | 644.9 | 99.3 | |
| Tibial coverage | 943.2 | 103.6 | 766.4 | 111.7 | 756.4 | 127.4 | |
| Tibiofibular joint | |||||||
| Tibial coverage | 454.0 | 65.5 | 261.6 | 101.2 | 371.5 | 55.4 | |
| Fibular coverage | 570.7 | 83.5 | 365.2 | 130.0 | 474.8 | 78.5 | |
| Talofibular joint | |||||||
| Talar coverage | 316.9 | 67.9 | 262.6 | 70.2 | 261.1 | 67.0 | |
| Fibular coverage | 320.3 | 61.7 | 246.8 | 68.7 | 244.9 | 64.3 | |
| Subtalar joint complex | Anterior-medial facet | ||||||
| Talar coverage | 166.2 | 43.7 | 105.3 | 52.3 | 79.6 | 24.0 | |
| Calcaneal coverage | 157.5 | 44.4 | 106.0 | 51.7 | 82.6 | 24.3 | |
| Posterior facet | |||||||
| Talar coverage | 583.3 | 91.3 | 483.7 | 115.4 | 393.9 | 65.3 | |
| Calcaneal coverage | 549.4 | 91.4 | 402.0 | 104.1 | 363.3 | 63.7 | |
| Chopart joint complex | Talonavicular joint | ||||||
| Talar coverage | 446.3 | 63.7 | 408.1 | 113.4 | 356.6 | 64.3 | |
| Navicular coverage | 510.4 | 75.3 | 474.9 | 126.2 | 417.9 | 83.4 | |
| Calcaneocuboid joint | |||||||
| Calcaneal coverage | 381.0 | 52.1 | 335.3 | 64.5 | 302.6 | 77.8 | |
| Cuboidal coverage | 376.6 | 48.7 | 329.0 | 72.4 | 299.3 | 71.5 | |
| Talocrural joint complex | Subtalar joint complex | Chopart joint complex | |||||
|---|---|---|---|---|---|---|---|
| Tibiotalar | Tibiofibular | Talofibular | Ant-Med Facet | Posterior Facet | Talonavicular | Calcaneocuboid | |
| p Value | |||||||
| Flexible intra | 0.0001 | 0.0002 | 0.0008 | 0.5250 | 0.0001 | 0.0001 | 0.1170 |
| Rigid intra | 0.0001 | 0.0001 | 0.0060 | 0.1010 | 0.0001 | 0.0001 | 0.5125 |
| Control intra | 0.0001 | 0.0001 | 0.3763 | 0.0001 | 0.0001 | 0.0001 | 0.0715 |
| Talar coverage | |||||||
| Flexible versus rigid | 0.5040 | − | 0.9621 | 0.1740 | 0.2990 | 0.2270 | − |
| Flexible versus control | 0.0042 | − | 0.0513 | 0.0050 | 0.0020 | 0.3350 | − |
| Rigid versus control | 0.0009 | − | 0.0392 | 0.0001 | 0.0001 | 0.0001 | − |
| Calcaneal coverage | |||||||
| Flexible versus rigid | − | − | − | 0.2100 | 0.3280 | − | 0.3195 |
| Flexible versus control | − | − | − | 0.0140 | 0.0001 | − | 0.0646 |
| Rigid versus control | − | − | − | 0.0001 | 0.0001 | − | 0.0120 |
| Navicular coverage | |||||||
| Flexible versus rigid | − | − | − | − | − | 0.2490 | − |
| Flexible versus control | − | − | − | − | − | 0.4210 | − |
| Rigid versus control | − | − | − | − | − | 0.0070 | − |
| Fibular coverage | |||||||
| Flexible versus rigid | − | 0.0074 | 0.9485 | − | − | − | − |
| Flexible versus control | − | 0.0001 | 0.0097 | − | − | − | − |
| Rigid versus control | − | 0.0011 | 0.0056 | − | − | − | − |
| Cuboid coverage | |||||||
| Flexible versus rigid | − | − | − | − | − | − | 0.3680 |
| Flexible versus control | − | − | − | − | − | − | 0.0778 |
| Rigid versus control | − | − | − | − | − | − | 0.0080 |
| Tibia coverage | |||||||
| Flexible versus rigid | 0.8550 | 0.0348 | − | − | − | − | − |
| Flexible versus control | 0.0005 | 0.0005 | − | − | − | − | − |
| Rigid versus control | 0.0010 | 0.0047 | − | − | − | − | − |
- Note: Intra-articulation comparisons in the first three rows. Below, group comparisons performed an ANOVA with post hoc analysis. A p-value of less than 0.05 indicates a significant difference between comparisons are in bold.
- Abbreviation: ANOVA, analysis of variance.
3.2 Subtalar coverage
Our subtalar joint coverage area observations revealed statistically significant joint coverage reductions when comparing each of the PCFD groups to asymptomatic control individuals in both the anterior-medial and posterior facets (Table 1 and 2). Within the anterior-medial facet the rigid PCFD group had a reduction of talar coverage of 52% (p = 0.0001) and calcaneal coverage 47% (p = 0.0001) when compared to the asymptomatic control individuals. The flexible PCFD group had similar anterior-medial coverage area reductions with a talar reduction of 37% (p = 0.0050) and a calcaneal reduction of 33% (p = 0.0140) compared to asymptomatic control individuals. Each of the PCFD groups had coverage area reductions within the posterior facet when compared to the asymptomatic control individual group, with the rigid PCFD group talar reduction of 32% (p = 0.0001) and a calcaneal reduction of 34% (p = 0.0001), whereas the flexible group had a talar reduction of 17% (p = 0.0020) and calcaneal reduction of 27% (p = 0.0001). Comparisons of coverage between flexible PCFD and rigid PCFD were not statistically significant for either articulation of the subtalar joint. For the anterior-medial facet, the talar coverage area was significantly greater in the asymptomatic control group compared to the calcaneal coverage area, but no significance was found in the flexible and rigid groups within the articulation. (Table 1 and 2). However, the posterior facet coverage area in the talus was significantly greater when compared to the mated calcaneal surface within each population. Coverage of the anterior-medial facet of the calcaneus moderately correlated to TNO (−0.53), as well as TCO (−0.51) (Figure 3). Sinus tarsi impingement was noted in three of the ten (30%) flexible PCFD patients and eight of the ten (80%) rigid PCFD patients. Additionally, only one of the ten (10%) of the flexible PCFD and four of the ten (40%) of the rigid PCFD patients had a posterior process fracture of the talus with evidence on WBCT scans.
3.3 Chopart joint complex coverage
We found statistically significant coverage area reductions within the TN joint, with a 20% (p = 0.0001) talar reduction and 18% (p = 0.0070) navicular reduction when comparing the rigid PCFD group to the asymptomatic control individuals. No statistical significance was found when comparing the reduction of coverage between asymptomatic controls to flexible PCFD and flexible PCFD to rigid PCFD. TNO correlated moderately to the coverage values for both the talus (−0.62) and navicular (−0.59) (Figure 3). The CC joint coverage area measurements resulted in a 20% reduction of both the calcaneal (p = 0.0120) and cuboidal (p = 0.0080) coverage areas when comparing the rigid PCFD group to asymptomatic controls. Within the TN joint, the navicular coverage area was significantly greater than the talar coverage areas when compared within each population. Within the CC joint, no statistical differences were found in paired coverage areas for any populations. The CC joint had no correlations to any relevant clinical values (Figure 3).
4 DISCUSSION
The aim of this retrospective cohort study was to relate joint coverage within the talocrural, subtalar, and Chopart joints to commonly used clinical measures using WBCT image data of 10 flexible PCFD, 10 rigid PCFD and 27 asymptomatic control individuals that were acquired in a standing position. The three most relevant findings are: (I) the anterior-medial facet of the subtalar joint contains the greatest reduction in coverage for patients with a rigid deformity, (II) an increase in TNO moderately correlated with a decreased coverage in the: tibiotalar, anterior-medial subtalar, and TN joints, and (III) the CC joint lacks radiographic measurements to adequately quantify alignment and coverage.
The clinical and radiographic diagnosis nomenclature for flatfoot deformity has changed numerous times as technology and research have advanced. Many measurements performed on conventional radiographs are available in the literature to assess deformity complexity in the case of PCFD. However, it remains unclear which measurements are useful to identify joint coverage changes with deformity. This information may be critical because it can be assumed that more complex stages of PCFD show progressive joint subluxation (decrease in coverage). Of note, a novel classification system recently introduced by Meyerson et al.13 with 242 unique combinations of their A, B, C, D, and E system, uses several radiographic measurements for subgroup formation. Consolidation of this classification system may be required for clinical use due to the magnitude of variation.18, 19 A recent study evaluated the intra and interobserver reliability of this new system, advocating that the system needs to be refined.19 According to our findings, only a few measurements correlated with peritalar joint coverage, which is contradictory to our hypothesis in which more were hypothesized to strongly correlate. This may show that possibly only a limited number of measurements are useful in the radiographic assessment of PCFD patients.
Clinical factors such as the sinus tarsi and subfibular impingement were identified in efforts to distinguish between flexible and rigid PCFD within the Myerson classification system.10 Our results support our hypothesis that clinical presentation of subfibular impingement and sinus tarsi impingement of the talus would be more frequently observed in rigid PCFD, with the greatest reduction in coverage at both the subtalar and TN joints. Previous work examined the significance of sinus tarsi impingement in this cohort, concluding that this level of impingement raised the probability of predicting deformity progression.2 Subfibular impingement (Class D from Myerson system) was only observed in the rigid PCFD cohort, further demonstrating that PCFD may start with the midfoot first and progress to the hindfoot in more advanced stages.20, 21 A recent study looked exclusively at individuals with Stage 1 (flexible) deformity, finding increased sinus tarsi and subfibular impingement occurrences.1 Due to the lack of rigid PCFD studies within the literature, this recent body of work is the only study to our knowledge that coverage results comparisons can be drawn from in regard to our flexible PCFD cohort.1 A 46% reduction in coverage of the middle facet reported by Dibbern et al.1 is comparable to our 37% coverage reduction from asymptomatic controls to flexible in the anterior/medial facet of the subtalar joint. However, they reported no significant differences in posterior facet coverage, whereas we found a 17% reduction in coverage for flexible PCFD compared to asymptomatic control individuals. Further investigation is required with a larger PCFD study population to determine if individual subtalar facet differences in coverage can be predictive of the progression of deformity within and across stages of PCFD.
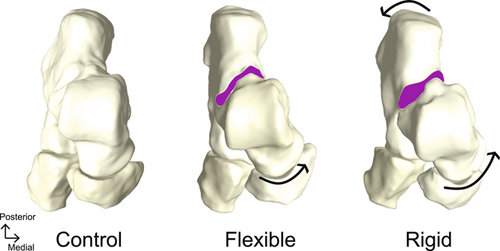
Posterior process fractures of the talus were found in both groups of PCFD, but more were found in the rigid group which supported our hypothesis. Fragments of the talus were visible at the posterior ridge of the calcaneus. The Meyerson et al.10 classification system does not currently take into account posterior process fractures when considering the severity and progression of PCFD. Upon examining digital reconstructed radiographs created within DISIOR, a notable medial shift in the talus was apparent in the rigid PCFD cohort (Figure 4). The posterior process fractures could be a result of this alignment shift. A talar alignment shift also impacts the observed increase in anterior-medial facet subluxation, as well as reductions in the TN joint coverage.22-24 The medial shift of the talus results in a pes planus alignment of the calcaneus, which, due to the interconnectivity of the foot, influences the alignment of the cuboid.9, 25 Interestingly, the CC joint alignment does not have an adequate radiographic measure to quantify alignment with respect to other bones within the joint. While PCFD is commonly thought of as a medial collapse of the midfoot structures, these findings highlight the need to clinically evaluate patients for CC joint malalignment and talar posterior process fractures.
This study was limited to imaging the foot and ankle in a static weightbearing position. Dynamic analyses of this deformity would allow for a better understanding of the progression of collapse and the interconnected role of the anterior-medial facet. Second, structures such as ligaments and tendons were not considered in this analysis. Third, there was also a lack of age matching between the PCFD cohorts and asymptomatic control individuals for this limited sample size. Fourth, articular cartilage was not readily-visible on the WBCT image data. Therefore, all morphology and joint coverage measurements were based on segmented subchondral bone surfaces. As such, the reported joint coverage data should be evaluated with caution. Fifth, patient-reported outcomes were not considered when evaluating flexible and rigid PCFD. Consideration of these metrics could be useful in understanding whether the radiographic stage of deformity correlates with the clinical findings. Lastly, our two defined cohorts consisting of patients with either flexible or rigid PCFD excludes patients that may clinically present with a manually reducible hindfoot and with the inability to perform a single leg heel raise. This patient example would be a combination of flexible and rigid presentations as we define herein. Future studies should consider the inclusion of this additional group to investigate what radiographic and morphological features patients have in this possible intermediate progression of PCFD.
To conclude, there were significant differences in coverage area of various articulating regions throughout the hind- and midfoot when comparing flexible and rigid PCFD to asymptomatic control individuals. Additionally, relevant radiographic measures correlating to articular coverage areas of clinical interest were identified, possibly aiding to better quantification of PCFD complexity in clinical practice. Further studies including statistical shape modeling of the bony morphology and dynamic evaluation of the joints are needed to better understand how the deformity progresses and inform future clinical decision-making processes.
AUTHOR CONTRIBUTION
Kassidy Knutson: Segmentation; joint coverage; statistical analysis; manuscript writing. Andrew C. Peterson: Joint coverage of healthy participants; matlab development; statistical analysis. Rich Lisonbee: Segmentation; writing programs in matlab; statistical analysis. Beat Hintermann: WBCT data gathering and surgeon screening of deformities; manuscript writing. Nicola Krähenbühl: WBCT data gathering and surgeon screening of deformities; manuscript writing. Amy L. Lenz: Grant application; overseeing research; statistical analysis; manuscript writing. The work is not under consideration by any other journal and has not been previously published. The manuscript underwent several revisions with substantial contributions provided by each of the coauthors. The integrity of the work has been guaranteed by each of the coauthors.
ACKNOWLEDGMENTS
The National Institutes of Health supported this work under grant number NIAMS-K01AR080221. The work was also supported by the Peery Research Foundation (University of Utah).
CONFLICT OF INTEREST STATEMENT
The authors declare no conflict of interest.


