Trabecular volumetric bone mineral density of the occipital bone at preferred screw placement sites measured by quantitative computed tomography
Abstract
This study aimed at quantifying trabecular volumetric bone mineral density (vBMD) at the external occipital protuberance (EOP) and the upper cervical spine. A retrospective review of patients who underwent non-contrast enhanced computed tomography of the cervical spine that included the occipital bone up to the EOP between 2007 and 2020 was conducted. Measurements of trabecular vBMD were performed in the occipital midline area, with the region of interest extending 4.5 mm above and below the center of the EOP, as well as the C1 lateral masses and the C2 vertebral body using asynchronous quantitative computed tomography. Eighty-six patients (female, 37.2%) were included for analysis. The patient population was 81.4% Caucasian with a mean ± SD age of 62.3 ± 13.1 years. Total bone thickness at the EOP was 16.7 ± 3.4 mm, with a ratio of trabecular to total bone thickness of 0.44. Trabecular vBMD (mean ± SD) was significantly higher at the EOP than at C1 and C2 (EOP = 612.3 ± 145.8 mg/cm3, C1 average = 290.3 ± 66.5 mg/cm3, C2 = 305.8 ± 78.8 mg/cm3; p < 0.001). A significant strong correlation between trabecular vBMD of C1 and C2 was observed (r = 0.744; p < 0.001), but only low correlations between the EOP and C1 (r = 0.295; p = 0.008) and C2 (r = 0.413; p < 0.001). In individuals > 65 years of age, cervical vBMD was significantly lower, but remained high at the EOP. Clinical significance: Trabecular vBMD at the EOP is significantly higher than at the upper cervical vertebrae and remains high in older populations. Together with morphological information about the occipital bone, these results might be helpful for occipitocervical fixation when deciding about uni- or bicortical screw placement at the EOP.
1 INTRODUCTION
Occipitocervical fixation is performed for numerous pathologies of the craniocervical junction. From a biomechanical point of view surgery aims at restoring alignment and immobilizing the most mobile part of the cervical spine with the goal of achieving solid bony fusion.1, 2 Several techniques were proposed, including bone grafting and wiring,3-5 rods and wiring,6-12 and more rigid internal fixation techniques with plates or rods fixed to the occipital bone with screws.13-15 Oda et al.16 showed that C2 pedicle screws and C1/2 transarticular screws significantly increased the stabilizing effect of occipitocervical constructs compared to sublaminar wiring and lamina hooks. Furthermore, the greatest stability was achieved with a combination of an occipital plate-subaxial rod system and C2 pedicle screws. Fusion rates for this type of fixation were reported to range from 74% to 100% with the use of bone graft.15, 17-21 Several studies investigated the morphology of the occipital bone and concluded that its maximum thickness was at the external occipital protuberance (EOP),22-28 which is a bony landmark easily recognizable on the outer surface and on imaging. Heywood et al.29 suggested the optimal occipital screw length to be 8 mm, which is why safe zones for screw placement were defined based on bone thickness > 8 mm. This was consistently found at the EOP, and to varying degrees 1–2 cm lateral and 1–3 cm inferior to the EOP.24, 26-28 Haher et al.30 showed that bicortical occipital screw fixation resulted in a 50% higher pullout strength than unicortical fixation. However, the pullout strength of unicortical fixation at the EOP was comparable to the pullout strength of bicortical fixation at other locations of the occipital bone. These findings potentially highlight the importance of the trabecular table on screw purchase at the EOP. Low bone mineral density (BMD) is known to be associated with a higher likelihood of instrumentation failure in the cervical spine,31 but no study has determined the trabecular BMD at the EOP in relation to the upper cervical spine.
2 METHODS
Our primary study aim investigated volumetric BMD (vBMD) of the trabecular table at the EOP and the upper cervical vertebrae. Our secondary aim identified age- and sex-related differences in vBMD estimates at these locations. Given the structural differences between occipital and load-bearing cervical bone, we hypothesized that the trabecular table at the EOP has a higher vBMD than at the upper cervical levels that is less prone to age-related changes.
2.1 Patient population
Patients ≥ 18 years of age who were referred to the spine service of a single academic institution and who underwent non-contrast enhanced computed tomography (CT) of the cervical spine that included the occipital bone up to the EOP between July 2007 and November 2020 were considered eligible for this study. Subjects with missing or incomplete imaging of the occipital region, a history of suboccipital craniotomy or craniectomy, past or present fractures or instrumentation at the craniocervical junction, and those with a non-distinguishable trabecular table at the EOP were excluded. Demographic information was retrieved from the local patient data management software and Picture Archiving and Communication Systems (PACS) software and included age, sex, and type of surgery. Approval by the institutional review board of the author's hospital was obtained (#2016-0751), and individual consent for retrospective data analysis was waived. We present this study in accordance with the STROBE reporting checklist.32
2.2 Quantitative computed tomography measurements
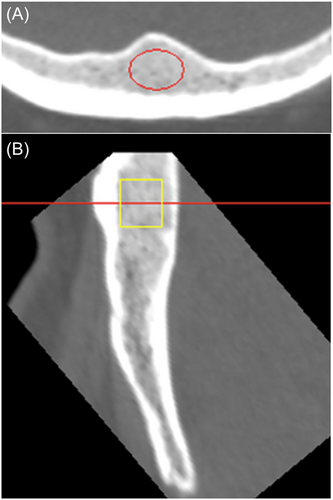
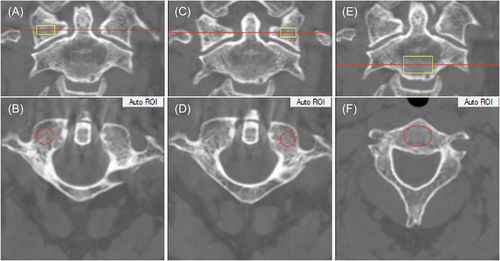
For the assessment of trabecular vBMD phantomless asynchronously calibrated quantitative computed tomography (QCT) measurements were performed using Mindways QCT Pro software (Mindways Software, Inc.).33 This method uses phantom data obtained separately from CT scans to convert volumetric Hounsfield Unit (HU) measurements to vBMD (mg/cm3) estimates using a calibrated conversion factor specific to each CT model and kV setting. Conversion factors were provided by the software manufacturer (Mindways Software, Inc.). Measurements were taken exclusively of trabecular bone at the EOP (Figure 1), both C1 lateral masses and the C2 vertebral body (Figure 2), avoiding apparent sclerotic regions or diploic veins that would influence vBMD estimates. After multiplanar reconstruction of CT images, an elliptical region of interest (ROI) was placed in the midline at the EOP in axial view for the occipital measurements (Figure 1A). In the sagittal view, this resulted in a rectangular ROI of 9 mm in length that was manually adjusted further to cover a potential screw path at the EOP, ideally extending 4.5 mm above and below the region of greatest bone thickness (Figure 1B). A validation study was conducted because QCT measurements of the occipital bone have not been reported before. Two examiners independently conducted occipital and cervical QCT measurements of 20 randomly selected patients in a blinded manner.
2.3 Occipital bone morphology measurements
Measurements of total bone thickness, trabecular and cortical tables were performed on multiplanar reconstructed CT images using PACS software Sectra IDS7 Version 22.1 (Sectra AB). Measurements were taken on axial images oriented perpendicular to the outer cortical table, reflecting the direction of potential screw placement. Measurement points were set in the midline at the EOP.
2.4 Statistical analysis
The Shapiro–Wilk test was used to check for normal distribution of continuous variables, and the paired t-test was used to compare means of continuous variables, with the Bonferroni adjustment for multiple comparisons, as applicable. Correlations were calculated using Pearson's correlation coefficient and associations were investigated using multiple linear regression analysis. For the validation study, ICC estimates and their 95% confidence intervals (CIs) were calculated, with an ICC > 0.90 being considered excellent, 0.80 to 0.90 good, 0.70 to 0.80 acceptable, and < 0.70 poor. Subgroup analyses were performed by sex and age. Statistical analysis was performed with SPSS Statistics version 23.0 (IBM Corp.). Results at a probability value p < 0.05 were considered statistically significant.
3 RESULTS
Cervical CT scans of 320 patients were screened for this study, and 234 patients were excluded. The reasons for exclusion were as follows: EOP not fully included (200 patients), fractures or instrumentation at C1/2 (24 patients), severe sclerosis of the whole C1/2 complex (4 patients), thin trabecular table at the EOP preventing ROI placement (4 patients), multiple bone cysts at the EOP (1 patient), and syndrome-associated hypoplastic cervical vertebrae (1 patient).
In total, 86 patients (female, 37.2%) were included in the final analysis. The patient population was 81.4% Caucasian, with a mean ± SD age at CT of 62.3 ± 13.1 years (Table 1). All but two patients in this study were surgically treated for symptomatic degenerative conditions of the cervical spine. The CT used for measuring vBMD with QCT was performed as a preoperative assessment in 71 cases, of which 53 went on to undergo single- or multilevel anterior cervical discectomy and fusion (ACDF), 15 posterior instrumentation with or without decompression, and 3 anterior-posterior combined procedures. In 13 patients, the CT was performed for early postoperative assessment or during follow-up, in 8 after ACDF, and in 5 after posterior instrumentation with or without decompression. Some cervical levels included focal sclerotic regions at the C1 lateral masses or the C2 vertebral body that were excluded from further analyses because no reasonable ROI could be placed there (Table 2). For the validation study, the ICC of occipital QCT measurements was excellent (0.950; 95% CI 0.871–0.981), and good for the spinal measurements (0.884; 95% CI 0.806–0.931). Total bone thickness at the EOP was 16.7 ± 3.4 mm (range 9.7–25.9 mm), with a ratio of trabecular to total bone thickness of 0.44 (range 0.2–0.7).
| Number of patients | Group | 86 |
|---|---|---|
| Age (years) | Mean (SD) | 62.3 (13.1) |
| Sex (%) | Female | 32 (37.2) |
| Race (%) | Caucasian | 70 (81.4) |
| Hispanic or Latino | 6 (7.0) | |
| Asian | 4 (4.7) | |
| African American | 3 (3.5) | |
| Other or n/s | 3 (3.5) |
- Abbreviations: n/s, not specified; SD, standard deviation.
| Pairwise comparison p-value | ||||||
|---|---|---|---|---|---|---|
| Level | n | vBMD, mg/cm3 (Mean ± SD) | EOP | C1 right LM | C1 left LM | C2 |
| EOP | 86 | 612.29 ± 145.77 | – | |||
| C1 right LM | 79 | 284.41 ± 70.34 | <0.001* | – | ||
| C1 left LM | 79 | 296.1 ± 71.94 | <0.001* | 0.043 | – | |
| C2 | 82 | 305.84 ± 78.8 | <0.001* | 0.002* | 0.156 | – |
- Abbreviations: EOP, external occipital protuberance; LM, lateral mass; SD, standard deviation.
- * Statistical significance after Bonferroni adjustment.
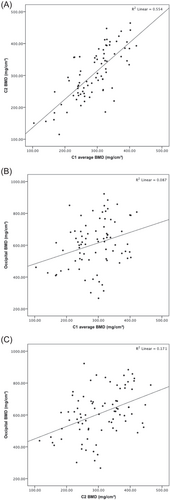
Overall, the trabecular vBMD (mean ± SD) at the EOP was significantly higher than at C1 and C2 (EOP = 612.3 ± 145.8 mg/cm3, C1 average = 290.3 ± 66.5 mg/cm3, C2 = 305.8 ± 78.8 mg/cm3; p < 0.001) (Table 2). A significant strong correlation between trabecular vBMD of C1 and C2 was observed (r = 0.744; p < 0.001), but only a low correlation between the EOP and C1 (r = 0.295; p = 0.008), and C2 (r = 0.413; p < 0.001) (Figure 3). No significant correlations were found between vBMD at the EOP and total bone thickness (r = −0.079; p = 0.467) or trabecular table thickness (r = −0.138; p = 0.204).
3.1 Subgroup analysis
Total bone, trabecular and outer table thicknesses were significantly greater in men (Table 3), as was cervical vBMD (Figure 4A). After adjusting for age and stratifying by sex, the following associations in vBMD were found in men: C1 and C2 (β = 0.769; 95% CI 0.710–1.169; p < 0.001), C1 and EOP (β = 0.402; 95% CI 0.312–1.530; p = 0.004), and C2 and EOP (β = 0.524; 95% CI 0.526–1.442; p < 0.001). In women, the associations in vBMD were as follows: C1 and C2 (β = 0.677; 95% CI 0.367–0.990; p < 0.001), C1 and EOP (β = 0.250; 95% CI −0.349–1.468; p = 0.216), and C2 and EOP (β = 0.461; 95% CI 0.231–1.757; p < 0.001).
| n | Women | Men | p-value | |
|---|---|---|---|---|
| Bone thickness at EOP, mm | ||||
| Total | 86 | 14.7 ± 2.6 | 17.9 ± 3.3 | <0.001 |
| Trabecular table | 86 | 6.7 ± 1.8 | 7.7 ± 1.8 | 0.008 |
| Inner table | 86 | 1.9 ± 0.7 | 2.2 ± 0.7 | 0.183 |
| Outer table | 86 | 6.1 ± 1.9 | 8.0 ± 2.4 | <0.001 |
| Trabecular/total bone thickness | 86 | 0.45 ± 0.10 | 0.44 ± 0.07 | 0.323 |
| vBMD, mg/cm3 | ||||
| EOP | 86 | 641.3 ± 133.1 | 595.1 ± 151.4 | 0.156 |
| C1 average | 79 | 267.7 ± 61.6 | 302.0 ± 66.5 | 0.029 |
| C2 | 82 | 272.8 ± 63.1 | 324.9 ± 81.2 | 0.003 |
- Abbreviations: EOP, external occipital protuberance; vBMD, volumetric bone mineral density.
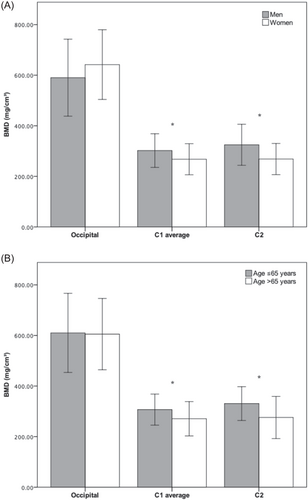
In individuals older than 65 years of age (n = 39), vBMD was significantly lower at C1 (270.47 ± 67.82 vs. 306.83 ± 61.37 mg/cm3; p = 0.015), and C2 (274.51 ± 82.71 vs. 331.59 ± 65.81 mg/cm3; p = 0.001) but remained equally high at the EOP (610.36 ± 137.86 vs. 613.89 ± 153.49 mg/cm3; p = 0.912) (Figure 4B).
4 DISCUSSION
The current study investigated trabecular volumetric BMD at the EOP and C1/2 vertebrae using QCT in patients presenting for cervical spinal surgical consultation. In accordance with our hypothesis, trabecular vBMD at the EOP was significantly higher than cervical vBMD, and only low correlations were found between occipital and cervical vBMD. Compared to cervical vBMD, occipital vBMD did not decrease with advanced patient age, suggesting less susceptibility of occipital bone to age-related metabolic changes. From a clinical standpoint, these findings are of interest regarding occipitocervical fixation. First, low vBMD at the upper cervical spine does not necessarily predict low vBMD at the EOP. Second, the high vBMD at the EOP adds to previous evidence that unicortical screw placement in this area is acceptable and supported through the trabecular table,23, 30 which in our study population accounted for 44% of total bone thickness. To our knowledge, there are no age-related changes in skull thickness after the second decade of life,34 and screw purchase at the EOP primarily depends on the thickness of the outer cortical table. Although complication rates of less than 1% for neural tissue or vascular injuries have been reported for bicortical occipital screws,35 serious complications like penetration of the venous sinuses, intracranial venous thrombosis, or delayed epidural hematoma with a potential fatal outcome were also reported.25, 29, 35, 36 The indication for uni- or bicortical screws at the EOP should be individualized based on measuring bone table thicknesses and possibly trabecular vBMD, and not simply on age, sex, or osteoporosis status in other parts of the body.
Prior studies have investigated occipital BMD in cadaveric and biomechanical studies using dual-energy X-ray absorptiometry (DXA). Papagelopoulos et al.37 investigated lateral and midline plating with 3 bicortical cancellous screws in 12 occiputs. Volumetric BMD was calculated by dividing areal DXA-derived BMD values through the bone thickness measured by calipers. Areal BMD was greater at the midline and showed a moderate but significant correlation with bone thickness, whereas vBMD was greater at the lateral location. In terms of stiffness and axial pullout strength, midline plates provided more rigid fixation than plates fixed laterally. While midline plating allows screw purchase in thicker bone with higher pullout strength,23, 24 torsional strength of midline-only constructs was found to be weaker and screw placement off the midline improved screw loads under lateral bending.38, 39 Das et al.40 reported on DXA performed at the EOP, the superior nuchal line (SNL), and the inferior nuchal line (INL) in 13 cadaveric occiputs. Volumetric BMD was also calculated by dividing DXA-derived values through measured bone thickness and was shown to increase with decreasing bone thickness laterally along the SNL and INL. The authors interpreted their findings by considering that the ratio of cortical bone to trabecular bone increases laterally as total bone thickness progressively thins. Since these studies used DXA and included cortical bone in their BMD measurements, their results are not directly comparable to our trabecular-only vBMD results derived from QCT. The low sample size inherent to cadaveric and biomechanical studies, different locations and areas of DXA measurement, and the anatomic variability in shape and thickness of the occipital squama might affect the reproducibility of DXA measurements in this region. Furthermore, DXA measurements cannot differentiate between cortical and trabecular bone, and results seem highly dependent on the amount of cortical bone measured.
QCT has various advantages over DXA. These include primarily volumetric measurements (in mg/cm3 compared to areal measurements in g/cm2), less susceptibility to degenerative spine changes, and higher sensitivity to changes in bone mass, although DXA remains the international gold standard for the assessment of osteopenia and osteoporosis.41, 42 QCT studies on healthy volunteers showed that significant differences in vBMD exist among cervical, thoracic, and lumbar vertebrae, with cervical vertebrae exhibiting the highest vBMD values for both genders.43, 44 Salzmann et al.45 reported on the regional differences in vBMD of cervical vertebrae and the first thoracic vertebra in 194 patients undergoing ACDF, with the highest vBMD found at C4 and a gradual decrease in vBMD in the caudal direction. Significant correlations in vBMD among all measured levels were observed, with Pearson's correlation coefficients ranging from 0.507 to 0.885. This is in accordance with our results of a strong correlation in vBMD between C1 and C2 (r = 0.744), whereas trabecular vBMD at the EOP showed only a low correlation with cervical vBMD (r = 0.295 – 0.413). Of note, vBMD estimates of C1 and C2 in our study were on average 29.8 mg/cm3 higher than in previous QCT studies.43-45 Our patient population was older with a mean age of 62.4 ± 13.1 years at CT, and approximately one-fourth of patients underwent posterior instrumentation, potentially indicating different degrees of degenerative changes than previously reported. Furthermore, there might have been selection bias among studies in excluding sclerotic regions from QCT analysis. Still, average vBMD estimates at the EOP were more than double as high as cervical vBMD values reported before.
The asynchronous QCT method we used in this study relies on the availability of separately conducted quality assurance (QA) studies with a QA phantom and patient phantom scan containing known H2O and K2HPO4 densities that are specific to each CT scanner and kV setting.33, 46 This allows the derivation of a calibration equation mapping HUs to equivalent values of vBMD in mg/cm3, making CT scans acquired without a phantom available to assess vBMD. Brown et al.33 compared this asynchronous analysis method with and without the presence of a phantom and showed that the phantom itself induced a measurement bias due to X-ray beam hardening, resulting in an upward vBMD bias of 2.3 mg/cm3 for patient scans obtained without a phantom. When directly comparing the asynchronous with the conventional method, mean vBMD values were also significantly higher for the phantomless method (on average 3.7 mg/cm3). Zhao et al.47 reported comparable results using the European spine phantom (ESP) and found small but significant differences in vBMD values between different scanners of the same brand. However, despite being statistically significant, these small differences would likely be clinically irrelevant when simply screening for “normal” versus “osteoporotic” bone in the lumbar spine, as a difference of 40 mg/cm3 would be required according to thresholds published by the American College of Radiology.48 Wang et al.49 performed an accuracy assessment of both QCT methods also using the ESP and showed excellent agreement between the two methods, with correlation coefficients ranging from 0.96 to 0.99. However, the conventional QCT method showed better accuracy for measuring trabecular vBMD in the 200 mg/cm3 ESP L3 vertebra, whereas the asynchronous method had higher accuracy for measuring the 50 and 100 mg/cm3 ESP L1 and L2 vertebrae. As all our vBMD measurements were done on the same cervical CT scan with a fixed kV setting and available calibration equation, it's unlikely that we have introduced additional bias, but given the limitations of the asynchronous QCT method outlined earlier, our findings must be interpreted with appropriate caution.
Our study is the first to selectively analyze the trabecular table at the EOP for vBMD in living patients using QCT. Occipital QCT measurements at the EOP showed excellent interrater reliability, but the higher standard deviation of these measurements is indicative of a larger anatomic variability in this region compared to the cervical spine. During the review of CT images, we observed the trabecular table to appear considerably less dense and more variable below the EOP and around the INL towards the foramen magnum, where no measurements were feasible. Furthermore, the trabecular table gets very thin off the midline and below the INL to be reasonably investigated with QCT, highlighting possible limitations this technique has in a clinical setting. We decided to measure vBMD at the EOP in cervical and not cranial CT scans to rely on the same CT parameters (type of scanner, kV) for all measurements and because availability of additional cranial CTs was scarce in this spinal patient population. This approach inevitably led to a high number of patients being excluded from analysis for not having the EOP fully included in the cervical CT scan. We were unable to relate our results to surgical outcome data in terms of occipitocervical fixation failure, but QCT analysis might be integrated as a useful adjunct in future research on this topic.
5 CONCLUSION
To the author's knowledge, this is the first study to investigate trabecular vBMD at the EOP and compare it to C1 and C2 using asynchronous QCT. Although the EOP is characterized by considerable anatomic variability among individuals, the trabecular table in this location has a significantly higher vBMD than the upper cervical vertebrae. Furthermore, and in contrast to the cervical spine, trabecular vBMD at the EOP remains high in aged populations. These results add to previous studies and suggest that unicortical screw fixation in this area might also be considered in patients of advanced age, potentially reducing the risk of injury to the venous sinuses.
ACKNOWLEDGMENTS
The authors would like to thank Jeffrey Keenan Brown, PhD for technical support throughout the study.
CONFLICTS OF INTEREST
MM, DAA, IO, LO, and JS, have no relevant financial or nonfinancial interests to disclose. JAC declares financial interests: Consulting: Covera Health; Globus Medical, Inc; Image Biopsy Lab; Pfizer, Inc; Simplify Medical; Scientific Advisory Board: Carestream, Image Analysis Group. AAS declares financial interests: Royalties: Ortho Development Corp; Private investments: Vestia Ventures MiRUS Investment LLC, ISPH II LLC, ISPH 3 LLC, VBros Venture Partners X Centinel Spine; Consulting: Clariance Inc, Kuros Bioscience AG, Medical Device Business Services Inc; Speaking and Teaching Arrangements: DePuy Synthes Products Inc; Trips/Travel: Medical Device Business Services Inc; Research Support: Spinal Kinetcs Inc. FPC declares financial interests: Royalties: NuVasive Inc; Private investments: Bonovo Orthopedics Inc, Healthpoint Capital Partners LP, ISPH II LLC, Ivy Healthcare Capital Partners LLC, Medical Device Partners II LLC, Medical Device Partners III LLC, Orthobond Corporation, Spine Biopharma LLC, Tissue Differentiation Intelligence LLC, VBVP VI LLC, Woven Orthopedics Technologies; Consulting: 4Web Medical/4Web Inc, Spine Biopharma LLC, Research Support: 4Web Medical/4Web Inc, Beatrice & Samuel A. Seaver Foundation; nonfinancial interests: Scientific Advisory Board: Healthpoint Capital Partners LP, Orthobond Corporation, Spine Biopharma LLC, Woven Orthopedic Technologies. FPG declares financial interests: Royalties: NuVasive Inc, Ortho Development Corp, Zimmer Biomet Holdings INC; Stock Ownership: Bonovo Orthopedics Inc, Liventa Bioscience (AF Cell Medical), Paradigm Spine LLC, Healthpoint Capital Partners LP, Alphatec Holdings LLC, LANX Inc, Centinel Spine Inc (fka Raymedica LLC), Tissue Differentiation Intelligence LLC, Spine Kinetics Inc; Consulting: DePuy Synthes Spine, NuVasive Inc; nonfinancial interests: Consulting: EIT Emerging Implant Technologies, Spineart USA Inc, Ethicon Inc. APH declares financial interests: Research Support: Kuros Biosciences AG; Fellowship Support: NuVasive Inc, Kuros Bioscience B.V.
AUTHOR CONTRIBUTIONS
Manuel Moser designed the study, performed all measurements, collected the data, analyzed the data, and wrote the manuscript. Dominik Adl Amini performed QCT measurements, reviewed and edited the article. Ichiro Okano and Lisa Oezel reviewed and edited the article. Jennifer Shue wrote the research plan for IRB approval and was in charge of the clinical research process and the project administration. John A. Carrino, Andrew A. Sama, Frank P. Cammisa, and Federico P. Girardi designed the study and reviewed and edited the manuscript. Alexander P. Hughes designed the study, reviewed and edited the manuscript, and supervised all aspects of the study. All authors have read and approved the final submitted manuscript.


