Subject-specific biomechanical analysis to estimate locations susceptible to osteoarthritis—Finite element modeling and MRI follow-up of ACL reconstructed patients
Abstract
The aims of this case-control study were to: (1) Identify cartilage locations and volumes at risk of osteoarthritis (OA) using subject-specific finite element (FE) models; (2) Quantify the relationships between the simulated biomechanical parameters and T2 and T1ρ relaxation times of magnetic resonance imaging (MRI). We created subject-specific FE models for seven patients with anterior cruciate ligament (ACL) reconstruction and six controls based on a previous proof-of-concept study. We identified locations and cartilage volumes susceptible to OA, based on maximum principal stresses and absolute maximum shear strains in cartilage exceeding thresholds of 7 MPa and 32%, respectively. The locations and volumes susceptible to OA were compared qualitatively and quantitatively against 2-year longitudinal changes in T2 and T1ρ relaxation times. The degeneration volumes predicted by the FE models, based on excessive maximum principal stresses, were significantly correlated (r = 0.711, p < 0.001) with the degeneration volumes determined from T2 relaxation times. There was also a significant correlation between the predicted stress values and changes in T2 relaxation time (r = 0.649, p < 0.001). Absolute maximum shear strains and changes in T1ρ relaxation time were not significantly correlated. Five out of seven patients with ACL reconstruction showed excessive maximum principal stresses in either one or both tibial cartilage compartments, in agreement with follow-up information from MRI. Expectedly, for controls, the FE models and follow-up information showed no degenerative signs. Our results suggest that the presented modelling methodology could be applied to prospectively identify ACL reconstructed patients at risk of biomechanically driven OA, particularly by the analysis of maximum principal stresses of cartilage.
1 INTRODUCTION
Anterior cruciate ligament (ACL) rupture is a common sports-related knee joint injury. It has been shown that patients with ACL rupture have a high risk of developing osteoarthritis (OA).1, 2 Given the contribution of ACL in the knee joint stability, ACL ruptures are often surgically reconstructed using tissue grafts. However, postoperative studies have shown that knee OA may develop even in the short-term after ACL reconstruction (ACLR).2, 3 It has been reported that almost half of patients with ACLR have signs of articular cartilage degeneration at 1-year follow-up.2 Identifying patients that are at low or high risk of developing OA would be useful, as this may improve our mechanistic understanding of OA and promote the development of postoperative strategies for delaying and/or preventing the onset and progression of OA.
There are several methods to clinically assess knee OA using self-assessment questionnaires, such as Knee Osteoarthritis Outcome Score (KOOS), or using imaging methods, such as Kellgren–Lawrence or whole-organ resonance magnetic imaging (WORMS).4 However, these methods provide limited information on cartilage integrity or composition and are susceptible to intra- and interobserver variability.5 Measurement of T2 and T1ρ relaxation times offers a quantitative assessment of local articular cartilage composition.6 Several studies have related the T2 relaxation time with collagen network integrity and arrangement7, 8 and the T1ρ relaxation time with proteoglycan (PG) content.9, 10
A possible mechanism that may lead to OA in patients with ACLR is altered knee joint biomechanics, leading to abnormal stresses or strains experienced by articular cartilage.11, 12 These abnormal stresses and strains have been evaluated experimentally13, 14 and computationally13, 14 ex vivo, and by finite element (FE) modeling of human joints.15, 16 In a clinical setting, the FE model generation and computational solution should be as fast as possible. In terms of model complexity, several studies have shown that FE models with simplified geometry and motion,17 cartilage material properties18 and ligament formulation19 produce similar, if not the same, results as more computationally demanding approaches. In a recent proof-of-concept study, we showed that these simpler FE models can predict areas susceptible to OA in agreement with follow-up information.20
The aims of this study can be divided into two sub-aims: (1) Identify locations and cartilage volumes in the knee joints of patients with ACLR and controls at risk of developing OA, using the biomechanical modeling methodology from a previous proof-of-concept study.20 Excessive maximum principal stresses were assumed to lead to collagen network degeneration20, 21 and excessive absolute maximum shear strains were assumed to cause PG loss.22, 23 (2) Quantify the ability of the simulated maximum principal stresses and maximum shear strains to predict 2-year longitudinal changes in T2 and T1ρ relaxation times, respectively.
We examined the following hypothesis: (1) Collagen nework damage simulated via excessive maximum principal stresses is strongly related to longitudinal changes in the collagen-sensitive T2 relaxation time; (2) PG loss simulated via excessive absolute maximum shear strains is strongly related to longitudinal changes in PG-sensitive T1ρ relaxation time To our knowledge, the only FE modeling study aiming at predicting knee OA progression for a relatively high number of subjects is a recent study by Mononen et al.15 (n = 21). In contrast to that study, we believe this is the first study in which subject-specific FE models of the knee joint, in terms of both geometry and motion, were created for a cohort and were qualitatively and quantitatively verified against follow-up MR imaging assessment methods.
2 MATERIALS AND METHODS
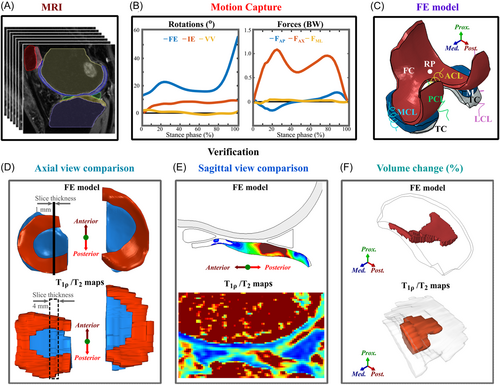
The workflow of the study is shown in Figure 1. This study is a level II prospective cohort study and includes 13 subjects: 7 patients with ACLR and 6 healthy controls. FE models for each subject were generated, with knee joint geometries manually segmented from the 3D-FSE (CUBE) magnetic resonance imaging (MRI) sequences (Figure 1A) and knee joint motions obtained from motion capture data (Figure 1B). The FE models included femoral and tibial cartilages, menisci, and cruciate and collateral ligaments (Figure 1C). The simulation results of the models were then compared against follow-up T2 and T1ρ information, as well as WORMS and KOOS grades (Figure 1D,E,F and Table 1).
| Demographics | ACLR (n = 7) | Controls (n = 6) |
|---|---|---|
| Age (years) | 37.8 ± 6.5 | 31.3 ± 0.37 |
| Gender (male: female) | 5:2 | 3:3 |
| Weight (kg) | 70.60 ± 13.43 | 68.3 ± 10.3 |
| Height (m) | 1.74 ± 0.11 | 1.69 ± 0.11 |
| Time points and usage | ||
|---|---|---|
| Measured data | 1-year follow-up | 3-year follow-up |
| 3D-FSE CUBE MRI (3D fat-saturated, intermediate-weighted, fluid-sensitive fast-spin-echo) | FE geometry + WORMS | WORMS |
| Sagittal 3D MAPSS MRI sequence4, 25 | T2/T1ρ relaxation time | T2/T1ρ relaxation time |
| Knee injury osteoarthritis outcome score (KOOS) | Verification | Verification |
| Motion capture | FE motion | – |
- Note: A detailed description of the measurement protocols can be found in Supporting Information Material.
- Abbreviation: MRI, magnetic resonance imaging.
2.1 Patient demographics and acquired data
MR imaging and motion capture were performed at the University of California, San Francisco (UCSF) (Table 1). All subjects gave informed consent and data acquisition was approved by and carried out in accordance with the rules and regulations of the Institutional Review Board under the Human Research Protection Program at UCSF. More details on the patient demographics and measurement setup are provided in the Supporting Information Materials.
T2 and T1ρ relaxation time mapping was done using a two-parametric nonlinear exponential fit with Aedes plugin (http://aedes.uef.fi) for Matlab and custom scripts at both 1- and 3-year follow-up time points. Each compartment of the tibial cartilage was manually segmented from the T2 and T1ρ mapped images.
Co-registering the 1-and 3-year MRI images may be possible. However, it would introduce uncertainties due to the MRI slice thickness of 4 mm and the discrepancy in the slice location between the two follow-up points. Also, at the 3-year follow-up time point, there may be regions showing changes in cartilage thickness, complicating co-registering the two MRI image stacks. Instead, T2 and T1ρ relaxation times above 60 ms were assumed to indicate collagen network damage and PG loss, respectively24-27 (see more below). Some sensitivity analysis for this threshold has also been done in a previous study.16 Please also find more clarification on the threshold selection in the Supporting Information Materials.
2.2 FE models
The methodology used to generate the FE models for each subject was identical to that applied in our previous study.20 Details of the FE model generation process, including segmentation, mesh generation, and motion and material implementation, are presented in Supporting Information Materials. Detailed material properties for each soft tissue are shown in the Table S1.
To identify locations prone to collagen network degeneration, the maximum principal stress (tensile stress) distribution was calculated by taking the peak centroid value of the maximum principal stress in each element throughout the entire stance phase of gait. Similarly, to identify location prone to PG loss, the distribution of absolute maximum shear strains was calculated by taking the peak centroid value of the absolute maximum shear strain in each element throughout the entire stance phase of gait. Maximum principal stresses above 7 MPa threshold were assumed to indicate collagen network degeneration.20, 21 Absolute maximum shear strains above 32% threshold were assumed to indicate PG loss.22, 23 These thresholds were based on previous experimental and computational studies.14, 22, 28-38 They also match values reported in a recent review article by Jørgensen.39 Some sensitivity analysis for these thresholds has also been done in previous studies.16
2.3 Comparison between FE model results and T2/T1ρ relaxation times
2.3.1 Qualitative comparison
The FE model results were qualitatively compared against T2 and T1ρ relaxation times using axial views (Figure 1D). For the FE model, the axial view indicates the distribution of maximum principal stresses or absolute maximum shear strains (centroid values of elements) on the superficial tibial cartilage. To determine the T2 and T1ρ values on the tibial cartilage surface we used a custom Matlab script. An example of process for obtaining the axial view is provided in the Figure S4.
2.3.2 Quantitative comparison
2.3.2.1 Volume comparison
- (1)
For the FE models, in each compartment a volume-of-interest (VOI) was defined as the total volume of elements exceeding the 7 MPa or 32% thresholds and taken as the degenerated percentage of the total volume of the compartment.
- (2)
For T2 and T1ρ relaxation times at both the 1- and 3-year follow-up time points, in each compartment, the VOI was defined as the total volume exceeding the 60 ms threshold24-27, 40 and similarly taken as the degenerated percentage of the total volume of the compartment. The volume of tissue assumed to be degenerated between the time points was calculated by subtracting the VOI at the 3-year time point from the VOI at the 1-year time point.
2.3.2.2 Value comparison
- (1)
For the FE models, the location and value of peak maximum principal stress was determined for each joint compartment from the entire stance phase (one location and one centroid value). Then, the average value of all element centroids around the peak value was determined. Henceforth, we will refer to the calculated “average centroid value around the peak” as “peak value” (values are almost the same for all patients, see the Supporting Information Materials).
- (2)
For the T2 maps, T2 values at the 1- and 3-year follow-up time points were determined at the areas corresponding (defined as the average of 10 pixels) to those determined in the step 1. The change in T2 relaxation times between the 1- and 3-year time points was computed.
Similar steps were applied to assess the relationship between the peak absolute maximum shear strain and the change in T1ρ relaxation times between the 1- and 3-year follow-up time points. More information is provided in the Supporting Information Materials. Please note that for the quantitative analysis, both sets of participants are combined.
2.3.3 Other verification methods
We also compared the peak maximum principal stresses against 3-year WORMS grades (grades from 0 to 3 at the 3-year follow-up, details are provided in the Supporting Information Materials). Additionally, we compared the biomechanical parameters (peak maximum principal stresses and absolute shear strains predicted at the 1-year time point) and the measured changes in MRI parameters (2-year longitudinal change in T2, T1ρ and WORMS) against the 2-year longitudinal changes in KOOS grades (details are provided in the Supporting Information Materials).
2.4 Statistical analysis
We assessed the relationship between the predicted and potentially degenerated cartilage volumes. Performing a normality test revealed that the data was not normally distributed, and thus Spearman's correlation was used. Bivariate least square linear fits were calculated using a method that takes into account the uncertainties in the variables.41 This method is known to be robust for outliers and extreme observations. Similarly, the Spearman's correlation coefficients and a bivariate least square linear fits were calculated between the peak values of maximum principal stress and absolute maximum shear strain and the change in T2 and T1ρ relaxation times, respectively. Furthermore, bivariate least square linear functions41 were fitted between the simulated biomechanical parameters and the relaxation times.
To evaluate if there are statistically significant differences in maximum principal stress and absolute maximum shear strain, and the change in T2 and T1ρ relaxation times, between patients with ACLR and healthy controls, we used the Mann–Whitney U-test, since the data was not normally distributed. All statistical tests were carried out in MATLAB, using custom scripts.
3 RESULTS
3.1 Comparison between the FE model results and T2 and T1ρ relaxation times
3.1.1 Qualitative comparison
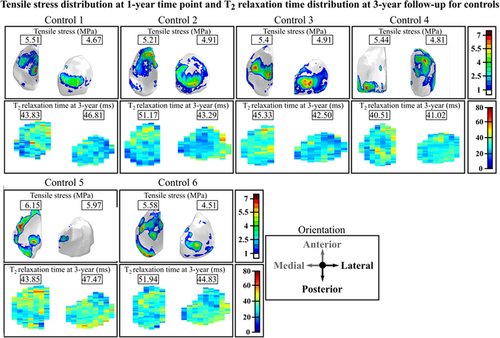
We compared the maximum principal stress distributions on the joint surfaces at the 1-year follow-up time point and changes in the T2 relaxation time distributions at the 1- and 3-year follow-up time points for the 7 patients with ACLR (Figure 2) and the 6 controls (Figure 3). Both for the patients and controls there is a good qualitative correspondence between the simulated maximum principal stresses and the longitudinal changes in T2 relaxation times. For Patients 1–3, 5, and 7 with ACLR, the articular cartilage locations with excessive maximum principal stresses matched the areas with changes in T2 relaxation times (Figure 2). For Patients 4 and 6, only small maximum principal stresses (less than 5 MPa) and changes in T2 relaxation times (less than 5 ms) were observed. As was expected, small maximum principal stresses and negligible changes in T2 relaxation times were observed for all healthy control subjects (Figure 3). For the 7 patients with ACLR, we also compared the sagittal sections (see Figure S5).
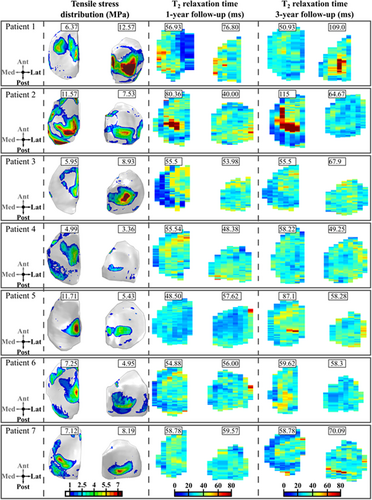
In terms of absolute maximum shear strains, the correspondence between the FE model results and MRI findings was not evident. For Patient 1, PG loss was predicted via excessive absolute maximum shear strains on the lateral tibial cartilage with a similar distribution as the maximum principal stresses. T1ρ relaxation times were also increased between the 1- and 3-year follow-up time points in the same regions (not shown). For Patients 2–7, absolute maximum shear strains did not exceed the assumed degeneration threshold (see below), while the T1ρ relaxation time showed a similar distribution and values as the T2 relaxation time.
3.1.2 Quantitative comparison—cartilage volumes
The cartilage volumes with collagen network degeneration predicted by the FE models matched with the volumes of degenerated cartilage estimated based on the change in T2 relaxation times (Figure 4A and Figure S6). There was a significant positive correlation between the predicted and measured degenerated cartilage volumes (r = 0.711, p < 0.001). Using bivariate least squares, we obtained a linear fit with an R2 = 0.946.

The cartilage volumes with assumed PG loss predicted by the FE models did not match with the cartilage volumes with PG loss estimated based on the change in T1ρ relaxation times (see Figures S6 and S7). There was a nonsignificant and weak correlation between the volumetric PG loss predicted by the FE models and that estimated by the change in T1ρ relaxation times (r = 0.279, p = 0.168).
3.1.3 Quantitative comparison—FE model and MRI peak values
There was a positive correlation between peak maximum principal stresses at the 1-year time point and local changes in T2 relaxation times between the 1- and 3-year follow-up time points (Figure 4B), (r = 0.649, p < 0.001). Using bivariate least squares, we obtained a linear fit with an R2 = 0.906. Again, there was no statistically significant correlation between peak absolute maximum shear strains and changes in T1ρ relaxation times (r = 0.280, p = 0.160, see Figure S8).
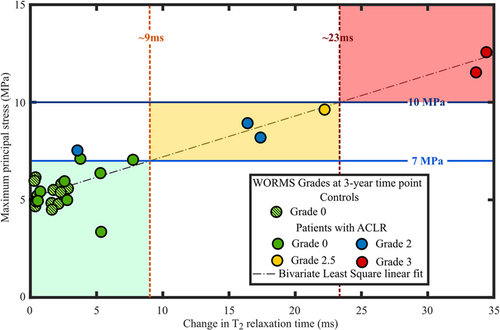
3.1.4 Quantitative comparison—FE model and WORMS
When grouping the subjects by WORMS grade (details provided in the Supporting Information Materials), we could differentiate patients roughly in three different risk groups for the progression of OA (low, moderate and high risk) (Figure 5 and Figure S9). Patients experiencing less than 7 MPa maximum principal stress showed no or minor tissue alterations based on WORMS and T2 relaxation times. On the other hand, patients experiencing stresses between 7 and 10 MPa were at a higher risk and those experiencing over 10 MPa maximum principal stresses had the most severe tissue changes during the follow-up, both in terms of WORMS and T2 relaxation times.
3.1.5 Quantitative comparison—KOOS
We did not find any statistically significant correlations between the KOOS grades and biomechanical or MRI parameters (see Supporting Information Materials for more details).
3.2 Comparison between patients with ACLR and healthy controls
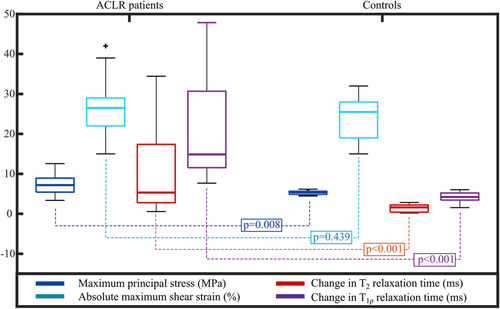
The median maximum principal stress value was significantly higher in patients with ACLR (7.20 MPa) than in healthy controls (5.30 MPa) (Figure 6, p = 0.008). Similarly, the median change in T2 relaxation times between 1- and 3-year follow-up time points was significantly higher in ACLR patients (5.3 ms) than controls (1.61 ms) (Figure 6, p < 0.001). The maximum principal stress and the change in T2 relaxation time showed large patient-specific variability in the ACLR group (standard deviation of 2.77 MPa and 12.45 ms, respectively). Obviously, this was not the case for the control group where subjects mostly remained healthy (SD of 0.54 MPa and 0.98 ms, respectively). In terms of absolute maximum shear strains, there was no statistically significant difference between patients with ACLR and healthy controls (Figure 6, p = 0.439). On the other hand, between the two groups, there was a statistically significant difference in the change of T1ρ relaxation time between the 1- and 3-year follow-up time points (Figure 6, p < 0.001). The distribution, range and values for the change in T1ρ relaxation times were similar to those in T2 relaxation times (not shown). Patients with ACLR had significantly lower KOOS grades at both 1- and 3-year follow-up time points than controls. More information is presented in the Supporting Information Materials.
4 DISCUSSION
In this study, FE models were created for seven patients with ACLR and six healthy controls. The knee geometry was obtained from manually segmented high-resolution MRI and the knee joint motion was obtained from motion capture. The methodology used to generate the FE models was identical to that described in a previous proof-of-concept study.40 We identified locations in each compartment of the tibial cartilage at risk of biomechanically-driven OA due to excessive maximum principal stresses and absolute maximum shear strains. Then, we compared these FE model predictions qualitatively and quantitatively with follow-up MRI findings. The location and volume of cartilage at risk for collagen degeneration predicted by the FE model, through excessive maximum principal stresses, matched the cartilage volumes of increased T2 values during the follow-up in 85% of subjects. Furthermore, there was a positive correlation between the predicted volume and values of maximum principal stresses and T2 relaxation times. There were also significant differences in maximum principal stresses, and T2 and T1ρ relaxation times, but not in absolute maximum shear strains, between ACLR patients and healthy controls. Our results suggest that the proposed FE modeling workflow with simplified geometries (i.e., only the tibiofemoral joint), loading conditions (i.e., directly from motion capture without musculoskeletal modelling) and materials (i.e., without time-dependent degeneration mechanisms), can identify patients at risk of developing biomechanically driven collagen degeneration in OA.
4.1 Collagen network
Both qualitatively and quantitatively, the articular cartilage locations with excessive maximum principal stresses matched the areas with changes in T2 relaxation times. For almost all patients the posterior aspect of the cartilage area showed high maximum principal stresses. In the same posterior aspect, T2 relaxation times were increased between the follow-up time points. The posterior site was also noted in other studies2, 42, 43 and is attributed to valgus collapse,42, 43 particularly for the lateral compartment. Importantly, all subjects in both groups predicted to be at high-risk or at low-risk of OA onset and development by the FE model (maximum principal stresses above 10 MPa or below 7 MPa, respectively) matched the follow-up MRI information (change in T2 relaxation time above 23 ms or below 10ms, respectively; WORMS 3 or WORMS 0/1, respectively). This highlights the importance of patient-specific analysis. In the future, more subjects will be added from other patient groups.
Using the 7 MPa and 60 ms thresholds as collagen network degeneration indicators, a good match was found between the degenerated volumes predicted by the FE models and those determined from T2 maps (Figure 4A and Figure S6). Some differences between the predictions and MRI findings may be influenced by the assumed degeneration threshold values, which are likely patient-specific, or by other limitations listed below.
There were significant differences between patients with ACLR and healthy controls in maximum principal stresses and changes in T2 and T1ρ relaxation times. The predicted maximum principal stresses showed that some patients with ACLR are at a higher risk of developing OA than others, in agreement with previous ACLR studies.1, 2 Relaxation times showed similar patient-specificity. The distribution of peak maximum principal stresses and changes in T2 and T1ρ relaxation times were more clustered in controls with a small standard deviation, and the values were below the assumed degeneration thresholds. This was to be expected, since one of the criteria for the patient selection of healthy controls was that they should not show any degenerative signs at any time point.
Interestingly, using 7 MPa30 and 10 MPa39 as maximum principal stress thresholds, we could differentiate patients whose knees were evaluated by WORMS roughly in three different risk groups for the progression of OA. Therefore, our proposed and relatively straightforward biomechanical method might be applicable for clinical risk assessment. However, it should be noted that the rough division to these three risk categories was made by the authors, though based on the results, and apply at the moment only to these studied patient groups (patients with ACLR and controls). Therefore, this grouping cannot be generalized yet. There are several factors in the model that may need to be adjusted to other patient groups and are listed in limitations below.
4.2 PG loss
Both qualitatively and quantitatively, the connection between absolute shear strain and increased T1ρ relaxation time was not evident (see Figures S6–S8 and Table S2), though increased values in both of these parameters and WORMS can be seen especially in Patients 1, 2, and 7. For Patients 1 and 2, please refer to our previous proof-of-concept study,20 where the relationship between maximum shear strains and T1ρ relaxation times was examined in more detail. These patients had full-depth cartilage defects, which were included and analyzed also in detail in a recent proof-of-concept mechanobiological modelling study.28 The results of that study showed that for these two patients the simulated shear strain driven PG loss is highly localized around the cartilage lesion.28 In that study, both T1ρ and T2 relaxation times were increased in the vicinity of the lesion between 1- and 3-year follow-up time points. Combined, the results indicate that (1) at least on a compartment level, absolute maximum shear strain may not indicate PG loss or changes in tissue integrity, and (2) that highly localized strain levels may be more important and could indicate highly localized cell death and PG loss, even though global strain levels would not change.
Similar to T2 relaxation times, there were significant differences between patients with ACLR and controls in terms of T1ρ. Generally, the values of T1ρ were ~10 ms higher than those of T2 at both 1- and 3-year follow-up time points. The range and distribution of T1ρ were similar to those of T2. This would suggest that both T2 and T1ρ may be more indicative of the overall state of articular cartilage integrity than collagen or PG separately.7, 44
4.3 Relation with patient reported outcomes
We did not find any statistically significant correlations between the KOOS grades and the FE model predictions, or between the KOOS grades and the MRI measures (see Table S3). This suggests that there are other factors than excessive stresses or altered integrity of cartilage that cause symptoms and reduced quality of life, which is not surprising. On the other hand, in the group level there was a significant difference in the KOOS grades and the patients with ACLR showed a greater variability in KOOS grades than controls. This emphasizes patient-specificity consistent with the biomechanical and MRI results.
4.4 Limitations
This study has a few limitations that warrant discussion. They are briefly listed below and expanded upon in the Supporting Information Materials.
The study was limited to 13 subjects, which is more than in most biomechanical modelling studies but still relatively low. Some discrepancies between the biomechanical parameters and MRI follow-up findings may be attributed to the still relatively low number of patients and may affect the correlation analysis. Generation of subject-specific FE models requires a lot of manual work and time in segmentation, meshing and making the models converge, typically taking at minimum 1 week per subject from an experienced researcher. However, the FE models were able to distinguish between different patients' risk levels and were in agreement with the follow-up information in 85% of the subjects. To increase the number of patients, the model generation and simulation should become faster. Therefore, the used methodology should be coupled with semi-automatic or fully automatic segmentation techniques38 or even fully automated model generation methods.15 For instance, in a recently developed atlas-based method,15 the model generation for one patient takes only a few minutes. In the future, AI-based methods could even eliminate the need for FE models, however a large amount of data is needed to properly train such models.
The FE models did not include all muscle forces via musculoskeletal modelling and the patellofemoral joint. Other post-ACLR rehabilitation exercises, such as cutting or single-leg squat, were not included in this study. Constant stress and strain thresholds to estimate cartilage degeneration were used in the models. These thresholds, and material properties of cartilage, could be adjusted in the future at least according to age, gender or physical activity,46 particularly as the incidence to ACL rupture is typically higher in younger patients.2, 47 Other mechanisms for OA onset and development, such as underloading and/or inflammation48 in early ACLR follow-up, were not considered in the FE models. Implementing all these aforementioned properties can be done in the future, but would increase the model complexity and increase time to obtain the results. This would take the methodology further away from clinical application.
With improved imaging techniques, maybe tissue level properties can in the future be obtained in a personalized manner. However, this is currently time consuming and even with this approach several model parameters need to be assumed from literature.48, 49 One relatively simple approach to obtain patient-specific tissue level information could be, e.g., to fine tune the degeneration thresholds in the model to capture the experimentally detected changes in cartilage structure during the follow-up of patients. This is one of our long-term goals requiring fast modeling workflow and a lot of subject-specific data from various subject groups.
Only the tibial cartilage was analyzed. This choice was mainly related to the quantitative MRI. In particular, the T2 relaxation time can show susceptibility to the orientation of the magnetic field. In a recent study,7 it was shown that the T2 relaxation time shows the highest dependence on the tissue orientation. Therefore, analysis of the convex and round shape of the femoral condyles and patellar groove may introduce uncertainties.8, 26 From the clinical point of view, almost half of patients with ACLR show both early2, 3 and long term1 signs of OA in the tibial cartilage compartment.
The resolution of the T2 and T1ρ relaxation time maps was low with a slice thickness of 4 mm and a pixel size of 0.55 × 0.55 mm. This may lead to partial volume effects that could lead to inaccuracies in T2 and T1ρ values, especially interfaces with high relaxation time differences (i.e., cartilage interface with synovial fluid or bone).6, 8 Higher resolution may not be feasible as this would drastically increase the image acquisition time.
4.5 Clinical application
Our results suggest that the presented relatively straightforward FE modelling method can be used to identify patients at different risk levels of developing biomechanically driven OA in agreement with MRI follow-up information. This method would be particularly useful in assessing the effects of surgical interventions, such as ALCR, on OA onset and progression. In the future, the methodology could be used to identify and evaluate optimal nonsurgical management and post-ACLR rehabilitation strategies for avoiding or delaying the disease progression. FE models with simplified geometry (i.e., only tibiofemoral joint), motion (i.e., directly from motion capture without musculoskeletal modelling) and materials (i.e., without time-dependent degeneration mechanisms) could provide a pathway towards clinical application.
ACKNOWLEDGEMENTS
Financial support from University of Eastern Finland's Doctoral Programme in Science, Technology and Computing (SCITECO), Academy of Finland (Grant Nos. 269315, 285909, 305138, 307932, 324529, 324994, 328920), Sigrid Juselius foundation, Business Finland (Grant No. 3455/31/2019) and National Institutes of Health (NIH/NIAMS P50 AR060752) are acknowledged. CSC-IT Center for Science, Finland, is acknowledged for computing resources.
CONFLICT OF INTERESTS
The authors declare that there are no conflict of interest.
AUTHOR CONTRIBUTIONS
Paul O. Bolcos: contributed to the study design, analysis and interpretation of the data, and preparation and revision of the manuscript. Mika E. Mononen: contributed to the study design, analysis and interpretation of the data, and preparation and revision of the manuscript. Mikko J. Nissi: contributed to the study design, analysis and interpretation of the data, MRI analysis and interpretation, as well as the preparation and revision of the manuscript. Koren E. Roach, Matthew S. Tanaka, Juha-Sampo Suomalainen, Thomas M. Link, Richard B. Souza, and Sharmila Majumdar: contributed to the clinical MRI data collection, analysis and interpretation of the data, and revision of the manuscript. Santtu Mikkonen and Juha Töyräs: contributed to the data analysis, statistical interpretation, and revision of the manuscript. C. Benjamin Ma and Xiaojuan Li: contributed to the study design, analysis and interpretation of the data, and revision of the manuscript. Rami K Korhonen: contributed to the study design, analysis and interpretation of the data, and preparation and revision of the manuscript. All authors have read and approved the final submitted manuscript.


