Higher knee contact forces might underlie increased osteoarthritis rates in high functioning amputees: A pilot study
Abstract
High functioning military transtibial amputees (TTAs) with well-fitted state of the art prosthetics have gait that is indistinguishable from healthy individuals, yet they are more likely to develop knee osteoarthritis (OA) of their intact limbs. This contrasts with the information at the knees of the amputated limbs that have been shown to be at a significantly reduced risk of pain and OA. The hypothesis of this study is that biomechanics can explain the difference in knee OA risk. Eleven military unilateral TTAs and eleven matched healthy controls underwent gait analysis. Muscle forces and joint contact forces at the knee were quantified using musculoskeletal modeling, validated using electromyography measurements. Peak knee contact forces for the intact limbs on both the medial and lateral compartments were significantly greater than the healthy controls (P ≤ .006). Additionally, the intact limbs had greater peak semimembranosus (P = .001) and gastrocnemius (P ≤ .001) muscle forces compared to the controls. This study has for the first time provided robust evidence of increased force on the non-affected knees of high functioning TTAs that supports the mechanically based hypothesis to explain the documented higher risk of knee OA in this patient group. The results suggest several protentional strategies to mitigate knee OA of the intact limbs, which may include the improvements of the prosthetic foot control, socket design, and strengthening of the amputated muscles.
1 INTRODUCTION
Recent conflicts in Afghanistan and Iraq have resulted in a large number of United Kingdom military traumatic amputees. Explosions, including those by improvised explosive devices and mines, are the leading causes of these traumatic amputations followed by small arms fire, which includes gunshot wounds and grenades.1 In comparison to the civilian population, for whom the predominant mechanism of traumatic amputations is through road traffic accidents and work-based accidents, military traumatic amputees have specifically benefited from the high-quality care from the point of trauma on the battlefield to arrival back in the UK for intensive, continued rehabilitation, medical and surgical care.1 It has been documented that UK military amputees can achieve mean functional mobility scores at the completion of their rehabilitation pathway consistent with those of a healthy population2; military transtibial amputees (TTAs) with well-fitted state of the art prosthetics have gait that is indistinguishable from healthy individuals in terms of temporal, spatial and metabolic energy expenditure measurements.3
Due to their prolonged and frequent prosthetic use, military unilateral TTAs are more likely to develop secondary musculoskeletal disorders of their intact limbs.4-7 This includes a higher rate of pain7 and osteoarthritis (OA)5 for the non-affected knee. This contrasts with the information on the knee joint of the amputated limb that has been shown to be at a significantly reduced risk of pain and OA, as reported by a prevalence knee OA ratio of 0.2 at the amputated limb when compared with non-amputees7; this effect may be due to subtle protective mechanisms.6
The reason for the differences in knee OA risk between the intact limb and the amputated limb are not known. Biomechanics plays an important role in the instigation and progression of OA8-11 and it is the hypothesis of this study that a detailed analysis of the biomechanics of the knee joints of both the affected and non-affected limbs can explain the difference in OA risk. During TTA gait the loss of the ankle joint, and the muscles that span it, inevitably results in functional asymmetry. Quantitative analysis of the ground reaction force (GRF) has found that the intact limb bears a higher load during stance than the amputated limb.12-14 Other studies have combined the GRF data to calculate net joint force and net joint moment at the knee and found no significant differences between the intact limb and the amputated limb, suggesting that the loading is not asymmetrical.5, 15 However, such inverse dynamics based biomechanical analyses do not account for the forces produced by muscles.16 Muscle coordination does change after amputation as necessitated by prosthetic control and anatomical factors, resulting in increased activation of knee flexors and extensors in the amputated limbs as measured by electromyography (EMG).17-20 It is therefore necessary to quantify muscle forces in the affected and non-affected limbs to fully understand the joint loading.
There is no direct way to measure the muscle force and knee contact force in vivo without surgical intervention. Therefore, computational musculoskeletal models have been developed that enable the virtual in silico re-creation of the mechanical function of musculoskeletal tissues, including muscles, ligaments, and articulating surfaces. Such models take as input the measurement of motion (kinematics) and external forces, such as body mass and contact forces between subject and ground; they calculate mechanical loads in the musculoskeletal system, including muscle forces and joint contact forces. The outputs from musculoskeletal models have been validated for use in gait.21-24
The aim of the study is to investigate the mechanical loading on both the affected and non-affected knees for a cohort of recently military TTAs using musculoskeletal modeling. It is hypothesized that the knee joint loading will be higher on the intact limbs and decreased on the amputated limbs when compared to healthy controls. The asymmetry in knee mechanical loading may explain the greater prevalence of contralateral knee OA and the protective effect on the amputated limbs.
2 METHOD
2.1 Participants
This pilot study recruited eleven individuals with unilateral transtibial amputation as a result of military trauma. The sample size was as large as could be practically achieved. All eleven had previously completed the rehabilitation program at the Defence Medical Rehabilitation Centre Headley Court; were capable of walking continuously for at least twelve minutes without a cane or other assistive device; and had worn their definitive, energy storage and return (ESAR) prosthetic feet for at least 6 months. Details of the prosthesis prescription are shown in Table 1. Eleven able-bodied individuals with no known neurological or musculoskeletal condition involving the lower limbs served as controls. They were a subgroup of a previously collected dataset.25 There were no significant differences in gender, age, height, and weight between the amputee and control groups (the Mann-Whitney U test with a significance level of 0.05, Table 1). The study protocols were approved by the Ministry of Defence Research Ethics Committee and the NHS Research Ethics Committee. Written informed consent to take part in this study was obtained from all participants.
| Group | Age, y | Weight, kg | Height, cm | Cause of amputation | Socket type | Prosthetic foot | Time since amputation,b mo |
|---|---|---|---|---|---|---|---|
| TTAa | 23 | 78.2 | 181.0 | Crush | TSB | Echelon VT | 12 |
| 29 | 88.5 | 186.2 | IED | PTB | Re-Flex VSP | 61 | |
| 24 | 119.6 | 186.5 | IED | PTB | Variflex XC | 8 | |
| 28 | 84.9 | 186.2 | IED | PTB | Echelon VT | 33 | |
| 32 | 94.1 | 184.9 | Mine | TSB | Re-Flex Shock | 69 | |
| 29 | 89.5 | 175.3 | IED | TSB | Echelon VT | 19 | |
| 28 | 84.5 | 179.8 | IED | PTB | Re-Flex Shock | 20 | |
| 35 | 103.7 | 179.6 | IED | TSB | Echelon VT | 19 | |
| 26 | 87.8 | 189.4 | IED | TSB | Echelon VT | 20 | |
| 24 | 66.5 | 173.8 | Crush | TSB | Variflex XC | 7 | |
| 33 | 84.4 | 178.0 | IED | TSB | Variflex XC | 27 | |
| Mean ± SD | 28 ± 4 | 89.2 ± 14.3 | 181.9 ± 5.2 | ||||
| Control | |||||||
| Mean ± SD | 34 ± 6 | 85.4 ± 10.3 | 183.1 ± 6.2 | ||||
| P-value* | .106 | .597 | .473 |
- Abbreviations: IED, improvised explosive device; PTB, patella tendon bearing; TSB, total surface bearing.
- a Subjects were requested to wear prostheses in the body weight and height measurement.
- b Time from amputation to when the subject attended the gait trials of the study.
- * P-value was derived from the Mann-Whitney U test using IBM SPSS (Version 24.0, IBM Corp).
2.2 Gait data
Experimental gait data were collected across two laboratories (L1 for 10 TTAs; L2 for 1 TTA and 11 controls) using a 10-camera motion capture system (100 Hz; Vicon, UK) and 4 force plates (1000 Hz; AMTI) in L1, and a 10-camera motion capture system (100 Hz; Vicon) and two force plates (1000 Hz; Kistler, Switzerland) in L2. Segmental motion was constructed using markers placed on the anterior/posterior superior iliac spine for the pelvis; on medial/lateral femoral epicondyles and clusters for the thigh; on the medial/lateral malleolus and clusters for the shanks; and on the second/fifth metatarsal head, lateral, and posterior aspect of the calcaneus for the feet.3 Labeling, cycle-events detection, and gap-filling were conducted within Vicon Nexus (Vicon) and C3D files were then post-processed in MATLAB (The MathWorks Inc). A zero phase-lag, fourth-order Butterworth filter with 6 Hz cut-off frequency was used to filter the marker positions and ground reaction forces.26
Surface EMG (2000 Hz; Delsys Trigon) was recorded to validate the modeled muscle activation during TTA walking, including gluteus maximus (GMax), gluteus medius (GMed), tensor fascia latae (TFL), biceps femoris long head (BFLH), vastus medialis (VMed), vastus lateralis (VLas), semitendinosus (SemT), soleus (Sol) from the intact limb and GMax, GMed, TFL, and BFLH from the amputated limb. The electrodes were aligned parallel to the muscle fibers over the muscle belly and positioned based on the guidelines provided by Perotto.27 Prior to electrode placement, the skin was shaved and cleaned with alcohol wipes. Recorded EMG signals were corrected for offset, high-pass filtered at 30 Hz using a zero phase-lag, four order Butterworth filter, and rectified. The rectified signals were then low-pass filtered at 10 Hz.28, 29
All participants walked back and forth along aten-meter level walkway with self-selected walking speed. Three trials per subject were used for gait analysis where each trial satisfied the criteria of good marker visibility throughout the gait cycle and only one-foot landing entirely within the boundary of one force plate.
2.3 Musculoskeletal model
A lower limb musculoskeletal model was developed in FreeBody (V2.123, 30). It consisted off our rigid segments (foot, shank, thigh, and pelvis), articulated by ankle, knee, and hip joints, actuated by 163 muscle elements representing 38 lower limb muscles and the patellar ligament. Muscles were modeled as ideal force generators: the force of each muscle element generated was proportional to its maximal isometric force, which was equal to its physiological cross-sectional area (PCSA) multiplied by the maximum muscle stress of 31.39 N/cm2.31 The PCSA value of each muscle element was from the data of Klein Horsman et al.32 The ankle and knee joints possessed six degrees of freedom (DOFs), and the hip joint possesses three rotational DOFs. The measured segmental motion and ground reaction forces were used as inputs into the inverse dynamic analysis to calculate the net joint forces and moments. Afterward, muscle forces and resultant joint contact forces across the ankle, knee, and hip joints were estimated using a one-step static optimization approach.33 Briefly, the optimization criterion was to minimize the sum of muscle activation cubed.34 Muscle forces and joint contact forces were constrained to the net joint force/moment. The knee contact force was further decomposed into the medial and lateral components by the definition of contact points on the two femoral condyles (Figure 1A). The contact points were scaled from the magnetic resonance imaging (MRI)-based musculoskeletal geometry of a control subject (described below). The effect of medial and lateral knee contact forces, and muscle forces spanning the knee was then explicitly described as a force equilibrium, accounting for the shank motion.30
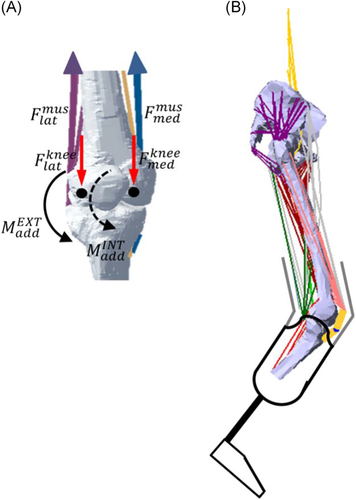
 ) and lateral knee muscles (
 ). This force was compartmentalized into a medial (
 ) and a lateral (
 ) component through force equilibrium at the contact points (black dot) of the two femoral condyles. The solid arc line represents the external adduction moment (
 ) acting at the knee and the dashed arc line represents the internal adduction moment (
 ) caused by the medial knee muscles. B, A musculoskeletal model of transtibial amputee [Color figure can be viewed at wileyonlinelibrary.com]
The musculoskeletal geometry was constructed based on the MRI of a control subject (male; height, 183 cm; weight, 96 kg),35 acquired from a 3.0 T MR scanner (MAGNETOM Verio, Siemens, Germany). Muscle origin, via, and insertion points, along with anatomic landmarks, joint centers of rotation, and contact points between the femur and tibia plateau were manually digitized from the MRI using MIMICS (Materialize, Leuven, Belgium). The anatomical dataset is available at http://www.msksoftware.org.uk.
For the TTAs, myodesis stabilization of the residual muscle was utilized in the transtibial amputation, in which the residual muscle and its fascia were sutured directly to bone or firmly attached to the periosteum.36 In order to investigate the influence of this surgical technique, several modifications were made to the model:muscles with tibial origins were removed; additionally, the attachment sites of dissected muscles (medial/lateral gastrocnemius and plantaris) on the calcaneus were modified to re-attach to the distal end of the stump. This resulted in 127 muscle elements in the TTA model (Figure 1B). The torque produced by muscles across the ankle was replaced by the pronation/supination torque calculated from inverse dynamics and presented at the midpoint between the medial and lateral malleolus on the prosthetic rubber foot.
The musculoskeletal model was scaled to other participants based on a linear scaling law.37 The scaling factors were calculated using the marker data of the intact limb captured in the static standing trial. Segmental parameters (mass, center of mass, and moments of inertia) were determined based on subject's height, weight, and gender.38 In the amputee group, they were identical for both the intact and amputated limbs.
2.4 Data analysis and statistics
EMG data were individually normalized to the maximum recording of each muscle during gait and modeled muscle activations were defined to be between 0 (fully deactivated) and 1 (fully activated) in terms of the peak value during gait. Differences between muscle activations and EMG were quantified in terms of the Sprague and Geers metric of magnitude (M), phase (P), and combined errors (C).39 The Sprague and Geers metric can quantify magnitude and phase errors independently and they are both zero when the compared curves are identical; C combined the two errors and was computed as the root of the sum of squares of M and P, where a combined error of less than 0.40 is the best validation for similar work in the literature.22
3 RESULTS
Modeled muscle activations in both the intact limb and amputated limb showed consistency with the EMG signals (see Figure S1). The combined errors of 0.18 to 0.37 (Table S1) are low.
Walking speed was not different between the individuals with TTA and controls (1.30 ± 0.13 m/s for intact limbs and 1.31 ± 0.12 m/s for amputated limbs vs 1.33 ± 0.13 m/s for controls, P = .380 and .770, respectively); and not different between intact and amputated limbs (P = .878).
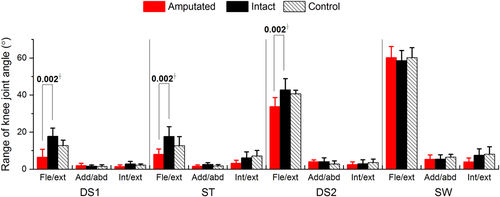
Individuals with TTA had greater knee joint angle at their intact limbs than at their amputated limbs (Figure 2; after controlling for walking speed, 11.3° greater flexion-extension during first double support-P = .002; 9.6° greater flexion-extension in residual single-limb stance—P= .002; and 8.9° greater flexion-extension during second double support—P = .002).
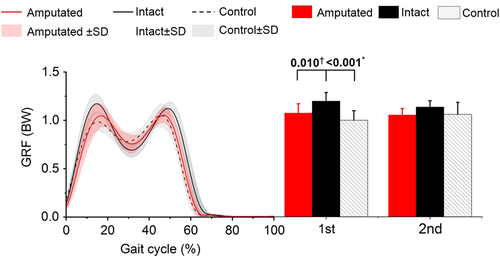
The first peak GRF for the intact limbs was higher than for the amputated limbs (adjusted mean difference [95% confidence interval (CI)], 0.12 [0.04, 0.21] BW, P = .010) and controls (adjusted mean difference [95% CI], 0.20 [0.10, 0.29] BW, P < .001).
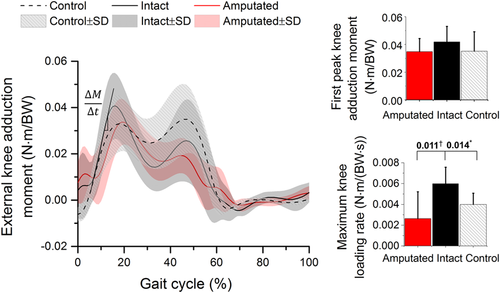
There was a trend for the first peak external adduction moment for the intact limbs (adjusted mean [95% CI]: 0.042 [0.034, 0.050] N m/BW) to be higher than the amputated limbs (adjusted mean [95% CI], 0.028 [0.018, 0.038] N m/BW) and controls (adjusted mean [95% CI], 0.031 [0.024, 0.038] N m/BW); this did not reach statistical significance (P = .074 and P = .086; Figure 4). The maximum knee loading rate which was defined as the maximum change in the external knee adduction moment per time unit was significantly higher for intact limbs (adjusted mean [95% CI], 0.006 [0.004, 0.008] N m/(BW s)) than controls (adjusted mean [95% CI]: 0.004 [0.003, 0.005] N m/(BW s), P = .014) and amputated limb adjusted mean [95% CI], 0.003 [0.001, 0.004] N m/(BW s), P = .011).
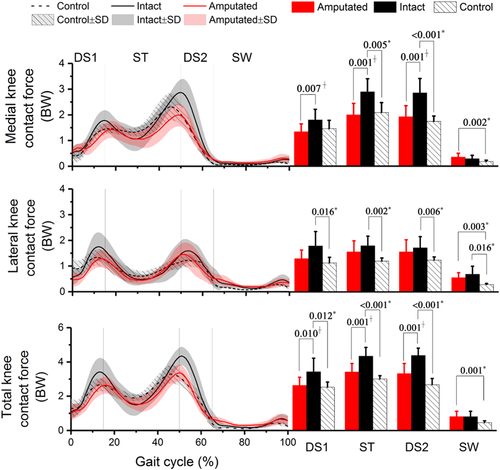
Medial knee contact forces at the intact limb were greater than controls, including a significantly greater peak value at single-limb stance (adjusted mean difference [95% CI], 0.80 [0.29, 1.31] BW; P = .005) followed by significantly greater peak (adjusted mean difference [95% CI]: 1.10 [0.60, 1.60] BW; P < .001) and average values (adjusted mean difference [95% CI], 0.64 [0.22, 1.05] BW; P = .005) during the second double support (Table 2 and Figure 5). Lateral knee contact forces at the intact limb had greater peak values than controls (P ≤ .016). Overall knee contact forces at the intact limb were significantly greater in comparison with controls (adjusted mean difference [95% CI] ≥0.94 [0.24, 1.63] BW; P ≤ .012). Between amputated and intact limbs, lower knee contact forces were found in the amputated limbs with lower peak values (adjusted mean difference [95% CI] ≥ 0.47 [0.14, 0.80] BW; P ≤ .007) at the medial compartment during stance and a lower average value at the lateral compartment during the first double support (adjusted mean difference [95% CI] = 0.36 [0.15, 0.57] BW; P = .002).
| Name | Phase | Quantity | Unilateral transtibial | Control | Quantity | Unilateral transtibial | Control | |||
|---|---|---|---|---|---|---|---|---|---|---|
| Amputated | Intact | Amputated | Intact | |||||||
| Medial knee force (BW) | DS1 | Mean | 0.87 ± 0.21 | 1.10 ± 0.26 | 0.92 ± 0.21 | Peak | 1.34 ± 0.30 | 1.80 ± 0.41 | 1.46 ± 0.32 | |
| P-value | .013a, .687b | .124b | P-value | .007a, .459b | .080b | |||||
| ST | Mean | 1.39 ± 0.24 | 1.70 ± 0.34 | 1.59 ± 0.24 | Peak | 2.00 ± 0.44 | 2.89 ± 0.51 | 2.09 ± 0.38 | ||
| P-value | .028a, .124b | .588b | P-value | .001a, .711b | .005b | |||||
| DS2 | Mean | 1.00 ± 0.18 | 1.50 ± .47 | 0.86 ± 0.16 | Peak | 1.92 ± 0.43 | 2.85 ± 0.56 | 1.74 ± 0.21 | ||
| P-value | .005a, .128b | .005b | P-value | .001a, .335b | <.001b | |||||
| SW | Mean | 0.19 ± 0.07 | 0.14 ± 0.07 | 0.09 ± 0.03 | Peak | 0.35 ± 0.15 | 0.29 ± 0.13 | 0.18 ± 0.05 | ||
| P-value | .099a, <.001b | .097b | P-value | .367a, .002b | .079 | |||||
| Lateral knee force (BW) | DS1 | Mean | 0.88 ± 0.16 | 1.23 ± 0.31 | 0.90 ± 0.15 | Peak | 1.30 ± 0.33 | 1.79 ± 0.56 | 1.13 ± 0.22 | |
| P-value | .002a, .440b | .024b | P-value | .245a, .326b | .016b | |||||
| ST | Mean | 0.80 ± 0.16 | 0.83 ± 0.18 | 0.82 ± 0.19 | Peak | 1.56 ± 0.43 | 1.80 ± 0.37 | 1.20 ± 0.12 | ||
| P-value | .531a, .833b | .739b | P-value | .172a, .074b | .002b | |||||
| DS2 | Mean | 1.05 ± 0.39 | 1.23 ± 0.28 | 0.95 ± 0.05 | Peak | 1.56 ± 0.47 | 1.72 ± 0.43 | 1.24 ± 0.12 | ||
| P-value | .187a, .677b | .024b | P-value | .300a, .197b | .006b | |||||
| SW | Mean | 0.31 ± 0.09 | 0.29 ± 0.08 | 0.15 ± 0.02 | Peak | 0.56 ± 0.19 | 0.69 ± 0.31 | 0.29 ± 0.04 | ||
| P-value | .673a, .002b | .003b | P-value | .573a, .003b | .016b | |||||
| Total knee force (BW) | DS1 | Mean | 1.72 ± 0.27 | 2.30 ± 0.49 | 1.84 ± 0.23 | Peak | 2.64 ± 0.47 | 3.44 ± 0.79 | 2.53 ± 0.30 | |
| P-value | .003a, .382 | .022b | P-value | .010a, .459b | .012b | |||||
| ST | Mean | 2.21 ± 0.22 | 2.47 ± 0.36 | 2.30 ± 0.11 | Peak | 3.42 ± 0.49 | 4.34 ± 0.51 | 3.01 ± 0.19 | ||
| P-value | .078a, .307b | .322b | P-value | .001a, .054b | <.001b | |||||
| DS2 | Mean | 1.89 ± 0.26 | 2.67 ± 0.53 | 1.71 ± 0.35 | Peak | 3.33 ± 0.58 | 4.38 ± 0.54 | 2.68 ± 0.36 | ||
| P-value | .001a, .264b | .001b | P-value | .001a, .067b | <.001b | |||||
| SW | Mean | 0.44 ± 0.11 | 0.34 ± 0.11 | 0.21 ± 0.03 | Peak | 0.82 ± 0.30 | 0.81 ± 0.35 | 0.47 ± 0.10 | ||
| P-value | .045a, <.001b | .004b | P-value | .985a, .001b | .040b | |||||
- Note: Force is expressed as bodyweight (BW). Bold indicates statistically significant (P < .05, with Bonferroni correction for multiple comparisons).
- a Indicates difference between amputated and intact limbs.
- b Indicates difference from controls.
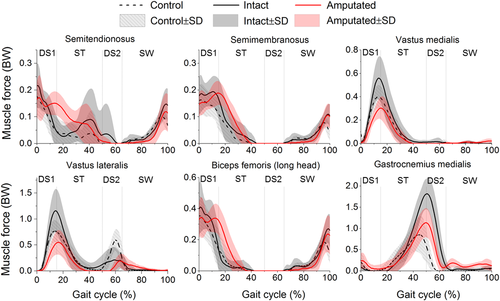
During early to mid-stance, individuals with TTA had higher muscle forces on the intact semimembranosus (SemM; adjusted mean difference [95% CI] = 0.06 [0.01, 0.13] BW; P = .001) in comparison with controls (Figure 6; Table 3). During middle to terminal stance intact gastrocnemius medialis (GasM) had higher peak forces (adjusted mean difference [95% CI] ≥ 0.94 [0.58, 1.30] BW, P < .001) than controls.
| Name | Phase | Quantity | Unilateral transtibial | Control | Name | Phase | Quantity | Unilateral transtibial | Control | ||
|---|---|---|---|---|---|---|---|---|---|---|---|
| Amputated | Intact | Amputated | Intact | ||||||||
| SemT | DS1 | Peak | 0.21 ± 0.07 | 0.22 ± 0.08 | 0.18 ± 0.07 | SemM | DS1 | Peak | 0.21 ± 0.07 | 0.26 ± 0.06 | 0.18 ± 0.05 |
| P-value | .647a, .420b | .223b | P-value | .259a, .115b | .036b | ||||||
| ST | Peak | 0.16 ± 0.04 | 0.13 ± 0.03 | 0.08 ± 0.08 | ST | Peak | 0.15 ± 0.04 | 0.19 ± 0.08 | 0.10 ± 0.06 | ||
| P-value | .479a, .064b | .376b | P-value | .246a, .101b | .001b | ||||||
| DS2 | Peak | 0.01 ± 0.01 | 0.04 ± 0.01 | 0.00 ± 0.00 | DS2 | Peak | 0.00 ± 0.00 | 0.00 ± 0.01 | 0.00 ± 0.00 | ||
| P-value | .437a, .395b | .470b | P-value | .352a, 1.000b | .459b | ||||||
| SW | Peak | 0.12 ± 0.07 | 0.15 ± 0.06 | 0.11 ± 0.02 | SW | Peak | 0.11 ± 0.04 | 0.11 ± 0.04 | 0.08 ± 0.02 | ||
| P-value | .168a, .469b | .018b | P-value | .565a, .062b | .010b | ||||||
| VMed | DS1 | Peak | 0.31 ± 0.09 | 0.57 ± 0.18 | 0.41 ± 0.10 | VLat | DS1 | Peak | 0.54 ± 0.23 | 1.17 ± 0.42 | 0.78 ± 0.21 |
| P-value | .001a, .055b | .047b | P-value | <.001a, .044b | .038b | ||||||
| ST | Peak | 0.30 ± 0.10 | 0.53 ± 0.20 | 0.38 ± 0.10 | ST | Peak | 0.56 ± 0.24 | 1.11 ± 0.43 | 0.73 ± 0.20 | ||
| P-value | .004a, .171b | .081b | P-value | .001a, .128b | .051b | ||||||
| DS2 | Peak | 0.00 ± 0.01 | 0.02 ± 0.01 | 0.01 ± 0.01 | DS2 | Peak | 0.23 ± 0.14 | 0.29 ± 0.13 | 0.62 ± 0.23 | ||
| P-value | .138a, .321b | .548b | P-value | .486a, .001b | .036b | ||||||
| SW | Peak | 0.03 ± 0.02 | 0.02 ± 0.01 | 0.01 ± 0.02 | SW | Peak | 0.19 ± 0.15 | 0.18 ± 0.12 | 0.16 ± 0.13 | ||
| P-value | .011a, .020b | .979b | P-value | .985a, .750b | .778b | ||||||
| BFLH | DS1 | Peak | 0.42 ± 0.09 | 0.46 ± 0.14 | 0.37 ± 0.12 | GasM | DS1 | Peak | 0.28 ± 0.17 | 0.10 ± 0.10 | 0.21 ± 0.23 |
| P-value | .525a, .310b | .154b | P-value | .015a, .491b | .256 | ||||||
| ST | Peak | 0.31 ± 0.10 | 0.10 ± 0.12 | 0.12 ± 0.12 | ST | Peak | 1.14 ± 0.34 | 1.83 ± 0.36 | 0.92 ± 0.36 | ||
| P-value | .001a, .003b | .875b | P-value | <.001a, .250b | <.001b | ||||||
| DS2 | Peak | 0.00 ± 0.00 | 0.00 ± 0.01 | 0.00 ± 0.00 | DS2 | Peak | 1.12 ± 0.34 | 1.82 ± 0.38 | 0.48 ± 0.33 | ||
| P-value | .352a, 1.000b | .459b | P-value | <.001a, .002b | <.001b | ||||||
| SW | Peak | 0.24 ± 0.12 | 0.28 ± 0.09 | 0.19 ± 0.05 | SW | Peak | 0.15 ± 0.09 | 0.13 ± 0.13 | 0.06 ± 0.03 | ||
| P-value | .304a, .171b | .007b | P-value | .028a, .000b | .165 | ||||||
- Note: Force is expressed as bodyweight (BW). Bold indicates statistically significant (P < .05, with Bonferroni correction for multiple comparisons). Muscle symbols in the figure are: SemT, SemM, VMed, VLat, BFLH, and GasM (semitendinosus, semimembranosus, vastus medialis, vastus lateralis, biceps femoris long head, and gastrocnemius medialis).
- a Indicates difference between amputated and intact limbs.
- b Indicates difference from controls.
The amputated limbs, when compared to the intact limbs, had lower peak muscle forces ofthe VLat (adjusted mean difference [95% CI] ≥ 0.57 [0.26, 0.88] BW; P ≤ .001,) VMed (adjusted mean difference [95% CI] ≥ 0.23 [0.08, 0.37] BW; P ≤ .004), and GasM (adjusted mean difference [95% CI] = 0.71 [0.37, 1.06] BW; P < .001) during double supports.
4 DISCUSSION
This study is the first to have fully quantified knee joint biomechanics for a recent military cohort with unilateral transtibial amputation, all of whom have achieved a high level of function through an advanced intensive rehabilitation programme and utilizing state of the art prosthetics. This study has found that forces on both medial and lateral knee compartments of the intact knee are higher than for the control group. This may explain the higher risk of contralateral knee pain and OA reported for the TTAs.4-7 However, the hypothesis that the amputated limb produced less knee joint loading in comparison with the controls was not supported.
The external knee adduction moment is acommon surrogate measure of knee contact force and its distributions at the medial/lateral knee compartments: its higher value especially the higher first peak value during gait has been shown to be a strong predictor of the presence40, 41 and progression10 of medial knee OA. This study showed a trend for an increased first peak knee adduction moment at the intact limb in comparison with the controls (adjusted mean difference [95% CI] = 0.011 [0.001, 0.021] N m/BW); however, this is not statistically significant.
The quadriceps and hamstrings muscle forces are the main contributors to the knee contact forcethrough initial contact to mid-stance42-44: increasedlateral muscleforces (VLat and BFLH) will generate a higher internal abduction moment (Figure 1B); conversely, increased medial muscle forces (VMed, SemT, and SemM) will generate a higher internal adduction moment. The net adduction moment alone therefore cannot account for the contribution from these surrounding muscles at the knee explicitly and sufficiently. In amputee gait, the loss of active control of the ankle joint prevents the amputated limb from using dorsiflexion during swing to aid in clearing the toe. The amputated limb was found to have a longer swing time followed by a shorter stance time.45 This may contribute to a more abrupt landing of the contralateral limb which occurred in the first double support: our results displayed a significantly greater maximum knee loading rate (Figure 3; P = .014), accompanied by a higher range of knee motion, which may beattributed to the additional stability required in a reduced loading response time. As a result, greater intact quadriceps and hamstrings muscle forces were found: increased VMed and SemM forces caused a significantly greater force at the medial knee compartment (adjusted mean difference by up to 0.80 BW), and increased VLat and BFLH forces caused a significantly greater force on the lateral knee compartment (adjusted mean difference by up to 0.60 BW). In total, the first peak knee contact force was significantly increased (adjusted mean difference [95% CI] = 1.36 [0.92, 1.80] BW; P ≤ .001; Table 2).
The gastrocnemius is the predominant contributor to knee contact force during late stance in non-amputee gait.46 In amputee gait, due to the poor loading control by the prosthetic foot and the absence of ankle plantar flexors, excessive propulsion from the contralateral foot was required, as indicated by an increased peak of intact gastrocnemius (Figure 6); greater intact gastrocnemius force increased the second peak knee contact force (adjusted mean difference [95% CI] = 1.72 [1.22, 2.23] BW; P ≤ .001) in comparison with controls.
Asymmetric knee joint mechanics was found as the peak knee contact force for the amputated limbs was significantly lower than the intact limbs (adjust mean difference [95% CI], 1.06 [0.52, 1.61] BW; P = .001; Table 2). Following the initial contact of the prosthetic foot, a lower knee flexion/extension was observed at the amputated limbs (Figure 2). In addition, a longer time was spent in loading response, as indicated by a significantly decreased knee loading rate and a delay in the initial peak knee moment in comparison with the intact limbs (Figure 4). This is consistent work previously reported20 and believed to be relative to the socket construction.47 Our data revealed that the amputated VLat, VMed, and GasM muscles produced lower peak forces, resulting in a substantial reduction of the overall knee contact force, in comparison to the intact limbs.
The previously hypothesized mechanisms to protect the amputated limbs were not found in this study. Prior work has reported a considerably lower OA risk to the amputated limbs,6, 7 yet these are based on older populations with longer time from amputation. It is known that muscle volume and strength decreases with time since amputation47, 48; this could result in lower forces from the atrophied muscles, leading to the lower compression at the knee. It is possible, therefore, that the cohort in this study (average ages of 28 years with 2 years since amputation) has not had time to present with this difference in the muscle morphology and strength. Additionally, the use of the advanced prosthetic feet improved push-off as indicated by the second peak of GRF, which has no difference in comparison with the controls (Figure 3). However, this didn't mitigate the peak at the intact limbsin the loading response phase.
The effect of myodesis stabilization of amputated muscle was investigated. This surgical procedure results in a decreased moment arm of the amputated gastrocnemius, thus the substantially higher force in comparison with the controls is to be expected.34 Furthermore, the similar activation pattern to the intact limb highlights that the gastrocnemius has an important role as a knee flexor in mid-stance as well as at the ankle, something which is often over-looked in descriptions of amputee gait. The current TTA model is based on the assumption that the PCSA, maximum isometric strength (and resting length, although not modeled here) are unaffected relative to able-bodied muscles. Future work should explore all of these variables.
In this study, modeled muscle activations were validated against EMG signals. Similar activation patterns were observed, including strong activation of the gluteal muscles (GMax and GMed) in weight acceptance; activation of the hamstrings (BFLH and SemT) in early to mid-stance, and terminal swing; and activation of the quadriceps (VMed and VLas) during stance (Figure S1). The largest temporal inconsistency was found on TFL with phase error of 0.33. In total the mean combined errors from both the intact and amputated limb models were 0.29, comparable with the errors from other validation studies.22, 30 A direct validation of the amputated gastrocnemius would have been desirable, however our pilot study found that surface EMG could not be obtained without significant discomfort to the participants. Therefore, modeled activations were compared to the literature18 and a consistent pattern was found. As an indirect validation, modeled peak knee contact force from controls in this study (3.0 ± 0.2 BW) was comparable with the in-vivo measured knee contact force ranging from 1.8 to 3.0 BW during gait.49
There are a number of limitations to this study. First, the articular joint geometry (such as the knee alignment and contact locations) and muscle attachments were not personalized between individuals. These parameters were found to affect the results of knee contact forces and muscle forces significantly.50 This limitation may explain the larger phase errors between EMG and muscle activations in TFL and Sol, when compared to the phase errors from subject-specific musculoskeletal models.31 Second, the body segment parameters of the amputated and intact limbs were identical in this study. A measure of the prosthetic componentsand the stump in the future study will allow a better investigation of the effect from the socket type, socket/stump interface and prosthetic foot. Third, the amputated limb was modeled consistently as a series of rigid body segments, following the common approach used in inverse-dynamics. However, the prosthetic components differ remarkably among TTAs (Table 1) and some elastic components in the prosthetic feet (for example, the composite spring in Echelon VT and Re-Flex Shock) mean that the effect of this assumption needs to be assessed; others have incorporated this effect.51
In summary, this study is the first to have fully quantified the mechanical loading of the muscles and on the articulating surface of the knee for military unilateral TTAs with high functional outcomes. Medial and lateral knee joint forces of the intact limb throughout stance are higher than for a control group. Use of the external knee adduction moment alone did not show statistical differences between limbs, demonstrating that an analysis of joint contact force and muscle force is required in these studies. This increased loading supports the mechanically based hypothesis to explain the documented higher risk of knee OA in this patient group. Our results suggest protentional mitigation strategies for this higher knee load. These include improvements to the prosthetic foot control, socket design, and strengthening of the amputated muscles.
ACKNOWLEDGMENTS
This work was conducted under the auspices of the Royal British Legion Centre for Blast Injury Studies at Imperial College London. The authors would like to acknowledge the financial support of the Royal British Legion.
CONFLICT OF INTERESTS
The authors declare that there are no conflict of interests.
AUTHOR CONTRIBUTIONS
All authors contributed to the conception and design of the study, manuscript draft and final approval. Data acquisition: ZD and HLJ. Model development and kinematics/kinetics calculation: ZD and AMJB. Analysis and interpretation of data: ZD, HLJ, AMJB, RB, and ANB.


