Inflammatory cytokines induce specific time- and concentration-dependent MicroRNA release by chondrocytes, synoviocytes, and meniscus cells
ABSTRACT
In knee osteoarthritis (OA), concentrations of interleukin (IL)-1β and tumor necrosis factor (TNF)-α increase in joint tissues and synovial fluid which incite a catabolic cascade and further the progression of OA. Several microRNAs (miRNA) have been associated with apoptosis (miR-16), inflammation (miR-22, miR-146a), and matrix degradation (miR-140, miR-27b) in developed OA or its symptoms. In this study, the time- and concentration-dependent nature of cellular and extracellular miRNAs in synoviocytes, meniscus cells, and chondrocytes as influenced by inflammatory cytokines was investigated. For time-dependent studies, three cell types were stimulated with 10 ng/ml IL-1β or 50 ng/ml TNF-α for 8, 16, and 24 h. For concentration-dependent studies, chondrocytes were stimulated with a higher level of IL-1β (20 ng/ml) or TNF-α (100 ng/ml) for 8 h. Cellular and extracellular expressions of miR-22, miR-16, miR-146a, miR-27b, and miR-140 were analyzed by RT-PCR. Time-dependent cellular miRNA expressions were similar across the three cell types with miR-146a significantly up-regulated and miR-27b significantly down-regulated at all time points. However, chondrocytes exhibited a unique extracellular miRNA profile with an increased release rate of miR-27b at 24 h. Our findings support further research into the characterization of miRNAs in synovial fluid for the development of early detection strategies of OA or cartilage injury. © 2015 Orthopaedic Research Society. Published by Wiley Periodicals, Inc. J Orthop Res 34:779–790, 2016.
Osteoarthritis (OA) is the most prevalent joint disease in the United States, affecting more than 27 million Americans.1 Currently, there are no reliable methods of diagnosing OA before radiological evidence of the disease develops, which hinders the effectiveness of therapies and potential preventative measures. Several studies have investigated the expression of molecular by-products of cartilage degeneration, such as cytokines and matrix fragments, as potential biomarkers of OA.2-4 However, these techniques require the degeneration process to have begun, resulting in irreversible cartilage damage already at the time of diagnosis.
MicroRNAs (miRNAs) are a type of short non-coding RNA that regulate the expression of various genes post-transcriptionally.5, 6 In brief, miRNAs negatively regulate target messenger RNA (mRNA) post-transcriptionally by promoting degradation, deadenylation, or repression of translation.7 MiRNAs have been shown to be released into the serum and synovial fluid in a quite stable form, and that miRNAs released from cells may be by-products of necrotic or apoptotic cells during disease.8-10 With the discovery of stable miRNAs in both tissues and body fluids, a great number of publications have already described certain miRNAs as biomarkers of breast, colon, gastric, lung, oral, ovarian, pancreatic, prostate, tongue, and squamous cell cancers (Review; Brase et al.)11. Therefore, differential expressions of miRNAs in the synovial fluid may be suitable as potential non-invasive biomarkers of OA progression.
OA is considered an inflammatory disease.12, 13 Interleukin (IL)-1β and Tumor Necrosis Factor (TNF)-α are the main inflammatory cytokines the expressions of which are often upregulated in the early stage of OA. Since the miRNAs found in the synovial fluid are comprised of miRNAs not only from cartilage but also from the meniscus and synovial membrane, understanding of miRNA release by chondrocytes, synoviocytes, and meniscus cells under the inflammatory state (e.g., treatment of IL-1 β and TNF- α) seen in OA joint can help identify potential extracellular miRNA indicators of OA progression. Several miRNAs have been evaluated in the literature as genetic markers of cartilage degeneration (miR-140,14 miR-27b15), apoptosis (miR-16)16, and inflammation (miR-22,17 miR-146a18) in developed OA or its symptoms. MiR-27b directly regulates the expression of matrix metalloproteinase (MMP)-13 in human chondrocytes.15 Altered expressions of miR-146a and miR-22 are mediated by inflammatory cytokines17, 19 and widely seen in low-grade osteoarthritis,18 implicating a role in cartilage pathogenesis. MiR-140 has been identified as a direct regulator of aggrecanase-214 and has decreased expression in OA chondrocytes. Although not yet observed in orthopedic tissues, miR-16 has been shown to directly regulate the expression of a critical inhibitor of apoptosis, B cell lymphoma (BCL)-2.16 Therefore, since the intracellular expression of those miRNAs (miR-140, miR-27b, miR-16, miR-22, and miR-146a) are strongly influenced by developed OA, their extracellular expression could be altered during OA development and potentially serve as biomarkers.
In this study, the time- and concentration-dependent nature of cellular and extracellular miRNAs (miR-140, miR-27b, miR-16, miR-22, and miR-146a) in chondrocytes, synoviocytes, and meniscus cells as influenced by inflammatory cytokines under in-vitro culture and the ratio of extracellular miRNA were analyzed as potential indicator of early OA progression.
MATERIALS AND METHODS
Cell Culture
Six cadaveric porcine knees from three 35–40 kg pigs were obtained from the University of Miami Department of Surgery Tissue Sharing program (Institutional Animal Care and Use Committee approved source) within 2 h of death. Articular cartilage, meniscus, and synovial membrane tissues were cut into small pieces less than 1 mm3 and digested with 1 mg/ml collagenase (Worthington Biochemical, Lakewood, NJ) and 0.1 mg/ml protease (Sigma, St. Louis, MO) at 37°C for 16 h. Digested cell suspension was strained through a 70 μm cell strainer (BD Biosciences, San Jose, CA) and cultured in regular culture media [DMEM (Invitrogen, Grand Island, NY) containing 10% Fetal Bovine Serum (FBS; Gibco, Grand Island, NY) and 1% penicillin/streptomycin (Lonza, Allendale, NJ)] at 37°C in a humidified atmosphere of 5% CO2. During culture, media was changed every 2–3 days. Cultures of synoviocytes, meniscus cells, and chondrocytes were subjected to experimental procedures at passages 1–3.
Stimulation of Cells With IL-1β and TNF-α
Synoviocytes, meniscus cells, and chondrocytes were plated in triplicate at a density of 105 cells per well in a 24-well plate and were allowed to adhere overnight in 1 ml regular culture media. Wells of each cell type were washed with 1 ml phosphate-buffered saline (PBS) (Lonza, Allendale, NJ) to remove all traces of regular culture media with FBS. To determine the time-dependent cellular and extracellular miRNA expression after cytokine injury, cell types were stimulated for 8, 16, or 24 h with IL-1β (10 ng/ml) or TNF-α (50 ng/ml) (both from Peprotech, Rocky Hill, NJ) in 400 μL serum-free media [DMEM containing 1% penicillin/streptomycin and 1% ITS-Premix Supplement (BD Biosciences, San Jose, CA)]. To determine the concentration-dependent cellular and extracellular miRNA expression after cytokine injury, chondrocytes were stimulated for 8 h with IL-1β (10 or 20 ng/ml) or TNF-α (50 or 100 ng/ml) in 400 μL serum-free media.
The use of serum-free media eliminates the possibility of contamination with exogenous bovine miRNAs from serum.20 Although eliminating serum from cell culture media is a strong biological stimulus on its own, the cell cycle arrest or death commonly associated with serum depletion occurs mostly after 48 h of culture.21, 22 Normalization to the control group would eliminate any effects of serum depletion from the data. Cells in control group were left unstimulated in 400 μL serum-free media. This study utilized three groups per cell type per time point: Control, IL-1β stimulation, and TNF-α stimulation.
Ratio of Extracellular miRNA
 (1)
(1)Viable Cell Count Analysis
To ensure consistent cell number within time points, three cell types were plated in triplicate as described above and stimulated with 10 ng/ml IL-1β or 50 ng/ml TNF-α for 8, 16, and 24 h. Chondrocytes were also stimulated with 20 ng/ml IL-1β or 100 ng/ml TNF-α for 8 h. Immediately after each time point, the culture media was removed from the wells, and the cells were incubated in PBS containing 1 µmol/L calcein AM from the Live/ Dead Viability/Cytotoxicity Kit (Invitrogen). Staining was visualized on an inverted fluorescent microscope with 495 nm/515 nm excitation/emission for calcein (live cells). Images were taken from the center of well in the 24-well plate through a 10× objective lens. The images were analyzed with ImageJ software, and total number of live cells/image was determined.
RNA Isolation and Quantitative Real-Time PCR
Total RNA from cells was extracted using 250 μL per well Tri Reagent per manufacturer's instruction (Molecular Research Center, Cincinnati, OH). To isolate extracellular miRNAs from media samples, the media from each well in each group was combined (1.2 ml) and concentrated 10 times using 10 kDa MWCO columns (Millipore, Darmstadt, Germany), as described by Turchinovich et al.8 Extracellular miRNAs from concentrated media samples were isolated using RNeasy Isolation kit (Qiagen, Venlo, Netherlands) per manufacturer's protocol. Prior to first spin in the protocol, 5 pg of synthetic miRNA-39 from Caenorhabditis elegans (cel-miR-39) were added as a spike-in control for media samples. RNA was eluted in 30 μL of RNase-free water.
For miRNA expression analyses, the qScript microRNA cDNA synthesis kit (Quanta Biosciences, Gaithersburg, MD) was used to polyadenylate miRNAs and synthesize cDNA from total RNA following manufacturer's instructions. For cell samples, 0.1 μg of total RNA containing miRNA was used for reverse transcription. For media samples, a fixed volume of 7 μL of total RNA from the 30 μL eluate of a given sample was used for reverse transcription. Genetic expression of selected miRNA and mRNA (Table 1) was analyzed by SteponePlus (Applied Biosystems, Grand Island, NY) quantitative real-time PCR system. Expression of RNU6B was used as an endogenous control for miRNA expression in cells. Quantification of expression levels was determined by the 2–ΔΔCt method23 and normalized to expression levels of respective control group.
| Gene | Primer Sequences | Reference/miRbase# |
|---|---|---|
| cel-miR-39-3p | 5′-TCACCGGGTGTAAATCAGCTTG-3′ | MIMAT0020306 |
| hsa-miR-146a-5p | 5′-TTTGAGAACTGAATTCCATGGGTTG-3′ | MIMAT0000449 |
| hsa-miR-22-5p | 5′-AGTTCTTCAGTGGCAAGCTTTA-3′ | MIMAT0000077 |
| hsa-miR-16-1-3p | 5′-TAGCAGCACGTAAATATTGGCG-3′ | MIMAT0004489 |
| hsa-miR-140-5p | 5′- AGTGGTTTTACCCTATGGTAG-3′ | MIMAT0000431 |
| hsa-miR-27b-5p | 5'- AGAGCTTAGCTGATTGGTGAACA -3' | MIMAT0004588 |
| RNU6B | F: 5′-GCTTCGGCAGCACATATACTAAAAT-3′ | 24 |
| R: 5′-CGCTTCACGAATTTGCGTGTCAT-3′ | ||
| 18S | F: 5′-CGGCTACCACATCCAAGGA-3′ | 25 |
| R: 5′-AGCTGGAATTACCGCGGCT-3′ | ||
| CASP3 | F: 5′-GCTGCAAATCTCAGGGAGAC-3′ | 25 |
| R: 5′-GGCAGGCCTGAATTATGAAA-3′ |
Statistical Analysis
Five independent experiments with different cell preparations (n = 5) for each cell type were performed per time point and per stimulation concentration, each with different cell preparation. The statistical significance of the time-dependent differences in miRNA expression per cell type was calculated using two-sample Student's t-test (MATLAB R2014a). The statistical significance of viable cell number and the concentration-dependent differences in miRNA expression was calculated using analysis of variance (ANOVA), followed by Tukey's HSD post-hoc test. All tests were two-tailed and p-values <0.05 were considered statistically significant. Pearson correlation analysis was performed to determine the correlation between intracellular and extracellular miRNA expression. For each miRNA correlation analysis, intracellular and extracellular miRNA expressions from the three cell types, the three time points, and the “low” cytokine stimulation (10 ng/ml IL-1β and 50 ng/ml TNF-α) were combined. The same correlation analyses for each miRNA were also performed for individual cell types.
RESULTS
Time-Dependent miRNA Expression of Knee Tissue Cells After Cytokine Stimulation
Several trends were observed in cellular miRNA expressions among cell types elicited by the pro-inflammatory cytokines (Tables 2 and 3). MiR-146a was the only miRNA to be significantly up-regulated in all three cell types by both IL-1β and TNF-α at 8, 16, and 24 h (Tables 2 and 3 for p-values). In contrast, in all cells stimulated by IL-1β or TNF-α, cellular expression of miR-27b was significantly down-regulated or tended for down-regulation at 8, 16, and 24 h with the exception of IL-1β-stimulated chondrocytes and meniscus cells at 24 h. Notably, there was an observed TNF-α-dependency in cellular miR-16 expression with significant down-regulation of miR-16 at multiple time points, whereas no significant difference in miR-16 expression was found in IL-1β-stimulated cells at any time point. Chondrocyte and meniscus cell expressions of miR-140 were significantly down-regulated at only 24 h by IL-1β and TNF-α, whereas synoviocyte expression of miR-140 was significantly down-regulated at only 8 h by IL-1β and TNF-α.
| 8 h | 16 h | 24 h | |||||||
|---|---|---|---|---|---|---|---|---|---|
| Mean | SE | p | Mean | SE | p | Mean | SE | p | |
| Chondrocytes +10 ng/ml IL-1β | |||||||||
| miR-22 | 1.09 | 0.11 | 0.6158 | 0.86 | 0.12 | 0.2132 | 0.80 | 0.17 | 0.0378 |
| miR-16 | 0.92 | 0.12 | 0.2208 | 0.90 | 0.09 | 0.1861 | 1.24 | 0.33 | 0.1844 |
| miR-146a | 33.2 | 10.90 | 0.0048 | 16.5 | 4.20 | <0.001 | 13.63 | 4.26 | <0.001 |
| miR-140 | 1.07 | 0.09 | 0.8109 | 0.90 | 0.12 | 0.2999 | 0.58 | 0.19 | 0.0012 |
| miR-27b | 0.73 | 0.10 | 0.0028 | 0.76 | 0.09 | 0.0598 | 0.96 | 0.24 | 0.7279 |
| Meniscus Cells + 10 ng/ml IL-1β | |||||||||
| miR-22 | 1.27 | 0.12 | 0.0040 | 1.19 | 0.06 | 0.1140 | 0.78 | 0.10 | 0.1647 |
| miR-16 | 1.13 | 0.13 | 0.2025 | 1.17 | 0.17 | 0.3416 | 0.89 | 0.19 | 0.2164 |
| miR-146a | 7.56 | 2.64 | 0.0011 | 6.36 | 1.60 | <0.001 | 4.34 | 1.56 | <0.001 |
| miR-140 | 1.14 | 0.18 | 0.4299 | 1.20 | 0.22 | 0.3679 | 0.60 | 0.23 | 0.0484 |
| miR-27b | 0.74 | 0.08 | <0.001 | 0.78 | 0.08 | 0.0081 | 1.34 | 0.51 | 0.9380 |
| Synoviocytes + 10 ng/ml IL-1β | |||||||||
| miR-22 | 1.26 | 0.22 | 0.0922 | 1.05 | 0.12 | 0.9816 | 0.86 | 0.15 | 0.1810 |
| miR-16 | 1.09 | 0.12 | 0.2762 | 0.96 | 0.08 | 0.8550 | 1.26 | 0.25 | 0.2396 |
| miR-146a | 9.49 | 2.71 | <0.001 | 7.70 | 1.63 | <0.001 | 10.47 | 3.07 | <0.001 |
| miR-140 | 1.21 | 0.12 | 0.0409 | 1.16 | 0.15 | 0.4246 | 1.39 | 0.47 | 0.4317 |
| miR-27b | 0.83 | 0.09 | 0.0230 | 0.74 | 0.09 | 0.009 | 0.73 | 0.15 | 0.0401 |
- p-values < 0.05 were considered significant.
- The values in bold are the p-values that indicate significance.
| 8 h | 16 h | 24 h | |||||||
|---|---|---|---|---|---|---|---|---|---|
| Mean | SE | p | Mean | SE | p | Mean | SE | p | |
| Chondrocytes + 50 ng/ml TNF-a | |||||||||
| miR-22 | 0.97 | 0.15 | 0.6234 | 0.73 | 0.09 | 0.0105 | 0.67 | 0.17 | 0.0020 |
| miR-16 | 1.12 | 0.24 | 0.5183 | 0.76 | 0.09 | 0.0087 | 0.95 | 0.22 | 0.6909 |
| miR-146a | 5.99 | 1.05 | <0.001 | 6.98 | 1.98 | <0.001 | 7.76 | 3.36 | <0.001 |
| miR-140 | 0.74 | 0.16 | 0.0534 | 0.88 | 0.17 | 0.3370 | 0.59 | 0.14 | <0.001 |
| miR-27b | 0.53 | 0.06 | <0.001 | 0.43 | 0.07 | <0.001 | 0.67 | 0.17 | 0.0023 |
| Meniscus Cells + 50 ng/ml TNF-α | |||||||||
| miR-22 | 1.08 | 0.20 | 0.5730 | 1.05 | 0.16 | 0.7284 | 0.54 | 0.13 | 0.0054 |
| miR-16 | 0.92 | 0.23 | 0.5591 | 1.08 | 0.17 | 0.7352 | 0.62 | 0.20 | 0.0130 |
| miR-146a | 2.62 | 0.67 | 0.0015 | 6.56 | 0.98 | <0.001 | 5.15 | 2.98 | 0.0267 |
| miR-140 | 0.83 | 0.19 | 0.1575 | 1.14 | 0.21 | 0.5439 | 0.63 | 0.18 | 0.0371 |
| miR-27b | 0.53 | 0.09 | <0.001 | 0.62 | 0.11 | <0.001 | 0.37 | 0.10 | 0.0028 |
| Synoviocytes + 50 ng/ml TNF-α | |||||||||
| miR-22 | 0.77 | 0.12 | 0.0114 | 0.91 | 0.17 | 0.4501 | 0.54 | 0.10 | <0.001 |
| miR-16 | 0.57 | 0.14 | <0.001 | 0.90 | 0.11 | 0.2646 | 0.59 | 0.11 | 0.0016 |
| miR-146a | 2.99 | 0.80 | 0.0017 | 8.52 | 1.86 | <0.001 | 4.82 | 0.83 | <0.001 |
| miR-140 | 0.65 | 0.15 | 0.0054 | 1.10 | 0.17 | 0.7398 | 0.74 | 0.15 | 0.1061 |
| miR-27b | 0.42 | 0.06 | <0.001 | 0.73 | 0.19 | 0.0819 | 0.38 | 0.12 | <0.001 |
- p-values < 0.05 were considered significant.
- The values in bold are the p-values that indicate significance.
Time-Dependent Release of Extracellular miRNA by Knee Tissue Cells After Cytokine Stimulation
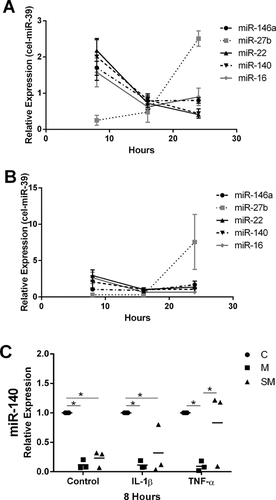
Extracellular miRNA release rate after stimulation differed among the cell types. Notably, chondrocytes had a distinct extracellular miRNA profile after cytokine stimulation as compared to the other two tissues (Tables 4 and 5). Although there was a general decline of most extracellular miRNA release rate beyond the 8 h time point, only extracellular miR-27b increased over time in chondrocyte media after IL-1β and TNF-α stimulation (Fig. 1A and B). At 8 h, release of extracellular miR-140 in meniscus cell and synoviocyte media were significantly lower than that in chondrocyte media in control (p = 0.009 and 0.025, respectively) and IL-1β-stimulated groups (p = 0.009 and 0.05, respectively) (Fig. 1C). Extracellular miR-140 in TNF-α-stimulated meniscus cell media was significantly lower than that in chondrocyte and synoviocyte media (p = 0.008 and 0.032, respectively). Within each time point and cell type, the number of viable cells per well in each group was not significantly different from each other (data not shown).
| 8 h | 16 h | 24 h | |||||||
|---|---|---|---|---|---|---|---|---|---|
| Mean | SE | p | Mean | SE | p | Mean | SE | p | |
| Chondrocyte media + 10 ng/ml IL-1ß | |||||||||
| miR-22 | 2.18 | 0.30 | 0.0017 | 0.72 | 0.17 | 0.1498 | 0.41 | 0.05 | <0.001 |
| miR-16 | 1.58 | 0.40 | 0.0210 | 0.62 | 0.15 | 0.0460 | 0.90 | 0.24 | 0.6157 |
| miR-146a | 1.70 | 0.35 | 0.0130 | 0.79 | 0.19 | 0.2857 | 0.80 | 0.08 | 0.0157 |
| miR-140 | 2.01 | 0.51 | 0.0370 | 0.82 | 0.11 | 0.1692 | 0.44 | 0.13 | <0.001 |
| miR-27b | 0.25 | 0.14 | 0.0047 | 0.48 | 0.28 | 0.3590 | 2.51 | 0.21 | 0.0066 |
| Meniscus Cell media + 10 ng/ml IL-1β | |||||||||
| miR-22 | 2.98 | 0.85 | 0.0330 | 0.48 | 0.11 | 0.0024 | 1.05 | 0.18 | 0.7557 |
| miR-16 | 4.14 | 1.31 | 0.0294 | 1.34 | 0.34 | 0.3482 | 0.86 | 0.16 | 0.3025 |
| miR-146a | 5.51 | 3.28 | 0.1541 | 0.89 | 0.21 | 0.6067 | 2.12 | 0.75 | 0.0929 |
| miR-140 | 4.75 | 2.01 | 0.0691 | 0.94 | 0.29 | 0.8443 | 0.63 | 0.17 | 0.0284 |
| miR-27b | 0.50 | 0.15 | 0.0428 | 0.48 | 0.06 | 0.0030 | 0.55 | 0.18 | 0.0135 |
| Synoviocyte media + 10 ng/ml IL-1β | |||||||||
| miR-22 | 1.25 | 0.36 | 0.0123 | 4.04 | 1.62 | 0.0969 | 0.93 | 0.19 | 0.6679 |
| miR-16 | 1.90 | 0.13 | 0.0205 | 1.07 | 0.35 | 0.8582 | 0.75 | 0.10 | 0.0164 |
| miR-146a | 3.05 | 0.18 | 0.0376 | 4.14 | 1.97 | 0.1487 | 1.15 | 0.16 | 0.3302 |
| miR-140 | 1.27 | 0.29 | 0.0188 | 2.19 | 0.67 | 0.1078 | 1.32 | 0.40 | 0.3884 |
| miR-27b | 0.56 | 1.10 | 0.4110 | 1.26 | 0.54 | 0.5967 | 2.47 | 0.94 | 0.0772 |
- p-values < 0.05 were considered significant.
- The values in bold are the p-values that indicate significance.
| 8 h | 16 h | 24 h | |||||||
|---|---|---|---|---|---|---|---|---|---|
| Mean | SE | p | Mean | SE | p | Mean | SE | p | |
| Chondrocyte media + 50 ng/ml TNF-α | |||||||||
| miR-22 | 2.95 | 0.79 | 0.0152 | 1.03 | 0.21 | 0.8812 | 1.35 | 0.24 | 0.0993 |
| miR-16 | 2.64 | 0.77 | 0.0268 | 0.65 | 0.16 | 0.0719 | 0.66 | 0.16 | 0.0307 |
| miR-146a | 1.05 | 0.16 | 0.7764 | 0.90 | 0.34 | 0.2857 | 1.68 | 0.50 | 0.1267 |
| miR-140 | 2.07 | 0.84 | 0.1465 | 1.03 | 0.16 | 0.8904 | 1.06 | 0.22 | 0.7401 |
| miR-27b | 0.29 | 0.09 | 0.0014 | 0.29 | 0.17 | 0.0810 | 7.57 | 3.79 | 0.1987 |
| Meniscus Cell media + 50 ng/ml TNF-α | |||||||||
| miR-22 | 2.04 | 0.48 | 0.0417 | 0.44 | 0.11 | <0.001 | 1.22 | 0.39 | 0.5010 |
| miR-16 | 1.41 | 0.40 | 0.2827 | 0.55 | 0.13 | 0.0100 | 1.43 | 0.31 | 0.1189 |
| miR-146a | 1.30 | 0.28 | 0.2453 | 0.58 | 0.18 | 0.0536 | 0.89 | 0.16 | 0.4263 |
| miR-140 | 2.27 | 0.58 | 0.0419 | 0.49 | 0.16 | 0.0144 | 1.13 | 0.10 | 0.1287 |
| miR-27b | 1.05 | 0.33 | 0.9062 | 0.61 | 0.46 | 0.2157 | 1.85 | 0.64 | 0.1207 |
| Synoviocyte media + 50 ng/ml TNF-α | |||||||||
| miR-22 | 1.29 | 0.19 | 0.1297 | 2.52 | 0.87 | 0.1198 | 1.55 | 0.70 | 0.3319 |
| miR-16 | 1.35 | 0.13 | 0.0155 | 0.85 | 0.14 | 0.3796 | 4.16 | 2.34 | 0.1162 |
| miR-146a | 1.30 | 0.21 | 0.1512 | 1.34 | 0.50 | 0.1491 | 3.60 | 1.69 | 0.2490 |
| miR-140 | 0.94 | 0.41 | 0.8809 | 1.51 | 0.50 | 0.3207 | 3.60 | 1.69 | 0.1178 |
| miR-27b | 2.11 | 0.87 | 0.2428 | 1.84 | 0.87 | 0.3103 | 1.50 | 0.83 | 0.2532 |
- p-values < 0.05 were considered significant.
- The values in bold are the p-values that indicate significance.
Ratio of Extracellular miRNA in Stimulated Culture Media
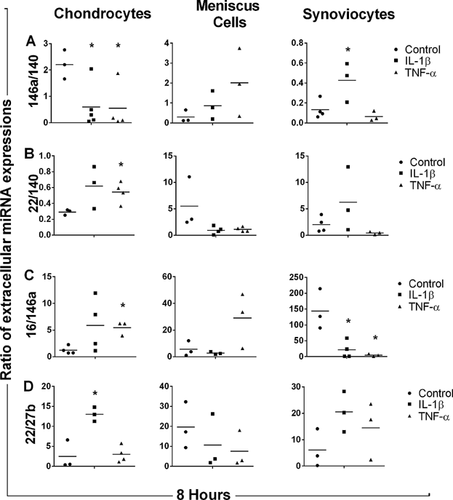
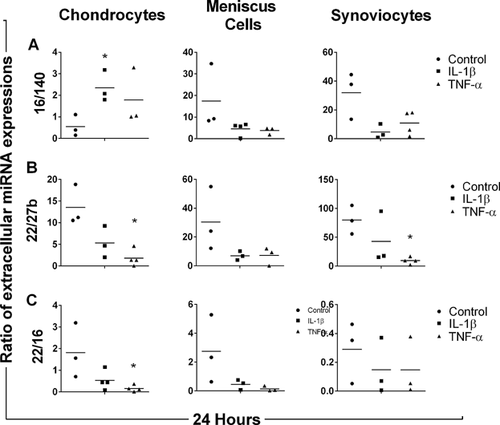
At 8 h after stimulation with 10 ng/ml IL-1β and 50 ng/ml TNF-α, the ratio of extracellular miR-146a to miR-140 expressions (Fig. 2A) of chondrocyte media was significantly decreased as compared to control (p = 0.025 and 0.036, respectively). However, the ratio of extracellular miR-146a to miR-140 expressions was significantly increased in IL-1β-stimulated synoviocyte media as compared to the control (p = 0.045). The ratio of extracellular miR-22 to miR-140 expressions was significantly increased only in chondrocytes stimulated with TNF-α (p = 0.025) (Fig. 2B). The ratio of extracellular miR-16 to miR-146a expressions was significantly increased in TNF-α-stimulated chondrocyte media (p = 0.003) whereas significantly decreased in IL-1β- and TNF-α-stimulated synoviocyte media (p = 0.017 and 0.019, respectively) (Fig. 2C). The ratio of extracellular miR-22 to miR-27b expressions was significantly increased only in IL-1β-stimulated chondrocyte media (p = 0.010) (Fig. 2D). However, no significant differences were found in any extracellular miRNA ratio for IL-1β- and TNF-α-stimulated meniscus cell medium after 8 h.
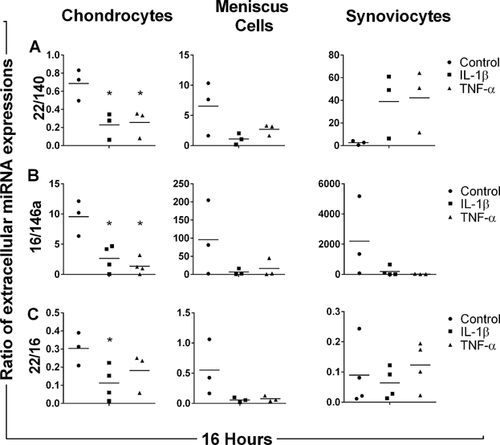
At 16 h, the ratio of extracellular miR-22 to miR-140 expressions (Fig. 3A) was significantly decreased in IL-1β- and TNF-α-stimulated chondrocyte media as compared to control (p = 0.025 and 0.032, respectively). The ratio of extracellular miR-16 to miR-146a expressions (Fig. 3B) was also significantly decreased in IL-1β- and TNF-α-stimulated chondrocyte media at 16 h as compared to control (p = 0.015 and 0.004, respectively). After 16 h of stimulation with IL-1β, the ratio of extracellular miR-22 to miR-16 expressions was significantly decreased (p = 0.043) (Fig. 3C). However, no significant differences were found in any extracellular miRNA ratio for IL-1β- and TNF-α-stimulated synoviocyte and meniscus cell medium after 16 h.
At 24 h, the ratio of extracellular miR-16 to miR-140 expressions (Fig. 4A) was significantly increased in IL-1β-stimulated chondrocyte media as compared to control (p = 0.024). The ratio of extracellular miR-22 to miR-27b expressions (Fig. 4B) was significantly decreased in TNF-α-stimulated chondrocyte and synoviocyte media at 24 h as compared to respective controls (p = 0.006 and 0.002, respectively). After 24 h of stimulation with TNF-α, the ratio of extracellular miR-22 to miR-16 was significantly decreased (p = 0.043) (Fig. 4C). However, no significant differences were found in any miRNA expression ratio for IL-1β- and TNF-α-stimulated meniscus cell medium after 24 h.
Concentration-Dependent miRNA Expression in Chondrocytes After Cytokine Stimulation
Chondrocytes were stimulated with 10 and 20 ng/ml IL-1β (Fig. 5A), and 50 and 100 ng/ml TNF-α (Fig. 5B) for 8 h. The higher concentration (20 ng/ml) of IL-1β significantly up-regulated cellular miR-22, -16, and -140 as compared to the lower IL-1β concentration (10 ng/ml) and controls (ANOVA p = 0.003, <0.001, and <0.001, respectively), whereas the IL-1β of 10 ng/ml did not exhibit any significant effects on those miRNA expression. Significant up-regulation of cellular miR-146a was seen at both IL-1β concentrations as compared to control (ANOVA p < 0.001). Cellular expression of miR-27b was not significantly affected by the higher concentration of IL-1β, whereas it was significantly down-regulated by the lower concentration of IL-1β as compared to the control (ANOVA p = 0.002). The same concentration-dependent effects on cellular expressions of miR-22, miR-146a, miR-140, and miR-27b were seen in TNF-α treated groups (all ANOVA p < 0.005) (Fig. 5B).
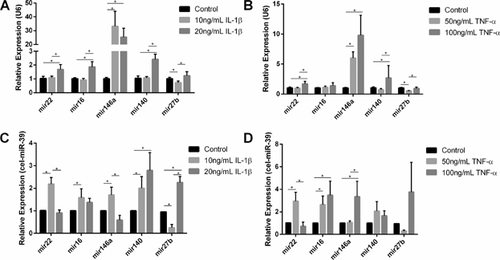
For extracellular miRNA expression, the lower IL-1β concentration significantly up-regulated extracellular miR-22, miR-16 and -146a expressions, whereas the higher IL-1β concentration did not cause significant differential expressions of those miRNAs as compared to control (ANOVA p < 0.001, 0.03, and 0.002, respectively) (Fig. 5C). Extracellular miR-27b expression was significantly increased at the higher IL-1β concentration, and however, significantly decreased at the lower IL-1β concentration as compared to control (ANOVA p = 0.002). Extracellular expression of miR-140 was significantly increased by both IL-1β concentrations as compared to the control (ANOVA p < 0.001). Stimulation with the higher TNF-α concentration (100 ng/ml) significantly up-regulated extracellular miR-16 and miR-146a (ANOVA p = 0.007 and 0.009, respectively) and exhibited no significant effect on extracellular miR-22 and miR-27b expressions as compared to the control (Fig. 5D). In contrast, the lower TNF-α concentration (50 ng/ml) significantly up-regulated extracellular miR-16 and miR-22 expressions (ANOVA p = 0.008 and <0.001, respectively) and exhibited no effect on extracellular miR-146a expression as compared to the control. Extracellular expression of miR-140 was not significantly affected by both TNF-α concentrations.
Correlation of Intracellular and Extracellular miRNA Expression After Cytokine Stimulation
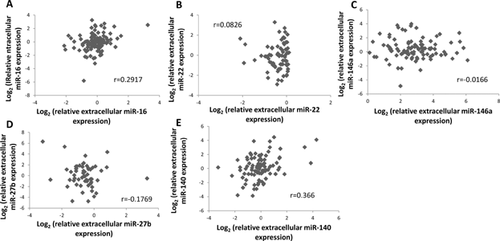
Pearson correlation analysis of intracellular and extracellular miRNA expression after cytokine stimulation showed weak correlation for miR-16 (r = 0.292) and miR-140 (r = 0.366) when all cell types were combined (Fig. 6A and E). However, in chondrocytes alone, intra- and extracellular expression of miR-140 was found to be highly correlated (r = 0.807). Intra- and extracellular expression of miR-140 in meniscus (r = 0.263) and synoviocytes (r = 0.199) showed weak correlation. Similarly, intra- and extracellular expression of miR-16 in chondrocytes showed slight correlation (r = 0.547), whereas in meniscus and synoviocytes, there was little to no correlation (r = 0.252 and −0.0586, respectively). There was little to no correlation of intra- and extracellular miR-27b, miR-146a, or miR-22 expressions when the three cell types were analyzed together and separately (all r < 0.2).
DISCUSSION
The present study is the first to examine the distinct cellular and extracellular miRNA spectra of chondrocytes, meniscus cells, and synoviocytes after stimulation with inflammatory cytokines. After traumatic joint injury and during OA development, inflammatory cytokine levels, including IL-1β and TNF-α, increase in the joint tissues, inciting cellular apoptosis, up-regulation of catabolic enzymes, and eventual cartilage degeneration.24-28 Better understanding of how the presence of inflammatory cytokines influences the genetic regulation and release of miRNAs in the joint tissues may help elucidate the role of miRNAs in OA development.
Prior to release from the cell, extracellular miRNAs are bound to protective proteins or encapsulated in exosomes which increase their stability in nuclease-rich environments, such as serum, synovial fluid, and culture media.20, 29, 30 Ceramide, a bioactive sphingolipid that is regulated by neutral sphingomyelinase 2, has been shown to be responsible for packing miRNA into exosomes in the cytosol for transport.31 Nucleophosmin 1 (NPM1) is an RNA-binding protein that binds to miRNA, protecting it from RNase degradation, and has been shown to be released with miRNA into the extracellular space.20, 32 Some previous studies suggest that extracellular release of individual mRNAs is directly proportional to their intracellular expressions.31, 33, 34 However, as suggested by other previous studies,20, 30, 35-38 cells may “selectively” export miRNA. The positive correlation exhibited by miR-16 and miR-140 supports the theory of proportional release (Fig. 6). However, the lack of correlation seen in intra- and extracellular miR-22, -146a, and -27b expressions support other theories. Additionally, since correlation between intra- and extracellular miRNA expression depends on cell type (e.g., chondrocytes exhibited a high correlation in miR-140 expression whereas meniscus and synoviocytes did not), intracellular response may influence extracellular release; therefore, miRNA release may not solely be proportional to its intracellular expression but could be influenced by other factors, such as inflammatory conditions examined in this study. For example, in chondrocytes stimulated with 10 ng/ml IL-1β for 8 h, we observed significant miR-146a up-regulation inside and outside the cell. However, while up-regulation of cellular miR-146a expression was still seen, extracellular expression of miR-146a was down-regulated in chondrocyte media as compared to the control after 24 h IL-1β treatment. It has been shown that expressions of the target mRNAs of miR-146a, such as IRAK1, were up-regulated by IL-1β.39 As time progresses and the up-regulation of its target mRNAs under IL-1β treatment, miR-146a becomes more “active” in the post-transcriptional process in attempt to inhibit the target mRNAs, which is reflected in the decreased release rate at 24 h. The selective release process may occur when a specific miRNA is relatively inactive in the post-transcription regulation than the other miRNAs present in the cytosol. Therefore, the extracellular miRNA spectra of stimulated or diseased cell may reflect the post-transcriptional activity of a specific miRNA.31, 34, 40
Extracellular miRNA expression analysis requires a suitable endogenous reference miRNA to minimize variation caused by different experimental conditions or sample source by normalization.41 This task has proven difficult over the years with many reports claiming multiple suitable reference miRNAs specific for each tissue.41-44 Currently, many extracellular miRNAs are used as references to normalize miRNAs in bodily fluid samples.42-44 In this study, we observed multiple ratios of extracellular miRNAs that were significantly altered by the presence of IL-1β and TNF-α. By utilizing the ratio of miRNAs in a sample, the need for an endogenous reference miRNA is eliminated. Also it was found that the cell types examined in our study exhibited different patterns of extracellular miRNA ratios (Figs. 2-4). The results suggest a method to examine the cellular status of chondrocytes for the early detection of OA or cartilage injury by analyzing extracellular miRNA in synovial fluid. Since only five miRNAs were examined in this study, more ratios from a larger miRNA pool will be investigated in future studies.
Although the miRNAs investigated in this study had been previously shown to be differentially expressed in IL-1β-stimulated or OA chondrocytes,45 this study also examined the intra- and extra-cellular expressions of the miRNAs of synoviocytes and meniscus cells and compared three cell types. Multiple studies reported a significant increase in miR-146a expression in IL-1β-stimulated and OA chondrocytes and synoviocytes,18, 39, 46 which was observed in our study not only in TNF-α and IL-1β-stimulated chondrocytes and synoviocytes, but also in TNF-α and IL-1β-stimulated meniscus cells. MiR-140, regulator of aggrecanase-2,14 was significantly decreased in both TNF-α and IL-1β-stimulated chondrocytes and meniscus cells, but not in stimulated synoviocytes, which can be attributed to the fact that meniscus and cartilage tissues naturally contain more aggrecan than synoviocytes.47 Expression of miR-27b, direct regulator of MMP-13,15 was significantly down-regulated in all cell types by both TNF-α and IL-1β. Although synovial tissue is not comprised of collagen II as are cartilage and meniscus tissues, it is possible that the down-regulation of miR-27b in synoviocytes indicates an increased production of MMP-13 to be released into the synovial fluid.48 Because the joint capsule is an enclosed environment, the altered genetic and miRNA expressions in tissues surrounding cartilage can potentially affect and propagate an acute injury or early OA development via paracrine action.30, 31, 49 Extracellular miRNA packaged in exosomes have also been shown to be readily taken up by surrounding cells.49 Therefore, it is necessary to examine both the intra- and extracellular miRNA profiles of all joint tissues under inflammatory or diseased conditions.
A limitation of this study is the small number of OA-associated miRNA expressions examined in cells and culture media. Therefore, future studies should further investigate the cellular and extracellular miRNA spectras from the three joint tissues using RNAseq technology. We also acknowledge that the concentrations of inflammatory cytokines used to stimulate the cells may not be representative of physiological injury or OA conditions. Further, IL-1 and TNF alone do not fully represent the clinical OA picture. As a complex disease, there are several reported stimuli of OA pathogenesis including mechanical injury50 and genetics,51 as well as inflammation.12, 13 Additionally, we did not address the mRNA expressions which are known to be regulated by the selected miRNAs, since the expressions of the target mRNAs have been studied previously under similar treatment conditions14-18 and this study primarily focused on the cellular and extracellular miRNA expressions after cytokine stimulation. Lastly, we acknowledge that the knee joint is made up of more tissues than just the articular cartilage, meniscus, and synovial membrane. Other tissues, such as the subchondral bone and ligaments may also potentially release these miRNAs into the synovial fluid. In spite of these limitations, we believe that the present study has provided valuable information concerning the basic science of miRNA expression in orthopedic joint tissues.
In summary, our results demonstrated chondrocytes, meniscus cells, and synoviocytes have distinct extracellular miRNA spectra and patterns of extracellular miRNA ratios under inflammatory conditions. Thus, analysis the ratio of the extracellular miRNAs could be used as a potential method of evaluating genetic changes within specific cells. As miRNAs are exported into the extracellular environment in response to injury or disease conditions, characterization of their expression in the media and synovial fluid could lead to the development of better early detection strategies of OA or cartilage injury.
AUTHOR'S CONTRIBUTIONS
Design of the study was done by AG, CH and LK. The experiments was performed by AG, CH and HE. The results was analyzed by AG, HE, CH and LK. Drafting of the manuscript was done by AG, HE and CH. Manuscript revision was done by CH and LK. All authors approved final version of manuscript for submission.
ACKNOWLEDGMENTS
Funding for this work was provided by philanthropic gift donations to the University of Miami Department of Orthopedics Division of Sports Medicine (LK) and Florida Education Fund McKnight Doctoral Program (AG). We thank Ray Gonzalez at the University of Miami Department of Surgery for providing porcine knees.


