Open-MRI measures of cam intrusion for hips in an anterior impingement position relate to acetabular contact force
ABSTRACT
Open MRI in functional positions has potential to directly and non-invasively assess cam femoroacetabular impingement (FAI). Our objective was to investigate whether open MRI can depict intrusion of the cam deformity into the intra-articular joint space, and whether intrusion is associated with elevated acetabular contact force. Cadaver hips (9 cam; 3 controls) were positioned in an anterior impingement posture and imaged using open MRI with multi-planar reformatting. The β-angle (describing clearance between the femoral neck and acetabulum) was measured around the entire circumference of the femoral neck. We defined a binary “MRI cam-intrusion sign” (positive if β < 0°). We then instrumented each hip with a piezoresistive sensor and conducted six repeated positioning trials, measuring acetabular contact force (F). We defined a binary “contact-force sign” (positive if F > 20N). Cam hips were more likely than controls to have both a positive MRI cam-intrusion sign (p = 0.0182, Fisher's exact test) and positive contact-force sign (p = 0.0083), which represents direct experimental evidence for cam intrusion. There was also a relationship between the MRI cam-intrusion sign and contact-force sign (p = 0.033), representing a link between imaging and mechanics. Our findings indicate that open MRI has significant potential for in vivo investigation of the cam FAI mechanism. © 2015 Orthopaedic Research Society. Published by Wiley Periodicals, Inc. J Orthop Res 34:205–216, 2016.
Cam-type femoroacetabular impingement (FAI) is a proposed pathomechanism for hip osteoarthritis (OA).1, 2 It has been hypothesized that the cam femur, with its reduced head-neck offset, intrudes into the intra-articular joint space most commonly during combined flexion and internal rotation,2-6 resulting in abnormal shear forces thought to directly cause cartilage and labral damage.7-9 However, not all hips with cam deformities will develop OA10, 11 or hip pain,12, 13 indicating that the biomechanics and pathophysiology of cam FAI are not fully understood.6
To establish treatment guidelines, assess the importance of specific activities in FAI, and understand why only some hips with deformities become symptomatic, we require a method to assess impingement directly in vivo. Most biomechanical evidence about cam FAI comes from studies using computer models7, 14-17 or intraoperative observation.1, 18 Both methods have significant limitations. Computer models exclude soft tissue and require assumptions about hip motion, while intraoperative observations are invasive.
Imaging in functional positions offers the potential to directly assess impingement without disrupting or simplifying hip physiology, though few studies have used imaging to report directly on the cam impingement mechanism. Dual fluoroscopy was used to study patterns of joint contact in hips with FAI morphology during the anterior impingement test.3 However, the radiation exposure produced by dual fluoroscopy limits its wide use in vivo and three-dimensional (3D) visualization with this method requires a registration step between the fluoroscopy images and a high-resolution model. Alternatively, open magnetic resonance imaging (MRI) has been used to image femoroacetabular relationships directly in supine hip flexion19 and in a set of functional postures.20However, none of the image-based studies of impingement biomechanics have investigated the link between cam FAI and mechanical force at the site of impingement in postures suspected of causing impingement.21
- Does open MRI show intrusion of the cam deformity into the intra-articular joint space?
- Is the presence of a cam deformity associated with elevated acetabular contact force?
- Are MRI measures of cam intrusion related to acetabular contact force?
METHODS
We obtained 12 cadaver hips from 6 donors (age range: 62–78; 4 male, 2 female; Table 1) and classified them as “cam” or “control” using a 3D imaging protocol. The specimen procurement company (Science Care; Phoenix, AZ) imaged each donor's full pelvis (both left and right hips) using helical CT (Toshiba Aquilion; Tustin, CA) with 1 mm slice thickness and 0.80 mm in-plane voxel size. The raw image volumes were used to create radial reformats with the long axis of the femoral neck as the rotation axis, using a standard multi-planar reformatting (MPR) technique.22-24 The femoral neck axis was determined by segmenting the femur (Mimics 15.0, Materialise; Leuven, Belgium) and fitting a least-squares cylinder (MATLAB, Mathworks; Natick, MA). A rigid transformation plus trilinear interpolation defined the new radially sliced image volume. The reformatted image volume had 18 total slices (1.0 mm isotropic voxels), corresponding to 36 positions circumferentially along the femoral head-neck junction. We evaluated the α-angle25 at all 36 positions, and used the maximum, αmax, to define the presence of a cam deformity. We classified hips as having a cam deformity if αmax >60°,22 rather than αmax >50° or 55°, since cam deformities appear larger when looking at the entire cam profile via MPR.26, 27 In total, there were three hips without cam morphology that were classified as “controls”, and nine hips with cam deformities classified as “cams” (Table 1). All cadaver experiments were approved by UBC Clinical Research Ethics Board certificate number H08-01931.
| Hip | 1 | 2 | 3 | 4 | 5 | 6 | 7 | 8 | 9 | 10 | 11 | 12 |
|---|---|---|---|---|---|---|---|---|---|---|---|---|
| Group | CAM | CAM | CON | CAM | CAM | CAM | CAM | CAM | CON | CON | CAM | CAM |
| αmax (°) | 71 | 84 | 57 | 67 | 84 | 82 | 70 | 79 | 54 | 53 | 99 | 82 |
| CCD angle (°) | 128 | 129 | 150 | 143 | 112 | 114 | 132 | 130 | 133 | 129 | 112 | 115 |
| Lateral centre-edge angle (°) | 30 | 28 | 34 | 30 | 48 | 46 | 41 | 39 | 36 | 37 | 42 | 34 |
| Profunda/protrusio | − | − | − | − | − | − | − | − | − | − | − | − |
| Crossover sign | − | − | − | − | + | + | + | + | − | − | − | − |
| Age (years) | 62 | 72 | 73 | 75 | 64 | 78 | ||||||
| Gender | M | F | M | M | F | M | ||||||
| Height (cm) | 185.4 | 162.6 | 182.9 | 175.3 | 152.4 | 177.8 | ||||||
| Weight (kg) | 93.0 | 40.8 | 75.7 | 125.6 | 46.2 | 127.0 |
A trained reader assessed femoral head congruency, acetabular version (cross-over sign), depth (profunda/protrusio), coverage (lateral centre-edge angle, LCE), and caput-collum-diaphyseal angle (CCD angle) to identify coxa vara/valga, in all hips, using a plain A-P x-ray. Femoral condyles were not available to classify femoral version/torsion. In the “control” hips without cam morphology, one hip had coxa valga (Hip #3), two hips had chondrocalcinosis (Hips #9-10), and one hip had additional anterior femoral neck osteophytes (Hip #10). In the hips with cam morphology, five of nine hips had additional pincer-type acetabular morphology (Hips #5-8, #11) and four had coxa vara (Hips #5-6, #11-12). One cam hip had coxa valga and an incongruent head (Hip #4). Two cam hips had significant anterior neck osteophytes (Hips #5-6).
We used a custom MR-safe positioning rig to achieve an end-range anterior impingement test position. The rig positioned each hip passively in 90° flexion and 0° adduction, then 14 ± 1 Nm of torque was applied in the internal rotation direction with a torque wrench (based on one past study that found changes in pelvic kinematics in cam hips beyond 12 Nm of applied internal rotation torque).28 To establish the precision of the positioning technique, we performed six repeat positioning trials in each of six specimens, for a total of 36 trials. We measured joint position using an optical tracking system (Optotrak Certus, Northern Digital; Waterloo, Canada) and represented it using the floating axis joint angle convention.29, 30 Precision for each joint rotation, reported as the root-mean-square (RMS) standard deviation (SD) over the 36 trials, was 2.0° (1.6–2.7; 95%CI) for flexion, 1.6° (1.3–2.1) for adduction, and 1.3° (1.0–1.7) for internal rotation.31
Each hip was imaged in two positions, (i) supine and (ii) the simulated anterior impingement exam position, with a 0.5T upright open MR scanner (Paramed MROpen; Genoa, Italy) using a T1-weighted 3D gradient echo sequence (Table 2). We minimized echo time (TE) and repetition time (TR) to create a T1-weighted sequence for optimal visualization of bony structures. Since the head-neck junction is bony rather than cartilaginous, a T1-weighted image provided the best contrast to visualize the head-neck margin. A 1-channel send-receive coil was placed around each cadaver hip and positioned at the magnetic isocentre during imaging (50 kHz receiver bandwidth). The coil was chosen because it had the smallest possible radius to fit around each hemi-pelvis with soft tissue intact. After image acquisition, each image was reconstructed into radial reformats via the same MPR technique used with CT, above. The reformatted image volume had 36 total slices (0.9 mm isotropic voxels), corresponding to 72 positions circumferentially along the femoral head-neck junction at which we could evaluate clearance with the acetabular margin.
| Parameter | Value |
|---|---|
| Matrix size | 256 × 256 |
| FOV | 28.5 cm x 28.5 cm |
| n Slices | 102 |
| Slice thickness | 0.90 mm (no gap) |
| TE/TR | 8 ms/19 ms (T1-weighted) |
| n Excitations | 4 |
| Flip angle | 45° |
| Scan time | 27 m 19s |
| Output resolution | 0.9 x 0.9 x 0.9 mm3 |
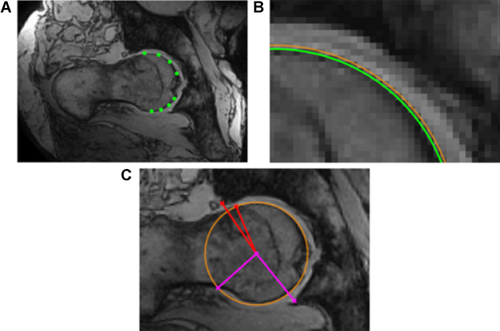
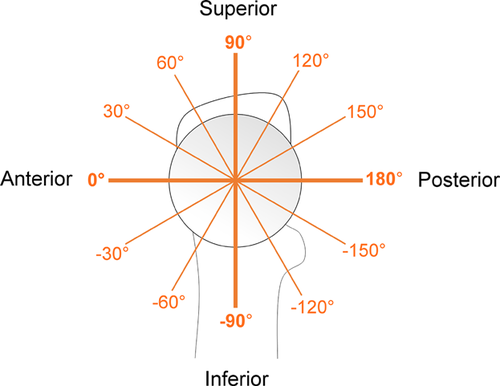
The β-angle19 was used to define the relationship between the head-neck junction and acetabulum at all 72 positions around the head-neck junction. First, a trained reader selected 8 points on the femoral head margin to define a circle. A least-squares circle was automatically fit to the 8 selected points and the mean circle was displayed along with a circle based on the 98%CI of the radius to inform the reader of circle fit error. The reader then selected the point at which the femoral head-neck junction deviated from the mean circle, and also the lateral-most bony margin of the acetabulum. Finally, with the centre of the circle fit known, β was calculated automatically (Fig. 1). Two readers measured β on each slice for all images, and reader agreement was evaluated using the intra-class correlation coefficient. We took the slice-wise average from all readings to yield a location-specific profile for β-about the entire femoral head-neck junction (0° pointing anteriorly, 90° pointing superiorly, Figure 2).
 , given by the equation:

 is the β-angle at slice i showing intrusion (i.e., slices with β > 0° were excluded from this calculation), and
  is the circumferential slice location in degrees.
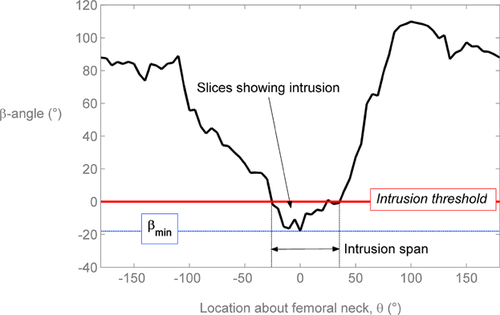
We then defined a positive “MRI cam-intrusion sign” as any posture/hip with β < 0° at two or more locations, based on all individual β-angle readings as well as the average β-angle profile from all four readings. We assessed the presence of pincer abutment qualitatively for each posture/hip.
Following imaging, we dissected each hip by severing the iliofemoral ligament and ligamentum teres, dislocated the femoral head, and attached a 0.10 mm thick arc-shaped piezoresistive force sensor32 (Tekscan K-scan 4400; Boston) to the acetabulum. The sensor was fixed rigidly to the lunate surface along the chondrolabral junction with cyanoacrylate, and the exposed surface was lubricated with petroleum jelly. The size of each acetabulum varied, so we analyzed only the sensing elements covering the superior acetabular region (9:00–3:00 using a clock-face representation).
Before insertion, each sensor was conditioned, equilibrated, and calibrated using a pneumatic pressure bladder that covered the entire sensing area. The calibration mounting board was lined with 1/16” thick 90A durometer hardness polyurethane to simulate cartilage surface compliance.32 Conditioning was executed by loading five times to 2.4 MPa (20% greater than the maximum expected load) with 30 s rest intervals per the manufacturer's recommendations. Equilibration and calibration were conducted at 10 evenly spaced intervals between 0.2 and 2.0 MPa, with increasing load only to avoid hysteresis effects, and with 30 s rest intervals to avoid drift effects. Calibration curves were calculated using a second order least-squares polynomial fit as recommended by the developers of the sensor.32
 , was calculated using the following equation:

 is the force at each sensing element i, and
  is the circumferential location in polar coordinates. Total resultant force, region-specific force distribution, and force centroid were reported as the RMS average SD from all trials for all specimens. A binary measure, the “contact-force sign”, was defined using a threshold value of 20 N for mean resultant force from 6 trials.
At the conclusion of testing, an experienced orthopaedic surgeon dissected each hip in order to assess the status of the labrum and articular cartilage in each hip. Cartilage/labral damage severity was ranked according to the University College Hospital (UCH) cartilage classification scale33 and the location of damage was classified according to a standardized six-region geographic reporting convention for the acetabulum developed by Ilizaliturri et al.34 Labral damage (fraying or tears of any kind) was present in 1/3 control hips, and 7/9 cam hips, while all hips, cams and controls, had macroscopic cartilage damage (Table 3).
| Hip | 1 | 2 | 3 | 4 | 5 | 6 | 7 | 8 | 9 | 10 | 11 | 12 |
|---|---|---|---|---|---|---|---|---|---|---|---|---|
| Group | CAM | CAM | CON | CAM | CAM | CAM | CAM | CAM | CON | CON | CAM | CAM |
| Cartilage | ||||||||||||
| Zone | 2,3 | 3,4 | 3,4 | 2 | 2,3 | 2 | 2 | 3,4 | 2,3 | 3 | 2,3 | 3 |
| Grade | 3 | 4 | 1 | 3 | 3 | 2 | 3 | 4 | 3 | 3 | 3 | 4 |
| Depth | A | A | A | A | A | AB | A | A | A | A | AB | A |
| Zone | 2 | 3,4 | 2 | 2,3,4 | 4 | 3,4 | 3,4 | 3 | 2,3 | 2,3 | 3 | — |
| Grade | 2 | 3 | 3,4 | 2 | 4 | 2 | 4 | 3 | 2 | 2 | 4 | |
| Depth | B | A | AB | AB | A | A | A | AB | AB | AB | A | |
| Zone | 2,3,4 | 3 | ||||||||||
| Grade | — | 2 | 3 | — | — | — | — | — | — | — | — | — |
| Depth | AB | A | ||||||||||
| Labrum | ||||||||||||
| Zone Type | 2 Radial tear | 3 Partial thickness tear | 2,3 Partial thickness tear | 2 Fraying, radial tear | 3 Bucket handle tear | 2 Fraying | 2,3 Fraying | — | — | — | 2 Fraying, partial thickness tear | — |
| Zone Type | — | — | — | — | — | 3,4 Labral loss | — | — | — | — | — | — |
| Secondary changes | — | — | — | — | Anterior neck osteophyte | Anterior neck osteophyte | — | — | Chondro- calcinosis | Chondro-calcinosis | — | — |
- The probability of a positive MRI cam-intrusion sign is the same whether a hip has cam or control morphology;
- The probability of a positive contact-force sign is the same whether a hip has cam or control morphology; and
- The probability of a positive MRI cam-intrusion sign is the same whether the hip has a positive or negative contact-force sign.
To explore the dependency of each result and p-value on the β < 0° threshold for MRI-cam intrusion and 20 N threshold for contact-force, all analysis was repeated using multiple thresholds. For MRI analysis, thresholds were varied between 5° and −5° at 0.1° intervals. For force measurement, thresholds were varied between 1N and 500 N at 1 N intervals, respectively. The statistical hypotheses were re-tested at each threshold.
RESULTS
Qualitative Findings
Cam and control hips had distinctly different patterns of impingement based on both open MRI and sensor measurements. In the three control hips, there was no cam intrusion visible on MRI, no direct pincer abutment visible, and contact force was negligible during sensor testing (Fig. 4). In hips with pure cam morphology, there was clear cam intrusion on MRI and a distinct acetabular contact pattern with force concentrated in the anterosuperior region (Fig. 5).
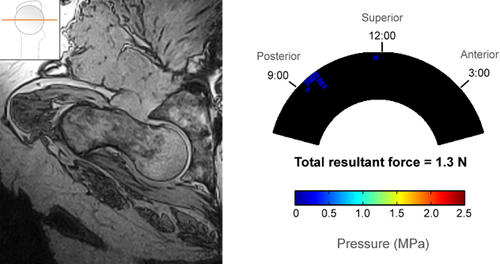
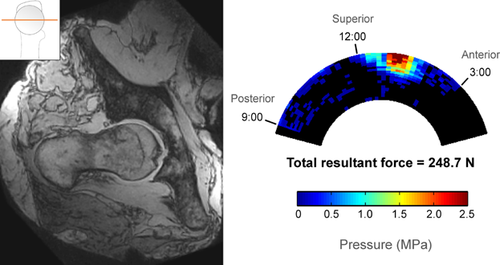
In the cam group, pincer abutment was visible in six hips with open MRI. Hips with pure cam morphology showed cam intrusion but no pincer abutment, whereas all hips with mixed morphology showed simultaneous cam intrusion and pincer abutment. In most mixed-morphology hips, cam intrusion and pincer abutment were both visible on a single slice (Fig. 6). However, in one hip, we observed that the region of maximum cam intrusion (anterosuperior femoral head-neck junction interacting with the acetabulum between 11:00 and 12:00 o'clock) was distinct from the region of pincer abutment (directly anterior femoral head-neck junction interacting with the acetabulum between 12:00 and 1:00 o'clock) and therefore cam and pincer impingement were visible on separate slices (Fig. 7).
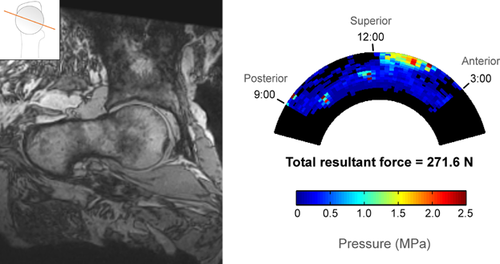
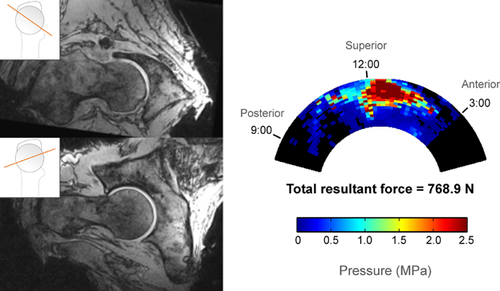
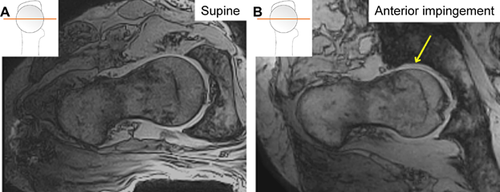
Changes in joint space width, contre-coup femoral head translation, and posterior instability were visible on images of hips in impingement positions compared to supine (Fig. 8).
Quantitative Findings
The minimum β-angle ranged from 1.4° to −28.5° in cam hips versus 4.6° to −0.2° in control hips (Table 4). The intrusion centroid location relative to the femur varied from −3.0° to 35.6°, where 0° points anteriorly (see Fig. 2 for reference). The ICC (2,k) for slice-wise β measurement for two trials each for two readers was 0.93.
| Group | Hip # | βmin (°) | θβmin | Intrusion Span (°) | Intrusion Area (°2) | Intrusion Centroid (°) |
|---|---|---|---|---|---|---|
| Cam | 1 | −14.3 | −5 | 60 | 475 | −3.0 |
| 2 | −6.2 | 25 | 25 | 180 | 14.6 | |
| 4 | 1.4 | −10 | — | — | — | |
| 5 | −14.5 | 35 | 75 | 433 | 22.8 | |
| 6 | −1.8 | 5 | 15 | 27 | 3.8 | |
| 7 | −12.5 | −20 | 80 | 628 | 3.6 | |
| 8 | −5.9 | 15 | 15 | 72 | 2.2 | |
| 11 | −28.5 | 55 | 85 | 1262 | 35.6 | |
| 12 | −6.5 | 30 | 45 | 169 | 21.7 | |
| Control | 3 | 4.6 | −100 | — | — | — |
| 9 | −0.2 | 30 | 5 | 1 | 5 | |
| 10 | 0.1 | −90 | — | — | — |
Two cam hips (Hips #11–12) were excluded from contact-force analysis because they dislocated laterally before any torque could be applied in the internal rotation direction at 90° flexion. The range of mean resultant contact force in the remaining 7 cam hips was 143 to 769 N, at least one order of magnitude greater than in control hips, whose resultant contact force ranged from 1.3 to 14.8 N.
In cam hips, the force centroid was located between 12:00 and 1:00 relative to the acetabular clock-face (mean 69°, 95% confidence interval 55° to 84°, where 60° represents 1:00 and 90° represents 12:00) (Table 5). The 12:00 to 2:00 regions (60° circumferential span) accounted for 66% of the total force, on average, while the other four regions combined (120° circumferential span) accounted for the remaining 34%, indicating a concentration of force in anterosuperior region (Table 6). The RMS average SD in force centroid location from all repeated trials was 7.4° in cam hips, less than 5% of the span of the sensing region.
| Resultant Force (N) | Centroid (°) | ||||
|---|---|---|---|---|---|
| Hip | Group | Mean | SD | Mean | SD |
| 1 | Cam | 248.7 | 154.1 | 62.1 | 12.8 |
| 2 | 381.1 | 57.1 | 92.8 | 5.5 | |
| 4 | 400.5 | 156.9 | 82.3 | 3.0 | |
| 5 | 768.9 | 169.9 | 74.6 | 3.9 | |
| 6 | 143.4 | 43.1 | 55.5 | 7.7 | |
| 7 | 271.6 | 181.1 | 78.4 | 8.5 | |
| 8 | 197.5 | 69.9 | 39.5 | 5.7 | |
| Avg | 344.5 | 131.0 | 69.3 | 7.4 | |
| 3 | Control | 14.8 | 9.3 | 98.3 | 24.2 |
| 9 | 1.3 | 2.1 | 72.5 | 83.6 | |
| 10 | 6.9 | 2.0 | 4.2 | 4.8 | |
| Avg | 7.7 | 3.7 | 58.4 | 50.3 | |
| Region | |||||||
|---|---|---|---|---|---|---|---|
| Hip | Group | 3:00–2:00 | 2:00–1:00 | 1:00–12:00 | 12:00–11:00 | 11:00–10:00 | 10:00–9:00 |
| 1 | Cam | 6.0 (6.6) | 138.9 (108.2) | 87.3 (61.4) | 3.4 (3.8) | 6.3 (6.6) | 6.9 (13.7) |
| 2 | Cam | 30.3 (17.6) | 130.1 (35.1) | 30.9 (13.2) | 32.0 (15.8) | 71.9 (12.2) | 85.8 (19.9) |
| 4 | Cam | 9.5 (14.2) | 55.7 (46.3) | 227.6 (46.2) | 65.4 (24.9) | 17.6 (24.2) | 24.7 (24.5) |
| 5 | Cam | 44.6 (27.5) | 168.3 (61.6) | 365.7 (127.4) | 135.4 (31.4) | 50.0 (9.6) | 4.8 (1.8) |
| 6 | Cam | 23.9 (22.3) | 71.2 (17.7) | 29.3 (6.6) | 13.7 (5.0) | 1.6 (1.0) | 3.7 (1.6) |
| 7 | Cam | 18.0 (15.8) | 91.8 (61.1) | 72.0 (27.6) | 32.7 (32.3) | 16.2 (13.1) | 40.8 (35.7) |
| 8 | Cam | 67.5 (57.2) | 118.3 (41.0) | 2.7 (2.0) | 2.2 (3.1) | 2.8 (3.8) | 4.0 (6.1) |
| Avg | Cam | 28.5 (27.6) | 110.6 (59.3) | 116.5 (57.5) | 40.7 (20.5) | 23.8 (12.3) | 24.4 (18.9) |
| 3 | Control | 3.3 (2.2) | 3.5 (3.6) | 0.5 (0.3) | 2.4 (1.3) | 0.0 (0.1) | 5.1 (2.8) |
| 9 | Control | 0.0 (0.0) | 0.0 (0.0) | 0.0 (0.0) | 0.0 (0.1) | 0.0 (0.0) | 1.3 (2.2) |
| 10 | Control | 6.8 (2.0) | 0.1 (0.1) | 0.0 (0.0) | 0.0 (0.0) | 0.0 (0.0) | 0.0 (0.0) |
| Avg | Control | 3.3 (1.7) | 1.2 (2.0) | 0.2 (0.2) | 0.8 (0.7) | 0.0 (0.0) | 2.1 (2.0) |
- The 3:00 Location Points Anteriorly While 12:00 Points Superiorly.
MRI Cam-Intrusion and Contact-Force Signs
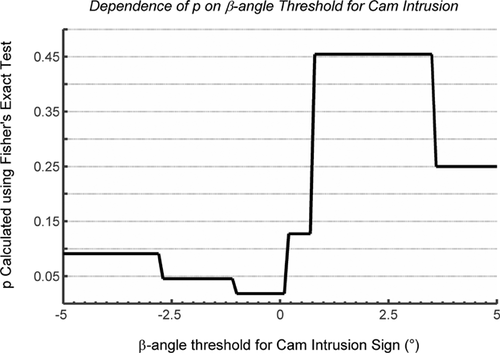
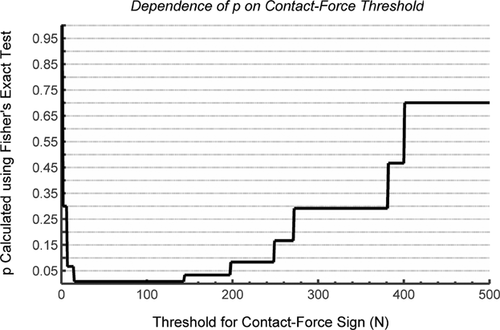
We found a significant association between the presence of cam morphology (from MPR CT) and the MRI cam-intrusion sign (Table 7; p = 0.0182, Fisher's exact test). After re-testing with varying cam-intrusion thresholds, there was significant association between cam morphology and the MRI cam-intrusion sign for all thresholds between −2.7° and 0.2° (p < 0.05; Fig. 9). We also found a significant association between the presence of cam morphology and the acetabular contact-force sign (Table 8; p = 0.0083, Fisher's exact test). After re-testing with varying contact-force thresholds, there was significant association between cam morphology and the contact-force sign for all thresholds between 15 N and 143 N (p < 0.01; Fig. 10). We found a significant association between the MRI cam-intrusion sign and the contact-force sign, given a cam-intrusion threshold of 0° and a contact-force threshold of 20 N (Table 9; Fisher's exact test, p = 0.033).
| MRI | |||
|---|---|---|---|
| Morphology | Cam-intrusion positive | Cam-intrusion negative | Totals |
| Cam | 8 | 1 | 9 |
| Control | 0 | 3 | 3 |
| Totals | 8 | 4 | 12 |
| Sensor | |||
|---|---|---|---|
| Morphology | Contact-force positive | Contact-force negative | Totals |
| Cam | 7 | 0 | 7 |
| Control | 0 | 3 | 3 |
| Totals | 7 | 3 | 10 |
- A Contact Force Threshold of 20 N was Used to Generate this Contingency Table.
| MRI | |||
|---|---|---|---|
| Sensor | Cam-intrusion positive | Cam-intrusion negative | Totals |
| Contact-force positive | 6 | 1 | 7 |
| Contact-force negative | 0 | 3 | 3 |
| Totals | 6 | 4 | 10 |
DISCUSSION
We assessed impingement on open MRI and acetabular cartilage contact force in an anterior impingement posture in 12 cadaver hips in order to assess links between open MRI and biomechanics. We found that (1) cam morphology was significantly associated with MRI-observed cam intrusion; (2) cam morphology was significantly associated with experimentally measured contact force; and (3) experimentally measured contact force was significantly associated with MRI-observed cam intrusion.
Our findings that the femoral head-neck junction intruded medial to the acetabular margin in 8/9 cam hips, and that intrusion was significantly associated with cam morphology, represent some of the first direct experimental evidence for cam intrusion during impingement. Intra-operative observations have qualitatively demonstrated cam intrusion,1, 18 but intra-operative observations cannot necessarily be extrapolated to intact hips. Our results are consistent with findings from a computer simulation study that quantified cam intrusion by positioning 3D CT-derived models in impingement positions using patient-specific range of motion data that had been measured separately using magnetic tracking.17 In the simulation study, 10/13 cam hips experienced cam intrusion during maximal internal rotation at 90° flexion,17 which is consistent with our finding of cam intrusion in 8/9 of the hips we studied.
The MRI cam intrusion centroid location ranged from −3.0° to 35.6° (where 0° points toward the anterior femoral head-neck junction, 90° superior; see Fig. 2 for reference), consistent with previous computer simulations and 3D imaging studies3, 15, 17, 35 which demonstrated that the anterior and anterosuperior regions of cam deformities are likely to induce impingement, and that cam deformity collision zones are specimen-specific. Furthermore, our finding that the acetabular contact force centroid was located near 1:00 (clock-face localization) is consistent with five studies that reported that either intraoperative cartilage damage 2, 36, computer-simulated impingement zones,14, 15 or both7 were localized (mode) at 1:00 on the acetabulum in cam hips.
It is not surprising that the two hips that were excluded from analysis (due to unavoidable dislocation) had large cam deformities and additional pincer related deformities. Both hips had a large α-angle (99°, 82°) and coxa vara, and one had a lateral centre-edge angle greater than 39° which is indicative of acetabular overcoverage. The open MR images showed dramatic cam intrusion in both hips (Fig. 11). It is possible that in these two hips, large cam and pincer deformities caused pronounced levering during impingement, requiring the joint capsule, ligaments, and/or labral seal to provide stability and prevent translation of the femoral head. After the dissection to insert the sensor,compromised ligaments and labral seal combined with impingement may have led to dislocation in these two hips.

A strength of this study was that we standardized the joint positioning technique, using a method with documented precision (RMS average SD for flexion, adduction, and internal rotation of less than 2° for repeated trials). Relative joint position and hip anatomy determine clearance between the acetabulum and femoral head-neck junction, so high precision in joint positioning is essential when studying hips in functional positions, although positioning precision is rarely reported. A second strength of this study was that the significance of the relationship between the MRI cam-intrusion sign and presence of a cam deformity was not affected by selection of the β-angle threshold for intrusion (for β-angle between 0.2° and −2.7°). A range of possible β-angle thresholds will still be sensitive at detecting presence/absence of intrusion.
One limitation was that the sensor-based contact force measurements were highly variable (131 N RMS average SD, or 42.6% RMS average coefficient of variation in cam hips). This is consistent with variability findings from past studies that reported coefficients of variation between 3.1 and 23.5% in the patellofemoral joint.37, 38 Considering that the curvature of the hip joint is extreme in comparison with previously studied joints and sensor performance is affected by curvature, the CV of 42.6% in cam hips is not surprising. Large variations in force magnitude between repeated measures may be due to shear forces, which might have resulted from cementing the sensor in place,37 or from the shearing nature of cam impingement itself. However, our finding that the standard deviation in contact-force centroid measurement was less than 5% of the span of the sensor region indicates that shear did not substantially affect measurement of contact force location.
Importantly, high variability between repeated force measurement trials did not affect the binary contact-force sign analysis and the final conclusion that cam hips experienced elevated contact force, while control hips experienced negligible force. Furthermore, it was qualitatively clear that cam hips experienced intra-articular contact force while control hips did not. A binary sign proved to be a robust method for representing the presence or absence of contact force, as supported by our finding that the contact-force sign was independent of the selected contact-force sign threshold between 15 N and 143 N, almost a full order of magnitude.
Elevated contact force in cam hips suggests that contact between the cam deformity and lunate surface contribute to resisting the forced internal rotation in the anterior impingement exam (in hips with dissected anterior hip joint capsule, severed ligamentum teres, disrupted labral seal, and no muscular activity). It is not clear which tissue structures resisted contact force in control hips. Tissues that may have been resisting the internal rotation torque in control hips include the posterior joint capsule/ligaments and extra-articular impingement of the femur against the labrum or rim of the acetabulum. We are limited in drawing further conclusions because this experiment only controlled applied torque, and not ‘end-feel’ like a clinician would in the anterior impingement test.
The open MRI method we have presented here has significant potential to investigate cam intrusion in vivo. Open MRI in vivo permits the visualization of cam FAI in intact hips during functional weight-bearing postures (requiring active muscular forces)—without the need to simulate or simplify hip physiology—which has significant advantages compared to computer simulations, image-based model tracking, intraoperative observation, and ex vivo studies. While the 27 min 19 sec imaging time used in this study is not practical for use in vivo, one in vivo pilot study has used 133 sec scans (fewer planes, reduced resolution) to successfully measure β-angle in hips to evaluate how various postures affect clearance between the femoral neck and acetabular margin.39 Further potential applications of this method include studying the effect of deformity size and posture on cam intrusion during anterior impingement, and investigating differences in cam intrusion between symptomatic and asymptomatic FAI populations.
CONCLUSION
We found a relationship between an MRI-based measure of cam intrusion during hip impingement and sensor-based measurement of acetabular contact force, indicating that cam intrusion on open MRI represents mechanical impingement. Our work supports the use of direct hip imaging postures suspected of producing impingement for in vivo studies of FAI. Open MRI can provide direct image-based assessment of FAI mechanics, and has advantages over previous approaches that rely on assumptions or simplification of hip joint biomechanics.
AUTHORS' CONTRIBUTIONS
Lawrence Buchan was responsible for the research study design, acquisition, analysis, and interpretation of data, and preparation of the manuscript. Dr Honglin Zhang contributed to the study concept, research design, analysis and interpretation of data, and manuscript revisions. Dr Sujith Konan contributed significantly to the analysis and interpretation of data. Dr Ingrid Heaslip contributed to the experimental design and interpretation of preliminary results. Dr Charles Ratzlaff contributed to the study concept, interpretation of data, and manuscript revision. Dr David Wilson was responsible for the study concept, and contributed to experimental design, interpretation of results, and drafting and revision of the manuscript. All authors have read and approved the final submitted manuscript.
ACKNOWLEDGMENTS
We thank the contributions of Mike Brenneman, Andrew Yung, and the Centre for Hip Health and Mobility. Funding was provided by the Canadian Institutes for Health Research, Canadian Arthritis Network, and the Natural Sciences and Engineering Research Council of Canada.


