Merkel cell polyomavirus pan-T antigen knockdown reduces cancer cell stemness and promotes neural differentiation independent of RB1
Abstract
Merkel cell carcinoma (MCC) is a highly aggressive skin cancer associated with integration of Merkel cell polyomavirus (MCPyV). MCPyV-encoded T-antigens (TAs) are pivotal for sustaining MCC's oncogenic phenotype, i.e., repression of TAs results in reactivation of the RB pathway and subsequent cell cycle arrest. However, the MCC cell line LoKe, characterized by a homozygous loss of the RB1 gene, exhibits uninterrupted cell cycle progression after shRNA-mediated TA repression. This unique feature allows an in-depth analysis of the effects of TAs beyond inhibition of the RB pathway, revealing the decrease in expression of stem cell-related genes upon panTA-knockdown. Analysis of gene regulatory networks identified members of the E2F family (E2F1, E2F8, TFDP1) as key transcriptional regulators that maintain stem cell properties in TA-expressing MCC cells. Furthermore, minichromosome maintenance (MCM) genes, which encodes DNA-binding licensing proteins essential for stem cell maintenance, were suppressed upon panTA-knockdown. The decline in stemness occurred simultaneously with neural differentiation, marked by the increased expression of neurogenesis-related genes such as neurexins, BTG2, and MYT1L. This upregulation can be attributed to heightened activity of PBX1 and BPTF, crucial regulators of neurogenesis pathways. The observations in LoKe were confirmed in an additional MCPyV-positive MCC cell line in which RB1 was silenced before panTA-knockdown. Moreover, spatially resolved transcriptomics demonstrated reduced TA expression in situ in a part of a MCC tumor characterized by neural differentiation. In summary, TAs are critical for maintaining stemness of MCC cells and suppressing neural differentiation, irrespective of their impact on the RB-signaling pathway.
Abbreviations
-
- DGE
-
- Differential gene expression
-
- LTA
-
- large T antigen
-
- panTA-knockdown
-
- pan-T antigen knockdown
-
- scRNA-seq
-
- single-cell RNA sequencing
-
- shRNA
-
- short-hairpin RNA
-
- STA
-
- small T antigen
-
- TA
-
- T antigen
-
- UMI
-
- unique molecular identifier
1 INTRODUCTION
Merkel cell polyomavirus (MCPyV; taxonomically classified in family Polyomaviridae, genus Alphapolyomavirus, species Human polyomavirus 5) is to date the only polyomavirus known to have a clear association with carcinogenesis in humans, i.e., Merkel cell carcinoma (MCC), an aggressive form of skin cancer. While nonviral factors such as exposure to ultraviolet light contribute to MCC carcinogenesis in a subset of tumors, approximately 80% of MCC tumors in the Northern Hemisphere are found to have MCPyV genome integrated into the MCC cell genome.1 Polyomaviruses are a family of non-enveloped double-stranded DNA viruses. Within the early region of their genetic makeup, these viruses encode proteins known as transforming antigens (T-antigens or TAs). T-antigens play a crucial role in promoting the proliferation of infected cells and have the potential to induce cellular transformation.2 The MCPyV genome encodes four early region proteins, i.e. small and large TA (STA and LTA), 57kT and middle T antigen, termed ALTO (Alternative to Large T Open reading frame).3 MCC cells, however, express in general only STA and a truncated form of LTA, the latter lacking the C-terminal half of the protein due to stop codon mutations or incomplete integration.4
LTA is a multifunctional protein. The N-terminal region encompasses a DnaJ domain, which binds to the chaperone protein Hsc70, and an amino acid motif LXCXE. The LXCXE motif facilitates the binding of LTA to the tumor suppressor retinoblastoma family proteins (RB), thereby disrupting the interaction between RB and E2F proteins which propels cell cycle progression.5 Notably, it is well established that the binding of LTA to RB is essential for sustaining MCPyV-associated MCC cell proliferation.6 In virus-negative MCC, downregulation of the RB1 gene expression or even deletion of the RB1 locus is frequently observed, suggesting that the loss of RB pathway signaling is generally required for MCC tumorigenesis.7
In spite of phenotypic similarities, e.g. expression of neuroendocrine markers like chromogranin A and synaptophysin, numerous studies have shown that MCC cells do not originate from Merkel cells, but rather from distinct, non-neuroendocrine cells; candidates for the cell-of-origin include epidermal stem cells, fibroblasts, and B cells.8 One reason for the neuroendocrine properties could be that LTA induces the expression of atonal homolog 1 (ATOH1), which belongs to the basic helix-loop-helix (BHLH) family of transcription factors. ATOH1 is involved in the development of various cell types, including cerebellar granule neurons, inner ear hair cells, and Merkel cells, suggesting ATOH1 may cause the neuroendocrine transdifferentiation observed in MCC.9
Our previous studies have shown that MCC cells upon a panTA-knockdown (i.e. simultaneous LTA and STA knockdown) exhibit a reduction of neuroendocrine and stem cell-like properties caused by downregulation of SOX2, which promoted differentiation into neuron-like cells.10 However, the loss of RB function is also associated with the activation of pluripotency networks leading to neuroendocrine transdifferentiation,11 which can be associated with an increase in stem cell-like properties.12 Thus, it is not clear from these previous studies whether the observed phenotypic changes after panTA-knockdown are directly caused by a reduced presence of TAs or by restored RB function. In this respect, the LoKe cell line offers a unique opportunity to separate these two aspects since this MCPyV-positive MCC cell line does not express RB1 due to a homozygous deletion of the chromosomal segment 13q14.2 causing deletion of RB1 and 10 other genes.6 In contrast to other MCPyV-positive MCC cell lines such as CVG-1,10 WaGa,13 BroLi,6 MKL-1,14 MKL-215 in which panTA-knockdown leads to reduced proliferation due to the reactivation of the RB1-E2F interaction, LoKe exhibits TA-independent proliferation.16 Hence, in our current study, we employed LoKe cells to investigate on a single cell level the transcriptomic alterations resulting from a panTA-knockdown, irrespective of reactivation of RB signaling.
2 MATERIALS AND METHODS
Cell lines, cell culture conditions, inducible short hairpin (sh) RNA panTA-knockdown, constitutive shRNA RB1-knockdown, single cell RNA sequencing (scRNAseq), whole proteome analysis and spatially resolved transcriptomics (ST) have been described in detail before and thus are outlined in the supplementary methods section.6, 13, 16-18
2.1 Dimensionality reduction, clustering and trajectory analysis
Bioinformatics analysis was performed on JupyterHub server hosted in Omics IT and Data Management Core Facility (ODCF), DKFZ, using R version 4.2.2. Single cell libraries were sequenced at the DKFT's NGS Core Facility (Heidelberg) and the reads were aligned to customized reference with 10x Cell Ranger v7.1.0. The customized genome consisted of human telomere-to-telomere (T2T) genome CHM13 v2.0 fetched from NCBI for nuclear chromosomes, reference sequence NC_012920.1 for mitochondrial genome, and reference sequence NC_010277.2 for the MCPyV genome. Filtered count matrices from Cell Ranger output were imported with Seurat version 4.3.19 Quality filtering was done to remove cells with low gene counts and high mitochondrial gene counts. Specifically, cells with less than 600 UMIs, less than 200 expressed genes and more than 30% mitochondrial gene UMI counts were discarded. Clustering was performed with default parameters unless stated otherwise. Gene expressions were first log-normalized, then cell cycle scores were calculated, followed by count normalization with SCTransform, variations from cell cycle scores and mitochondrial gene percentage were regressed out during scaling. After principal component analysis (PCA), the first 10 principal components were used based on visual inspection of the elbow plot of principal components to perform Uniform Manifold Approximation and Projection (UMAP) dimensionality reduction and shared nearest neighbor clustering with default parameters. Trajectory analysis was performed using Monocle 3 v1.3.1. Raw UMI counts from filtered Seurat object were used with default preprocessing. LTA panel genes (Supporting Information S2: Table S1) were used as variable features to perform PCA, and the top 20 PCs were included for subsequent clustering and graph learning.
2.2 Differential expression analysis and enrichment analysis
Differential expression analysis was performed using Wilcoxon rank-sum test from FindMarkers in Seurat, using default log fold change threshold of 0.25 and minimum expressed cell percentage of 0.1 unless stated otherwise. Gene set enrichment analysis (GSEA) and pathway analysis were performed at both group and single cell levels. For the group level, differentially expressed genes for each comparison were obtained using FindMarkers and GSEA on gene ontology (GO) was performed with fgsea v1.24.0, using C5 GO biological process gene set from Molecular Signature Database.20 Pathway analysis was performed in a similar manner using C2 KEGG gene set. Maximum and minimum gene set sizes were set 10 and 800 respectively. For gene set activity quantification at single cell level, the scores of gene sets per cell was calculated with AUCell v1.20.2,21 SCT counts were used for rank computation. AUCell scores were scaled across groups by gene set and visualized with pheatmap v1.0.12.
2.3 Gene regulatory network analysis
Gene regulatory network analysis was performed using SCENIC v1.3.1.21 Adjacency matrices were computed using Python script arboreto_with_multiprocessing.py as specified in SCENIC protocol. Preliminary filtering on UMI counts was performed, genes which were expressed in at least 1% of the cells, a minimum average of 3 UMIs per cell and found in SCENIC database were included for adjacency matrix computation. Once the adjacency matrix was obtained, standard SCENIC pipeline was run on SCTransform-corrected counts with default databases and parameter settings to generate transcription factor-target regulons. The activity of each gene set per cell was then quantified as AUCell scores as described in previous section, and differentially active regulons were identified with Wilcoxon test in which log fold-change threshold = 0.01. To correlate the regulons with differentially enriched pathways, the overlap between core enrichment genes (CEG) in differentially enriched GO terms and KEGG pathways and the target genes in regulons was quantified using overlap coefficient (Szymkiewicz–Simpson coefficient), defined as for each CEG-regulon pair.22
2.4 Gene panel scoring of stemness signatures and cancer transcriptional metaprograms
Stem cell characteristics quantification was done using AUCell scoring with a compilation of stemness signatures from Barata et al.23 Briefly, 21 gene signatures assessing pluripotent, multipotent, or mixed potencies of stem cells were obtained from Supporting Information S2: Table S2. Only genes with overall score higher than 3 were included, i.e., genes found in more than 3 gene signatures. Gene signature scores per cell were calculated using AUCell as described in previous section. Difference in gene signature score distribution between LTAhigh and LTAlow cells was tested with Wilcoxon test, with log2 fold-change threshold as 0.03 and adjusted p < 0.05 as significant. To quantify cancer-related metabolic and signaling activities, the gene sets compiled by Gavish et al. summarizing transcriptional intratumoral heterogeneity were used.24 The overlap between metaprogram gene sets and regulons was calculated with overlap coefficient. Cell clustering was performed using scaled AUCell scores with Seurat. Differentially enriched metaprograms per cluster were identified and cell clusters were named by the most enriched metaprogram.
3 RESULTS
3.1 PanTA-knockdown results in reduced LTA function
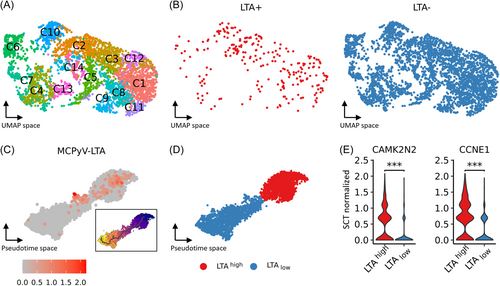
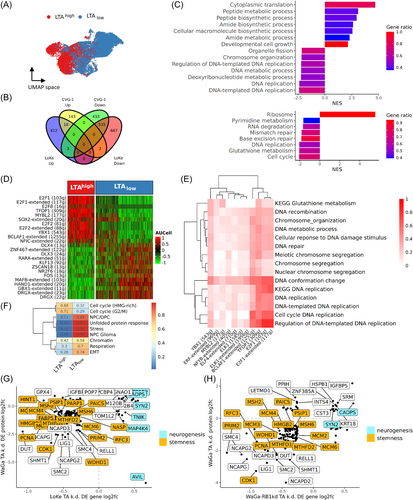
Due to the homozygous loss of RB1, LoKe cells are suitable to study the transcriptomic changes resulting from panTA knockdown, independent of RB1-mediated cell cycle arrest. Even in experiments with a single cell line, knockdown efficiency and kinetics can vary significantly. While this poses challenges for bulk RNA sequencing, it can be advantageous for single-cell RNA sequencing by enabling the detection of gene dose effects. We also selected different time points post-knockdown induction to capture dynamic changes. Silencing of TA expression in LoKe cells using an inducible panTA-shRNA system was performed 48 and 72 h before 3000 cells from each time point together with 3000 non-induced cells were subjected to scRNAseq. A total of 3710 cells were recovered after quality filtering, yielding 14 clusters from unsupervised shared nearest neighborhood (SNN) clustering visualized in UMAP space (Figure 1A). To check for TA-knockdown efficacy we evaluated LTA expression, however, as previously reported,10, 25 LTA has a high dropout rate in scRNAseq using the 10X Genomics platform: among all cells, only 245 demonstrated LTA UMI counts (Figure 1B). Thus, we devised a method to infer LTA expression based on differential gene expression (DGE) between LoKe cells with and without LTA expression: cells with at least one LTA UMI were classified as LTA+ cells and cells with zero LTA expression as LTA- cells. Differentially expressed genes between LTA+ and LTA- cells with mean log fold change > 0.3, and p value < 0.05 instead of adjusted p values were considered. Beside LTA, 52 genes were identified to be upregulated in LTA+ cells using Wilcoxon rank-sum test (Supporting Information S2: Table S1), among which—although changes in growth rate cannot be observed upon panTA-knockdown in LoKe6—there were cell cycle-related genes CDCA7, CCNE1, and proliferation-related genes BRCA1, CAMK2N1 and CAMK2N2 (Supporting Information S1: Figure S1A). Next, these 53 differentially expressed genes were used to define an LTA+ gene panel to score all cells with R package AUCell. Clusters C2 and C10 had the highest LTA+ panel scores, while C4 had the lowest (Supporting Information S1: Figure S1B). Pseudotime inference also demonstrated a linear trajectory with C2 and C10 at one end and C4 at the other (Supporting Information S1: Figure S1C). Importantly, LTA+ cells were more abundant in the cell cluster at the beginning of the trajectory and less prevalent towards the end (Figure 1C). Based on these findings, we assigned LTA+ cell-enriched group as LTAhigh and the other as LTAlow (Figure 1D). To validate this classification, we examined the expression of TA-regulated genes such as CAMK2N2 and CCNE1, which both showed a decline in expressions from LTAhigh to LTAlow cells (Figure 1E). With respect to expression of RB family genes, as expected RB1 mRNA was virtually absent, while RBL1 and RBL2 were consistently expressed and their expression levels were not perturbated by the panTA-knockdown (Supporting Information S1: Figure S1D).
3.2 Loss of stemness after panTA-knockdown
DGE analyses comparing LTAhigh and LTAlow cells revealed 1638 differentially expressed genes, of which 1205 were reduced in LTAlow cells, whereas expression of 433 genes was increased (Supporting Information S2: Table S2). Upon inspecting the top differentially expressed genes, a substantial portion of the downregulated genes were found to be associated with DNA repair and replication as well as chromatin structure maintenance, such as CENPX, MCM3, HMGB2 and PCNA and histone-coding genes such as H3C2 and H4C3 (Figure 2A). Pathway analysis for the differentially expressed genes revealed that oxidative phosphorylation was upregulated after panTA-knockdown, which was coupled with downregulated glycolysis (Figure 2B, Supporting Information S1: Figure S2A). It should be noted in this regard that the use of anaerobic glycolysis instead of oxidative phosphorylation even in the presence of oxygen is a characteristic of many cancer cells.26 Accordingly, TPI1—encoding triose phosphate isomerase 1—and ENO2—encoding enolase 2—were the downregulated core enrichment genes, which should be associated with slowing down triose supply from hexose (Supporting Information S1: Figure S2B). PCK2 coding for the mitochondrial form of phosphoenolpyruvate carboxykinase, is also downregulated in LTAlow cells, which should additionally hinder the generation of triose from oxaloacetate through gluconeogenesis. Moreover, the lactate dehydrogenase genes LDHA were less expressed in LTAlow cells, implying reduced efficiency in converting pyruvate to lactate. We therefore assume that panTA-knockdown leads to a shift in energy metabolism, from aerobic glycolysis to oxidative phosphorylation. Indeed, the reduced expression of genes whose products are involved in glycolysis and pyruvate formation is accompanied by increased expression of genes contributing to oxidative phosphorylation and of mitochondrial genes involved in the electron transport chain, such as those encoding cytochrome B and the ATP synthase subunits (Supporting Information S1: Figure S2B).
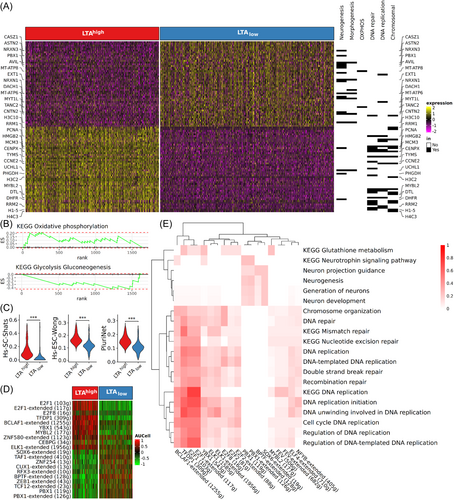
This switch in energy metabolism suggests a decrease in stem cell properties of LoKe cells upon panTA-knockdown, since glycolysis as primary energy source is considered as a typical stem cell feature.27 Thus, we tested the change in stemness at a transcriptomic levels using a collection of 20 gene signatures reported by Barata et al.23 Ten of the stemness signatures had significant score differences between LTAhigh and LTAlow cells, with all of them being reduced in the LTAlow cells (Figure 2C, Supporting Information S1: Figure S2C, Supporting Information S2: Table S5). We analyzed 128 genes from top 5 most downregulated pluripotent/multipotent stemness signatures in LTAlow cells. 56 of these stemness genes were among the genes differentially expressed between LTAhigh and LTAlow cells. (Supporting Information S1: Figure S2D, Supporting Information S2: Table S6). Interestingly, the GSEA findings, which notably featured the significant downregulation of MCM genes like MCM2, MCM3, proliferating cell nuclear antigen (PCNA), cell division cycle associated 7 (CDCA7), and MYB-like protein 2 (MYBL2), exhibited parallel alterations in signaling pathways compared to the analyses using the complete set of differentially expressed genes (Supporting Information S1: Figure S2E). In both analyses, heightened cell division and chromosome segregation activities were observed alongside decreased DNA replication. This implies that the transcriptomic shifts triggered by panTA-knockdown in LoKe cells can largely be attributed to the decreased expression of stemness-related genes.
3.3 Downregulation of E2F and TFDP1 correlates with diminished stemness
Gene regulatory network (GRN) analysis by SCENIC was used to determine the transcriptional programs modulated by panTA-knockdown causing the observed for the transcriptomic changes. Thereby, we identified 216 regulons that are controlled by 166 unique transcription factors. Using AUCell scores to gauge the activity of individual regulons per cell and comparing LTAhigh and LTAlow cells, we pinpointed 77 regulons that exhibited differential activation or repression. (Supporting Information S2: Tables S7 and S8). Among the top downregulated regulons were those involved in G1/S transition such as members of the E2F family (E2F1, E2F2, E2F8), TFDP1 and YBX1 (Figure 2D). In line with this, the mRNA expression of these transcription factors was reduced after panTA-knockdown (Supporting Information S2: Table S2). To establish the biological significance of the regulons in connection with the differentially influenced biological processes/pathways identified through GSEA and KEGG results, we gauged the similarity between the target genes within each regulon and the core enrichment genes associated with each biological process/KEGG pathway. This was done by employing the overlap coefficient, determining whether one gene set was a subset of the other (Supporting Information S2: Table S9). As expected, genes regulated by G1/S transition arrester shared cellular functions like DNA repair, unwinding and replication initiation (Figure 2E). Upon analyzing the overlap between regulons and KEGG core enrichment genes, a significant finding emerged: a considerable portion of the core genes associated with glutathione metabolism genes were regulated by TFDP1, a heterodimerization partner of the E2F proteins. Given the critical role of elevated glutathione levels in preserving stem cell function, we postulate that the decreased expression of TFDP1 following TA silencing leads to a reduction in the expression of genes encoding enzymes in the glutathione pathway. Consequently, this diminishes glutathione turnover, potentially resulting in the loss of stem cell properties.
It is important to note, that we also identified a cluster of regulons that are related to neurogenesis processes. These regulons were regulated by PBX1, BPTF and SOX6 and all except SOX6 were among the significantly upregulated genes in LTAlow cells (SOX6 log2FC = 0.308, p = 0.52; Supporting Information S2: Table S3).
3.4 The loss of stemness after panTA-knockdown is accompanied by neuronal differentiation
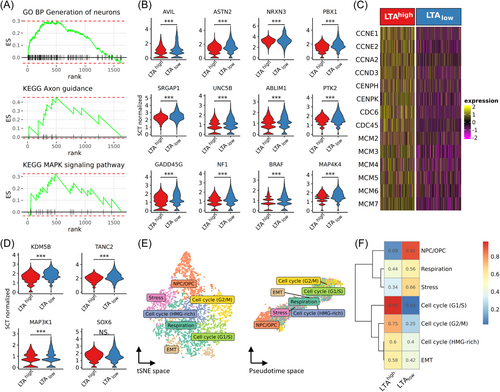
In addition to the neurogenesis-related genes among the top upregulated genes between LTAhigh and LTAlow cells (Figure 2A), GSEA and KEGG pathway analysis of the 1638 differentially expressed genes confirmed an enhanced neural differentiation after panTA-knockdown, enriched terms/pathways included generation of neurons and axon guidance (Figure 3A; Supporting Information S1: Figure S2A; Supporting Information S2: Table S4). Leading-edge genes in the enhanced neurogenesis pathways included actin-binding protein advillin (AVIL), astrotactin 2 (ASTN2), myelin transcription factor 1 like (MYT1L), presynaptic membrane proteins neurexin-1-alpha (NRXN1) and neurexin-3-alpha (NRXN3), SLIT-ROBO Rho GTPase activating protein 1 (SRGAP1), acting binding LIM protein 1 (ABLIM1) and protein tyrosine kinase 2 (PTK2) (Figure 3B). The enhanced neural differentiation was further supported by increased activity in the proliferation-related MAPK signaling pathway in LTAlow cells. Examining the leading-edge genes in this pathway, an increased expression of Raf gene BRAF, MEK gene MAP2K5, MEKK genes MAP3K1, MAP3K14, MAPKKK kinase gene MAP4K4, as well as GADD45G and neurofibromin 1 (NF1) was evident. Enhanced neural differentiation was accompanied by reduced expression of genes associated with cell cycle progression, DNA replication and chromosome organization. Further inspection on the leading-edge genes of these pathways revealed a downregulation of cyclins such as cyclin E1 & E2 (CCNE1, CCNE2), cyclin A2 (CCNA2), cyclin D (CCND3), genes encoding centromere proteins such as CENPH and CENPK, genes for cell division proteins such as CDC6 and CDC45, as well as genes coding for minichromosome maintenance proteins such as MCM2-7 (Figure 3C). Indeed, downregulated cell cycle activities are expected for neural differentiation.28 Notably, the reduced expressions of MCM proteins would result in insufficient origin licensing, which would disrupt the integrity of chromosome in rapidly proliferating cells and thus reduce the proliferative capacity.29
3.5 Activation of tumor meta program 29 by panTA-knockdown
We next investigated the impact of panTA-knockdown on the activity of the tumor meta programs (MP) recently proposed by Gavish et al.24 Of the 5 MPs associated with neural phenotypes, MP29 neural progenitor cells/oligodendrocyte progenitor cells (NPC/OPC) showed markedly increased activity in LTAlow cells (Supporting Information S1: Figure S3). Among the upregulated MP29 genes were lysine demethylase 5B (KDM5B), synaptic scaffold protein TANC2, MAPK signaling kinase MAP3K1, and SOX6, which was among the transcription factors regulating neurogenesis pathways from GRN analysis (Figure 3D). The regulon activity controlled by SOX6 is consistent with the observed gene expressions after panTA-knockdown (Figure 2D, Supporting Information S2: Table S3). Next, we clustered the cells based on MP scores and labelled each cluster by the most significantly activated MP, i.e., cell cycle-, stress-, respiration-, EMT-, and neurogenesis-related MPs (Figure 3E). Examining the proportions of cells exhibiting different MPs, 91% of NPC/OPC-activated cells were LTAlow cells, whereas 97% of G1/S-activated cells were LTAhigh cells (Figure 3F). These observations reaffirmed our previous observations on panTA-knockdown repressing DNA replication and mitotic cell cycle while inducing neurogenesis.10
3.6 PanTA-knockdown in WaGa-RB1k.d. cells induces neurogenesis-associated genes
To validate our previous findings regarding the TA-dependent stemness of MCC cells from the LoKe panTA-knockdown experiment, we conducted a two-step experiment involving a constitutive knockdown of RB1 (RB1k.d.) followed by the conditional Dox-induced panTA-knockdown using the MCPyV-positive MCC cell line WaGa. Our rationale was that the constitutive RB1-knockdown in WaGa cells would mimic the RB1 deletion in LoKe cells. Consequently, consistent alterations observed between LoKe and WaGa-RB1k.d. cells following panTA-knockdown can be considered TA-dependent.
2564 WaGa-RB1k.d. cells were recovered from single cell RNA sequencing, of which 607 cells were uninduced control and 1957 cells had a Dox-induced panTA-knockdown. As for the LoKe cells, we conducted LTA inference to identify LTAhigh and LTAlow WaGa-RB1k.d. cells (Supporting Information S1: Figure S4A,B). To avoid misclassification, we restricted further analyses to LTAhigh cells derived from the control group (n = 393) and LTAlow cells derived from the panTA knockdown group (n = 1132) (Figure 4A). DGE analysis yield 1428 downregulated genes and 217 upregulated genes upon panTA-knockdown in WaGa-RB1k.d. cells (Supporting Information S2: Table S10). As already observed in the LoKe cells, most of the downregulated genes were involved in DNA replication and chromosome structures, although genes associated with neural differentiation were not as strongly upregulated (Figure 4B). Gene set enrichment analysis of the differentially expressed genes demonstrated enhanced oxidative phosphorylation and reduced DNA replication-related pathways after panTA-knockdown, coherent to what had been observed in LoKe after panTA-knockdown (Figure 4C, Supporting Information S1: Figure S4C; Supporting Information S2: Table S11). Among the top differentially expressed genes, Purkinje cell protein 4 PCP4, PTPRF interacting protein alpha 2 PPFIA2 and transcription factors HES6 and SOX4 were related to neurogenesis. Interestingly, for one of the downregulated neurogenesis-related genes, i.e., ASPM that encodes an assembly factor for spindle microtubules, it was demonstrated that its genetic deletion promotes cerebellar granule neuron progenitors in mice.30
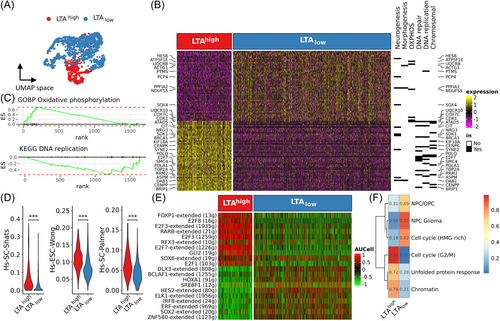
Stemness panel scoring revealed 4 stemness signatures with significant differences between LTAhigh and LTAlow cells, the top 3 of these signatures showed reduced stemness after panTA-knockdown, with Hs-SC-Shats and HS-ESC-Wong being the most repressed stemness signatures in WaGa-RB1k.d. cells, as previously observed in LoKe cells after panTA-knockdown. (Figure 4D). E2F genes had reduced expression in panTA-knockdown cells (E2F1 log2FC = −0.634; E2F2 −0.468; E2F7 −1.146; E2F8 −0.289) along with stemness-related transcription factors such as MYBL2 (log2FC = −0.731). Assessing the activity of the transcriptional regulons inferred from LoKe panTA-knockdown (Supporting Infomation S2: Table S8) on WaGa-RB1k.d. cells, the findings were consistent: E2F regulons such as E2F1, E2F3, E2F7 and E2F8 were among the top regulons exhibiting decreased activities following panTA-knockdown (Figure 4E, Supporting Information S2: Table S12). Finally, we evaluated tumor meta program activities and performed clustering with meta program scores (Supporting Information S1: Figure S4D). The results were similar to those from LoKe panTA-knockdown experiments: G2/M cell cycle activity was reduced in LTAlow cells, implying reduced mitosis, which was in line with the increased activity of two neuroendocrine meta programs, NPC/OPC and NPC Glioma (Figure 4F).
3.7 Effects of panTA knockdown in RB1-deficient versus RB1-expressing MCC cell lines
To examine the extent to which the observed effects of panTA-knockdown in RB-loss MCC cells are also found in MCC cells with functional RB1, we compared the data described above with previously published data on the effects of panTA-knockdown in the MCPyV-positive MCC cell line CVG-1.10 To ensure consistency, we utilized LTA inference as employed with the LoKe and WaGa-RB1k.d. data instead of relying solely on the reported treatment conditions to categorize CVG-1 cells into LTAhigh and LTAlow groups (Figure 5A). Notably, while the resulting groups closely aligned with the specified treatment conditions, after panTA-knockdown some cells still expressed LTA mRNA (Supporting Information S1: Figure S5A–G). DGE analysis between LTAhigh and LTAlow CVG-1 cells revealed 971 downregulated and 164 upregulated genes (Supporting Information S2: Table S13). Among these differentially expressed genes, 535 downregulated genes were also found to be downregulated in LoKe cells upon panTA-knockdown, while only 18 upregulated genes were also upregulated in LoKe TA-knockdown cells (Figure 5B). GSEA and KEGG pathway analysis of the differentially expressed genes exhibited strikingly similar patterns with LoKe and WaGa-RB1k.d. panTA-knockdown (Supporting Information S2: Table S14). Notably, dysregulated pathways upon panTA-knockdown in all three cell lines included suppressed mitotic cell cycle, DNA replication, and chromosomal organization (Figure 5C). In addition, both LoKe and CVG-1 data sets demonstrated reduced expression of genes associated with glutathione metabolism and pyruvate formation, implying a similar reduction in stemness. Indeed, stemness gene panel scoring demonstrated that 16 out of 18 signatures had reduced scores in CVG-1 cells after panTA-knockdown, with Hs-SC-Shats being the most significantly repressed stemness signature as in LoKe and WaGa-RB1k.d. panTA-knockdown (Supporting Information S2: Table S15). Estimating in CVG-1 the activities of those regulons previously observed to be altered in LoKe after panTA-knockdown revealed similar patterns of regulatory signals, specifically, E2F1, E2F8, TFDP1, MYB1L, SOX2 and YBX1 regulons were among the most repressed upon panTA-knockdown (Figure 5D, Supporting Information S2: Table S16). Notably, MCM2-7 genes were also downregulated in CVG-1 panTA-knockdown cells. On the other hand, there were also some differences in panTA-knockdown activated pathways, e.g., though with coherent repression of regulons related to DNA replication and chromosome organization, CVG-1 cells did not show pronounced activation of neurogenesis-related regulons such as PBX1 and SOX6 regulons (Figure 5E, Supporting Information S2: Table S17). Nonetheless, MP29 NPC/OPC activity was particularly pronounced in CVG-1 LTAlow cells (Figure 5F, Supporting Information S1: Figure S5H). Even though the increased neural differentiation after panTA-knockdown aligns with a previous study,10 the increase in neurogenesis-related regulon activities upon panTA-knockdown observed in RB-lacking LoKe suggests that TAs inhibit neural differentiation in both RB-dependent and -independent ways.
Next, we scrutinized the proteomics data from Bachiri et al. on differentially expressed proteins in WaGa cells after panTA-knockdown to see if the differential gene expression was reflected in protein expression.18 Among the 878 differentially expressed proteins with |log2FC | > 0.4 and p < 0.05 as well as proteins with exclusive expression in either control or panTA-knockdown cells, 153 had the same differential expression patterns as observed for mRNA expression in LoKe cells after panTA-knockdown (Supporting Information S2: Table S18). Inspecting the concordantly expressed proteins, we noticed stemness-related proteins such as MCM2, MCM3, MCM4, MCM6 and proliferating cell nuclear antigen PCNA were among the downregulated proteins, along with increased protein level of neural-specific proteins such as calcium-dependent secretion activator 1 (CADPS) and synapsin 2 (SYN2) (Figure 5G). Notably, neural membrane protein contactin 2 (CNTN2) was found to be exclusively expressed in panTA-knockdown cells (Bachiri et al., Supporting Information S2: Tables S1 and S18), and CNTN2 expression was also observed to be increased in LoKe cells upon panTA-knockdown (log2FC = 0.509), though no significant differences can be observed in WaGa-RB1k.d. and CVG-1 cells. Comparing the gene expression of WaGa-RB1k.d. cells upon panTA knockdown with the proteomics data, 126 had concordant mRNA-protein expression patterns upon panTA-knockdown, among these were reduced stemness gene products such as PCNA, CDK1, HMGB2 as well as MCM proteins, and enhanced expressions of neurogenesis gene products CADPS and SYN2 (Figure 5H). These findings implied that through recruitment of alternative pathways and genes, there was a general reduction of DNA replication and a trend towards neural differentiation of virus-positive MCC cell lines when TAs were depleted, regardless of the presence of functional RB1.
3.8 Reduced TA expression is associated with enhanced neural differentiation in situ
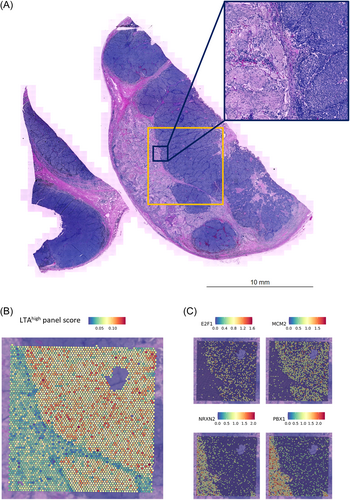
Finally, we were able to transfer our observations from the functional in vitro experiments into the human in situ situation. This was done by re-analyzing spatial transcriptomics data of a recently reported case series of Merkel cell carcinomas displaying both neuroendocrine and neuroblastic components. (Figure 6A).17 As spatial transcriptomics using the 10X Genomics FFPE Visium technology does not capture viral transcripts, we inferred TA expression using differentially expressed genes which were upregulated in LTAhigh LoKe cells as a proxy. 244 genes with log2FC < −0.5 (i.e. under-expressed in LTAlow cells) were included for gene panel scoring (Supporting Information S2: Table S2). The neuroblastic region had lower scores compared with neuroendocrine region, suggesting reduced TA expression (Figure 6B). E2F genes such as E2F1 and MCM genes, e.g., MCM2, were also coherently higher expressed in classical, neuroendocrine MCC regions and repressed in neuroblastic part, whereas PBX1 as well as neurexin genes NRXN2 were significantly higher expressed in the neuroblastic region (Figure 6C).
4 DISCUSSION
In MCC cells the role of MCPyV LTA as an inhibitor of RB has been well studied, but further functions of TA have not been widely explored due to growth arrest and cell death after panTA-knockdown in conventional MCC cell lines. In the present work, we used two MCPyV-positive MCC cell lines that have either spontaneously (LoKe) or experimentally (WaGa-RB1k.d.) lost RB1 and thus show LTA-independent growth to explore the biological effects of MCPyV TA beyond RB targeting. We discovered that upon panTA-knockdown in these cells the expression of stem cell-related genes is decreased. This observation aligned with gene regulatory network analyses, which revealed that the top downregulated regulons were under the control of E2F family members. Notably, the diminished stemness was linked to an increased propensity for neural differentiation, which we also observed after panTA-knockdown in CVG-1 MCC cells.10 To further confirm our observations, we performed comparative analysis of the perturbated gene expressions with the protein expression data from a WaGa panTA-knockdown experiment,18 which showed coherent downregulation of genes involved in DNA replication and upregulation of neurogenesis-related genes. Finally, spatially resolved transcriptomics shows a significant reduction in TA expression in regions of an MCC tumor exhibiting neural differentiation.17 This neural differentiation was also associated with the loss of expression of genes associated with stem cell properties. Taken together, these findings demonstrate the critical role of MCPyV TAs in maintaining stem cell function of MCC cells and inhibiting neural differentiation, independent of their effects on the RB signaling pathway.
It has been demonstrated that MCPyV STA stimulates pro-glycolytic metabolic pathways by increasing the expression of solute carrier protein genes, with a particular emphasis on SLC16A1. SLC16A1 is the primary transporter for lactate and pyruvate.31 Our study confirmed that panTA-knockdown reduced the expression level of SLC genes, most notably mitochondrial carriers such as SLC25A1, SLC25A4 and SLC25A5 (Supporting Information S2: Table S2). While we did not observe significant decrease in SLC16A1 expression in our data, we observed reduced expression of the related SLC16A7 (aka MCT2, mean log2FC = −0.305, adjusted p = 5.46e-36, Supporting Information S2: Table S2), which is also a monocarboxylate carrier across the plasma membrane.32 A correlation between SLC16A7 and stemness signatures was observed across 33 different cancer types, indicating this is a widespread phenomenon in multiple tumor contexts.33 This illustrates that the capacity of TAs to enhance the expression of metabolite carriers could potentially contribute to sustaining a metabolic environment conducive to stemness in transformed cells.
Interestingly, the neural differentiation observed in MCC cells following panTA-knockdown was associated with reduced expression of genes encoding proteins involved in chromosome organization and DNA repair, e.g., MCM2-7 genes. The MCM2-7 genes, which are conserved across the eukaryotic domain, encode six structurally related proteins. These proteins assemble to form a helicase-like hexamer complex, which binds to the replication origin on chromosomes and functions as a replication licensing protein.34 As MCM overexpression is observed in different cancers,35 their upregulation may serve to license dormant replication origins under replication stress in rapidly proliferating cells.36 The MCM genes' expression is primarily regulated by E2F through multiple E2F-binding sites in their promoter regions.37 Consequently, it was anticipated that the panTA-knockdown restoring RB inhibition of E2F, would lead to repression of MCM gene expression in CVG-1 cells. In contrast, in LoKe and WaGa-RB1k.d cells, E2F is not inhibited by RB upon panTA-knockdown, implying that the observed reduced MCM expression is mediated in a RB-independent, but possibly still E2F-dependent fashion. Indeed, gene regulatory network analysis identified several members of the E2F family as well as the E2F heterodimerization partner TFDP1 among the most significantly downregulated regulons upon panTA-knockdown in RB1-loss MCC cell lines.
The possibility of MCM transcription being independent of RB in MCC cells is supported by previous studies. For instance, there is evidence for increased transcription of MCM genes during the G1/S phase, which is regulated by the activity of the E2F transcription factor, independent of RB.34 Additionally, the MCM family of proteins, including MCM2-7, MCM8, and MCM10, have been found to be transcriptionally regulated together, suggesting a complex regulatory network for MCM expression that may not be solely dependent on RB.38 It is worth noting that the latency-associated nuclear antigen (LANA) encoded by Kaposi's sarcoma-associated herpesvirus (KSHV) has been reported to recruit MCM and the origin recognition complex (ORC) to the terminal repeat, where the viral replication origin is situated, for LANA-dependent KSHV latent replication.39 These findings collectively suggest that while expression MCM genes is normally regulated via the RB1-E2F axis, upon viral infection MCM can be overexpressed as a result of viral genome integration, as a result MCM transcription may indeed be independent of RB in certain cellular contexts.
In summary, differential gene expression analysis of LTAhigh and LTAlow RB1-loss MCC cells on a single cell level has revealed intriguing disparities in stemness, metabolic pathways, and neural differentiation. Furthermore, minichromosome maintenance proteins are likely to contribute to the maintenance of stem cell-like properties after MCC tumorigenesis. Importantly, similar changes were also observed following panTA-knockdown in CVG-1 and WaGa MCC cells or in situ in a MCC lesion with neuroblastic differentiation. Thus, our research sheds light on the intricate interplay between cellular processes and provides valuable insights into the potential impact on cell behavior and differentiation pathways. The findings underscore the significance of understanding these molecular mechanisms in the context of cell transformation and survival, offering promising avenues for further exploration and potential therapeutic implications.
AUTHOR CONTRIBUTIONS
David Schrama and Jürgen C. Becker conceptualized and supervised the study; Lukas Peiffer, Nalini Srinivas, Ivelina Spassova, Mitalee Chandra and Thibault Kervarrec performed the experiments and provided data acquisition; Kuan Cheok Lei and Jürgen C. Becker developed the methodology, curated the data, performed statistical and computational analyses, interpreted the results and drafted the manuscript; Kuan Cheok Lei, Thibault Kervarrec, Roland Houben, Masahiro Shuda, Daniel Hoffmann, David Schrama, Jürgen C. Becker reviewed and edited the manuscript. All authors read and approved the final paper.
ACKNOWLEDGMENTS
This study was supported by the BMBF via the Deutsches Konsortium für Translationale Krebsforschung (DKTK, ED03) and Else Kröner-Fresenius-Stiftung via University Medicine Essen Medical Scientist Academy (UMESciA). Open Access funding enabled and organized by Projekt DEAL.
CONFLICT OF INTEREST STATEMENT
Lukas Peiffer is currently hired by Boehringer Ingelheim. Jürgen C. Becker reports grants from Alcedis, Bristol Myers Squibb, HTC Molecular Diagnostics, IQVIA, Merck Serono, and Alcedis; consulting fees from Almirall Hermal, Boehringer Ingelheim, InProTher, Merck Serono, Pfizer, and Sanofi–Regeneron; and honoraria from Amgen, Pfizer, Recordati, Sanofi and Sun Pharma. Jürgen C. Becker participated on a data safety monitoring or advisory board from ICON Clinical Research and 4SC. The remaining authors declare no conflict of interest.
Open Research
DATA AVAILABILITY STATEMENT
The raw data and filtered gene expression with cell annotations used in this study are available under GEO accession GSE254170.


