The effect of SARS-CoV-2 infection on cardiac function in post-COVID-19 survivors: A systematic review and meta-analysis
Abstract
The longitudinal trajectories of cardiac structure and function following SARS-CoV-2 infection are unclear. Therefore, this meta-analysis aims to elucidate the effect of SARS-CoV-2 infection on cardiac function in coronavirus disease 2019 (COVID-19) survivors after recovery.
PubMed/MEDLINE, CENTRAL, and EMBASE were systematically searched for articles published up to 1st August 2022. A systematic review and meta-analysis were performed to calculate the pooled effects size and 95% confidence interval of each outcome.
A total of 21 studies including 2394 individuals (1436 post-COVID-19 cases and 958 controls) were included in the present meta-analysis. The pooled analyses compared with control groups showed a significant association between post-COVID-19 and reduced left ventricular ejection fraction (LV EF), LV end-diastolic volume (LV EDV), LV stroke volume (LV SV), mitral annular plane systolic excursion (MAPSE), global longitudinal strain, right ventricular EF (RV EF), RV EDV, RV ESV, RV SV, tricuspid annular plane systolic excursion, and increased LV mass. Subgroup analysis based on the severity of COVID-19 in the acute phase and subsequent chronic outcomes revealed that LV EF, MAPSE, RV EF, and RV ESV only decreased in studies including patients with a history of intensive care unit admission.
Cardiac impairment after SARS-CoV-2 infection persisted in recovered COVID-19 patients even after 1 year. Future studies are warranted to determine the biological mechanisms underlying the long-term cardiovascular consequences of COVID-19.
1 INTRODUCTION
Since early December 2019, the coronavirus disease 2019 (COVID-19) pandemic, as a result of a novel virus (SARS-CoV-2) outbreak originally identified in Wuhan (China), has posed a significant threat to global health and the functioning of health systems.1 In addition to severe respiratory damage caused by uncontrolled SARS-CoV-2 infection, COVID-19 can lead to inflammatory cytokine storm2 and multiple organ dysfunction syndromes3 in the heart (26%), lungs (11%), kidneys (4%), liver (28%), pancreas (40%), and spleen (4%).4
The mechanisms of COVID-19-induced heart damage have not been fully understood. Several possible patterns of cardiovascular dysfunction are associated with COVID-19, such as myocarditis, ischemic (infarction) insult, hypovolemia, right ventricular dysfunction related to mechanical ventilation and pulmonary embolism, or, eventually, cardiovascular dysfunction due to super-imposed bacterial or fungal sepsis.5 The pathological findings suggest that SARS-CoV-2 can induce hyper myocardial inflammation by infecting cardiomyocytes, and this may develop myocyte necrosis,6 which may further lead to increased incidence of acute myocardial infarction (21%), heart failure (14%), arrhythmia (16%), cardiac arrest (3.46%,), and acute coronary syndrome (1.3%).7 In addition to potential injury associated with the illness, some medications used to treat patients with COVID-198 and drug interactions may also have potential side effects specific to the heart.9
In a systematic review and meta-analysis, Changal et al.10 showed that hospitalized COVID-19 patients have a high prevalence of myocardial injury, which was associated with a high risk of mortality. The studies included in this meta-analysis were primarily conducted during the active phase of COVID-19. Therefore, the data did not contribute to the understanding of whether myocardial dysfunction would be observed in recovered COVID-19 patients. Despite the advances in COVID-19 treatments, long-term sequelae of this disease, including those pertinent to the heart, are expected to endure in survivors.11 Hence, investigating myocardial dysfunction after COVID-19 recovery has a crucial clinical role in developing postdischarge surveillance programs and public health, economic and social policies.12 Studies in COVID-19 survivors after recovery have demonstrated impaired RV and LV function,13-16 increased risk of COVID-19 mortality,14, 15 and a high rate of diastolic dysfunction.14
In contrast, some studies found no significant structural or functional cardiographic abnormalities in COVID-19 survivors.17, 18 In a recent systematic review and meta-analysis, Ramadan et al.19 illustrated common cardiac abnormalities, including myocarditis and late gadolinium enhancement (LGE) in cardiac magnetic resonance imaging (CMR) of COVID-19 survivors after recovery. However, these researchers did not report any findings related to cardiac function in COVID-19 survivors after recovery. Therefore, we performed a systematic review and meta-analysis of the current literature addressing cardiac dysfunction after COVID-19 recovery (Table 1).
| Study | Design | Country | Group (gender: %M) | Age (year) | Post-COVID follow-up | Cardiac evaluation | Study period | History of CVD (rate) | COVID-19 severity (rate) | Antiviral therapy (rate) | Outcome measure |
|---|---|---|---|---|---|---|---|---|---|---|---|
| Asarcikli et al.20 | Case-control | Turkey | T: 60 (38) C: 33 (27) |
30 ± 8 39 ± 9 |
3-6 m | ECG echo |
March 2020 to March 2021 | T: 0% C: 0% |
Hosp: 100% ICU: 0% |
NR | LV EF, LV EDV |
| Brito et al.21 | Cohort | USA | COVID: 38 (79) C: 17 (40) |
19 ± 1 20 ± 1 |
1 m | ECG echo |
June to August 2020 | T: 0% C: 0% |
Hosp: 30% ICU: 0% |
NR | LV EF, LV EDV, LV ESV, LV mass |
| Cassar et al.22 | Cohort | UK | T (2–3 m): 58 (59) T (6 m): 46 (63) C: 30 (60) |
55.4 ± 13.2 55.2 ± 13.3 53.9 ± 12.3 |
2-3 m 6 m |
CMR ECG |
March to May 2020 | T: 3.4% C: 0% |
Hosp: 100% ICU: 34% |
7% | LV EF, LV EDV, LV ESV, LV mass, LV SV, RV EF, RV EDV, RV ESV, RV SV |
| Chistyakova et al.23 | Case-control | Russia | T1: 31 (NR) T2: 27 (NR) T3: 19 (NR) C: 22 (NR) |
33.5 ± 11.5 36 ± 8 36.9 ± 6.5 NR |
6 | ECG echo |
NR | T1: 0% T2: 0% T3: 0% C: 0% |
Hosp: 0% Hosp: 100% ICU: 100% |
100% 100% 100% |
MAPSE TAPSE |
| Clark et al.24 | Case-control | USA | T: 59 (37) C: 60 (88) |
20 ± 1 25 ± 2.5 |
1 m | CMR ECG echo |
NR | T: 0% C: 0% |
Hosp: 22% ICU: 0% |
NR | LV EF, LV EDV, LV ESV, LV mass, RV EF, RV EDV, RV ESV |
| Daniels et al.25 | Cohort | USA | T: 1597 (964) | NR | 1–4 m | CMR ECG echo |
March to December 2020 | T: 2.3% | Hosp: 0% | 0% | Myocarditis |
| Drakos et al.26 | Case-control | Germany | T: 22 (64) C: 17 (47) |
51 ± 7 39 ± 8.5 |
1–6 m | CMR | April to October 2020 | T: 0% C: 0% |
Hosp: 100% ICU: 0% |
NR | LV EF, LV EDV, LV ESV, LV mass, RV EF, RV EDV, RV ESV |
| Gao et al.17 | Cohort | China | T: 86 (37) C: 28 (36) |
56 ± 14 58 ± 15.5 |
10–11 m | CMR | December 2020 to January 2021 | T: 15% C: 10% |
Hosp: 91% ICU: 22% |
100% | LV EF, LV EDV, LV ESV, LV mass, LV GLS, MAPSE, TAPSE |
| Goncu Ayhan et al.27 | Case-control | Turkey | T: 45 (0) C: 46 (0) |
29 ± 4 28 ± 5 |
1 m | echo | January 2021 to June 2021 | T: 0% C: 0% |
Hosp: 100% ICU: 0% |
NR | MAPSE TAPSE |
| Huang et al.28 | Cohort | China | T: 15 (27) C: 20 (35) |
39 ± 10 40 ± 10.5 |
1–2 m | CMR ECG echo |
March 2020 | T: 0% C: 0% |
Hosp: 100% ICU: 15% |
100% | LV EF, LV EDV, LV ESV, LV mass, LV SV, RV EF, RV EDV, RV ESV, RV SV |
| Ingul et al.13 | Cohort | Norway | T: 204 (56) C: 204 (56) |
58.5 ± 13.6 58.4 ± 13.4 |
3–6 m | ECG echo |
February to June 2020 | T: 7% C: 7% |
Hosp: 100% ICU: 20% |
NR | LV EF, LV EDV, LV GLS, MAPSE, TAPSE |
| Kotecha et al.29 | Cohort | UK | T: 148 (70) C: 40 (67) |
64 ± 12 49 ± 6 |
2 m | CMR ECG echo |
until 20 June 2020 | T: 0% C: 0% |
Hosp: 100% ICU: 0% |
NR | LV EF, LV EDV, LV ESV, LV mass, RV EF, RV EDV, RV ESV |
| Lassen et al.30 | Cohort | Denmark | T: 91 (59) C: 91 (59) |
62.5 ± 12.1 62.1 ± 12.2 |
2–3 m | ECG echo |
March to June 2020 | T: 3% C: 2% |
Hosp: 100% ICU: 19% |
NR | LV EF, LV EDV, LV ESV, LV GLS, TAPSE |
| Li et al.31 | Cohort | China | T: 40 (60) C: 25 (64) |
54 ± 12 50 ± 15 |
5–6 m | CMR ECG echo |
May to September 2020 | T: 0% C: 0% |
Hosp: 100% ICU: 40% |
100% | LV EF, LV EDV, LV ESV, LV mass, LV SV, LV GLS, RV EF, RV EDV, RV ESV, RV SV |
| Martinez et al.32 | Cohort | USA | T: 789 (777) | 25 ± 10 | 1–5 m | CMR ECG echo |
May to October 2020 | T: 0% | Hosp: 0% | 0% | Myocarditis |
| Moulson et al.33 | Cohort | USA | T: 3018 (2052) | 20 ± 1 | 1–5 m | CMR ECG echo |
September to December 2020 | T: 0% | Hosp: 2% | 0% | Myocarditis |
| Myhre et al.34 | Cohort | Norway | T: 58 (59) C: 32 (44) |
56 ± 10.5 69 ± 10.5 |
6 m | CMR echo |
March to May 2020 | T: 8.6% C: 0% |
Hosp: 100% ICU: 19% |
100% | LV EF, RV EF |
| Pan et al.35 | Cohort | China | T: 21 (47) C: 20 (40) |
36 ± 8 69 ± 14.5 |
6 m 1–2 m |
CMR ECG echo |
March to April 2020 | T: 0% C: 0% |
Hosp: 100% ICU: 14% |
81% | LV EF, LV EDV, LV ESV, LV mass, LV SV, RV EF, RV EDV, RV ESV, RV SV |
| Petek et al.36 | Cohort | USA | T: 3675 (2462) | 20 ± 1 | 1–12 m | CMR ECG echo |
September 2020 to November 2021 | T: 0% | Hosp: 0% | 0% | Myocarditis |
| Puntmann et al.37 | Cohort | Germany | T: 100 (53) C: 50 (50) |
49 ± 14 48 ± 16 |
2–3 m | CMR | April to June 2020 | T: 22% C: 23% |
Hosp: 33% ICU: 19% |
1% | LV EF, LV EDV, LV mass, RV EF, |
| Roca-Fernandez et al.38 | Cohort | UK | T (6 m): 41 (41) T (12 m): 41 (24) C: 92 (28) |
43 ± 7 44 ± 7 44 ± 7 |
6 m 12 m |
CMR | March to May 2020 | T: NR C: NR |
Hosp: 100% ICU: 25% |
NR | LV EF, LV EDV, LV ESV, LV mass, LV SV, RV EF, RV EDV, RV ESV, RV SV |
| Sechi et al.18 | Case-control | Italy | T: 105 (53) C: 105 (53) |
57 ± 14 57 ± 14 |
1–2 m | ECG echo |
April to May 2020 | T: 8% C: 8% |
Hosp: 100% ICU: 27% |
100% | LV EF, LV EDV, LV ESV, LV mass, MAPSE, TAPSE |
| Seidel et al.39 | Cohort | Germany | T: 18 (33) C: 7 (71) |
12 ± 2.5 15 ± 4.5 |
1–2 m | CMR | November 2020 to January 2021 | T: 0% C: 0% |
Hosp: 0% ICU: 0% |
NR | LV EF, LV EDV, LV ESV, RV EF, RV EDV, RV ESV |
| Wang et al.40 | Cohort | China | T: 75 (51) C: 31 (61) |
47.4 ± 12.3 47.1 ± 11 |
3 m | CMR ECG echo |
May to July 2020 | T: 0% C: 0% |
Hosp: 100% ICU: 23% |
55% | LV EF, LV EDV, LV ESV, LV mass, LV SV, LV GLS, RV EF, RV EDV, RV ESV, RV SV |
| Webster et al.41 | Cohort | USA | T: 17 (53) C: 23 (53) |
14.1 ± 2.2 16.8 ± 1.3 |
2–3 m | CMR ECG echo |
September to December 2020 | T: 0% C: 0% |
Hosp: 100% ICU: 0% |
NR | LV EF, LV EDV, RV EDV |
- Abbreviations: CMR, cardiovascular magnetic resonance imaging; ECG, electrocardiography; EDV, end-diastolic volume; EF, ejection fraction; ESV, end-systolic volume; echo, echocardiography; CVD, cardiovascular disease; GLS, global longitudinal strain; Hosp, hospitalization, ICU, intensive care unit admissions, LV, left ventricular; MAPSE, mitral annular plane systolic excursion; NR, not reported; RV, right ventricular; SV, stroke volume; m, month; T, treatment group; TAPSE, tricuspid annular plane systolic excursion.
2 METHODS
The current systematic review and meta-analysis was carried out following methodological guidelines from the Cochrane Handbook for Systematic Reviews42 and the findings were reported under the PRISMA (Preferred Reporting Items for Systematic Review and Meta-Analyses) statement 2020 (Supporting Information Material S1).43 This systematic review followed a preplanned but unpublished protocol. Data is available on reasonable request from the corresponding author.
2.1 Search strategy
Three electronic databases including PubMed/Medline, CENTRAL, and EMBASE were systematically searched by two researchers (MA and MK) up to August 2022. The search strategy and terms are listed in Supporting Information Material S2. We searched all reference lists of included studies to find other eligible articles. Additionally, language restriction was not considered in our systematic search.
2.2 Eligibility criteria
The Eligibility criteria for the present systematic review and meta-analysis followed the PICOs question.44 We included studies that evaluated the effects of SARS-CoV-2 infection on cardiac function in COVID-19 patient survivors after recovery, which have reported at least one of the following outcomes: left ventricular ejection fraction (LV EF), LV end-diastolic volume (LV EDV), LV end-systolic volume (LV ESV), LV stroke volume (LV SV), mitral annular plane systolic excursion (MAPSE), global longitudinal strain (GLS), right ventricular EF (RV EF), RV EDV, RV ESV, RV SV, and tricuspid annular plane systolic excursion (TAPSE). We included prospective or retrospective cohort studies and also case-control studies in patients who recovered from COVID-19 and underwent CMR, electrocardiography (ECG), and echocardiography (echo) after recovery. Studies were excluded if they reported CMR, ECG, and echo findings during the acute stage of COVID-19. Finally, abstracts with insufficient data, and studies with no reported sample size were excluded from the present systematic review and meta-analysis.
2.3 Data extraction and quality assessment
The following data were extracted from the eligible studies: study design, country, age and gender, post-COVID-19 follow-up period, study period, history of previous cardiovascular disease, COVID-19 severity, antiviral therapy during the acute phase of COVID-19, and relative outcomes. The quality of included cohort and case-control studies were assessed using the Newcastle–Ottawa Scale (NOS).45 Data extraction and quality assessment were independently performed by two reviewers (M.R. and E.B.), and discrepancies were solved by consensus with a third researcher (J.I.Sh) before meta-analysis.
2.4 Subgroup analysis
We performed three sets of subgroup analyses. First, we conducted a subgroup analysis based on different study types (cohorts vs. case-controls). Second, we performed another subgroup analysis based on different post-COVID-19 follow-up durations (<2 months, 2–3 months, 3–6 months, and >6 months) to determine the real impact of SARS-CoV-2 infection on cardiac structure and function in COVID-19 survivors after recovery. Third, we performed another subgroup analysis based on the severity of acute COVID-19 in studies including patients with a history of intensive care unit (ICU) admission compared with studies that were only performed on hospitalized patients (ICU admission [15%–40%] vs. no ICU admission).
2.5 Statistical analyses
All meta-analyses in the current study were conducted using Review manager (Version 5.4, The Nordic Cochrane Centre, Copenhagen, The Cochrane Collaboration, 2014) and P value less than 0.05 was considered significant. Continuous outcomes were pooled and expressed as mean difference (MD) or standardized MD (SMD) with corresponding 95% confidence intervals (CI).46 The pooled analysis results were classified based on study types into two categories, cohorts and case-control studies, and the pooled effect sizes were estimated using the random-effect model if significant heterogeneity was detected. Otherwise, a Fixed-effect model was employed.47 Moreover, Cochran's Q statistics and I2 were used to calculate heterogeneity. Moreover, the potential for publication bias was assessed using funnel plots with Egger weighted regression test. Finally, to assess the robustness of summary estimates and to detect if any particular study accounted for a large proportion of heterogeneity, the overall pooled effect size of the respective outcomes was re-estimated by the one study removed methods to perform sensitivity analysis.48
3 RESULTS
3.1 Study identification and characteristics
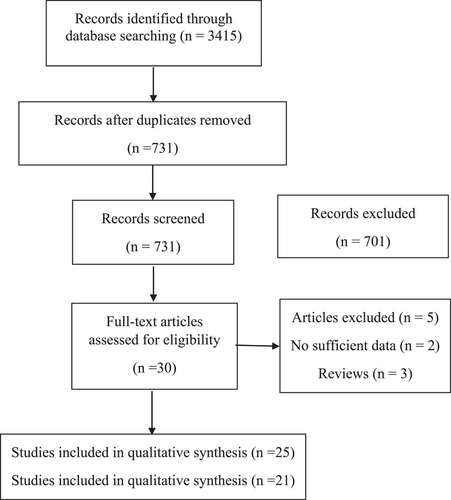
We identified 21 studies involving 2394 individuals (1436 post-COVID-19 cases and 958 controls) addressing the effects of SARS-CoV-2 infection on cardiac function in COVID-19 survivors after recovery (Figure 1). Moreover, there was no control group in additional 4 cohort studies and there were included only in the systematic review study. Reports were published between 2020 and 2022 using the following experimental designs: 16 cohorts and 5 case-control studies. Recovery periods vary between 1 month and 1 year after SARS-CoV-2 infection in all included studies. The included studies used CMR, ECG, and echocardiography to evaluate cardiac structure and function. Except for 7 studies,17, 20, 23, 24, 27, 36, 39 the remaining 14 studies were enrolled in COVID-19 patients from the first wave of the pandemic. COVID-19 patients with any history of relevant cardiovascular diseases were excluded in 14 studies,20, 21, 23, 24, 26-29, 31, 35, 39-41 while the remaining studies included risk factor-matched controls. A total of 15%–40% of COVID-19 patients were admitted to the ICU in 11 studies,13, 17, 18, 22, 23, 28, 30, 31, 34, 37, 38 while the remaining studies were enrolled in hospitalized COVID-19 patients with mild to moderate symptoms. Only 10 studies17, 18, 22, 23, 28, 31, 34, 35, 37, 40 reported the rate of antiviral treatment, and there was no information for this treatment in other included studies. All the cohort and case-control studies were of mild to high quality, with NOS scores between 6 and 9 (Supporting Information Material S3).
3.2 The effect of SARS-CoV-2 infection on left ventricular function after recovery
3.2.1 Left ventricular ejection fraction (%)
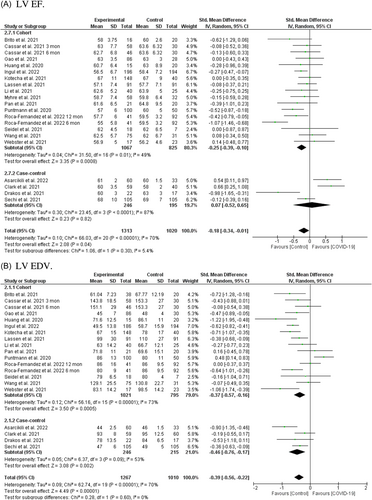
A total of 19 studies involving 2333 individuals (1313 post-COVID-19 cases and 1020 controls) reported LV EF in COVID-19 survivors after recovery.13, 17, 18, 20-22, 24, 26, 28-31, 34, 35, 37-41 Overall pooled analyses showed reduced LV EF in recovered COVID-19 patients (SMD = −0.18, 95% CI = −0.34 to −0.01, p = 0.04; Figure 2A). Significant heterogeneity was observed among the included studies (I2 = 70%, p = 0.00001). According to the study types, the pooled main effect analyses in cohorts and case-control studies were SMD −0.25 (95% CI = −0.39, −0.10; p = 0.0008) and SMD 0.07 (95% CI = −0.52, 0.65; p = 0.82), respectively. Subgroup analysis based on different post-COVID-19 follow-up durations showed no difference between all post-COVID-19 follow-up durations after recovery (Figure S4A). Subgroup analysis based on the severity of the acute COVID-19 phase and subsequent chronic cardiac outcomes revealed that LV EF only decreased in studies including patients (15%–40% of the included cases) with a history of ICU admission (Figure S4M).
3.2.2 Left ventricular end-diastolic volume (ml/m2)
The random-effect model analyses by including 18 studies involving 2277 individuals (1267 post-COVID-19 cases and 1010 controls)13, 17, 18, 20-22, 24, 26, 28-31, 35, 37-41 showed a significant association between post-COVID-19 and reduced LV EDV after recovery from SARS-CoV-2 infection (SMD = −0.39, 95% CI = −0.56 to −0.22, p = 0.00001; Figure 2B). The pooled main effects were comparable for the different study designs: SMD = −0.37, 95% CI = −0.57, −0.16; p = 0.0006 (in cohorts), SMD = −0.46, 95% CI = −0.76, −0.17; p = 0.002 (in case-controls). Subgroup analysis based on different post-COVID-19 follow-up durations showed that reduced LV EDV would exist 2 months after recovery from SARS-CoV-2 infection (Figure S4B). Subgroup analysis based on the severity of the acute COVID-19 phase and subsequent chronic cardiac outcomes indicated no difference between severe acute illness and reduced LV EDV (Figure S4N).
3.2.3 Left ventricular end-systolic volume (ml/m2)
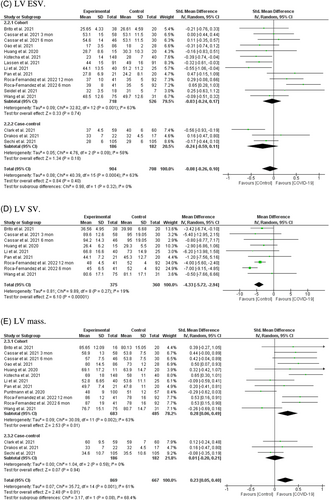
Including 14 studies involving 1612 individuals (904 post-COVID-19 cases and 708 controls)17, 18, 21, 22, 24, 26, 28-31, 35, 38-40 showed no association between post-COVID-19 and LV ESV after recovery from SARS-CoV-2 infection (SMD = −0.08, 95% CI = −0.26 to 0.10, p = 0.40; Figure 2C). Subgroup analysis based on study type showed no significant difference between cohorts (SMD = −0.03, 95% CI = −0.24 to 0.17, p = 0.74) and case-controls (SMD = −0.24, 95% CI = −0.59 to 0.11, p = 0.18). Moreover, subgroup analysis based on different post-COVID-19 follow-up durations showed a nonsignificant trend toward 3 months after recovery from SARS-CoV-2 infection (Figure S4C). Subgroup analysis based on the severity of the acute COVID-19 phase and subsequent chronic cardiac outcomes revealed no difference between severe acute illness and LV ESV values (Figure S4O).
3.2.4 Left ventricular stroke volume (ml)
In eight reports from seven cohort studies involving 753 individuals (375 post-COVID-19 cases and 360 controls)21, 22, 28, 31, 35, 38, 40 there was a significant association between SARS-CoV-2 infection and reduced LV SV in COVID-19 patient survivors after recovery (MD = −4.33, 95% CI = −5.72 to −2.94, p = 0.00001; Figure 2D). There was no significant heterogeneity among the included studies (I2 = 19%, p = 0.27). Additionally, subgroup analysis based on different post-COVID-19 follow-up durations showed that reduced LV SV, except in a 2–3-month period, existed in all other periods after recovery (Figure S4D). Subgroup analysis based on the severity of acute COVID-19 phase and subsequent chronic cardiac outcomes revealed no difference between severe acute illness and reduced LV SV (Figure S4P).
3.2.5 Left ventricular mass (g/m2)
A total of 13 studies involving 1536 individuals (869 post-COVID-19 cases and 667 controls) were included in this analysis.17, 18, 21, 22, 24, 26, 28, 29, 31, 35, 37, 38, 40 There was a statistically significant difference between SARS-CoV-2 infection and elevated LV mass in COVID-19 survivors after recovery (SMD = 0.23, 95% CI = 0.05–0.40, p = 0.01; Figure 2E). The SMDs observed for LV mass in the cohort and case-control studies were 0.28 (95% CI = 0.06, 0.49, p = 0.01), and −0.01 (95% CI = −0.20, 0.21, p = 0.94), respectively. Interestingly, subgroup analysis based on different post-COVID-19 follow-up durations showed that LV mass starts to increase significantly 3 months after recovery from SARS-CoV-2 infection (Figure S4E). Subgroup analysis based on the severity of acute COVID-19 phase and subsequent chronic cardiac outcomes revealed no difference between severe acute illness and elevated LV mass (Figure S4Q).
3.2.6 Mitral annular plane systolic excursion (cm)
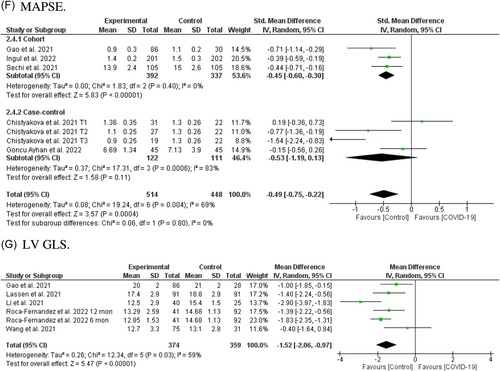
Pooled analysis in seven reports from five studies involving 962 individuals (514 post-COVID-19 cases and 448 controls)13, 17, 18, 23, 27 showed a significant association between SARS-CoV-2 infection and reduced MAPSE in COVID-19 survivors after recovery (SMD = −0.51, 95% CI = −0.76 to −0.26, p = 0.0001; Figure 2F). Pooled analysis from cohorts reached significant levels (SMD = −0.47, 95% CI = −0.61 to −0.32, p = 0.00001), while case-controls did not (SMD = −0.53, 95% CI = −1.19 to 0.13, p = 0.11). Further, subgroup analysis based on different post-COVID-19 follow-up durations showed that reduced MAPSE existed between 2 months and 1 year after recovery (Figure S4F). Subgroup analysis based on the severity of the acute COVID-19 phase and subsequent chronic cardiac outcomes revealed that MAPSE only decreased in studies in which patients had a history of ICU admission (Figure S4R).
3.2.7 Left ventricular global longitudinal strain (%)
LV GLS was reported in five cohorts involving 731 individuals (374 post-COVID-19 cases and 359 controls).17, 30, 31, 38, 40 Fixed effect analysis showed reduced LV GLS in recovered COVID-19 patients (MD = −1.52, 95% CI = −1.64 to −0.97, p = 0.00001; Figure 2G). Subgroup analysis based on different post-COVID-19 follow-up durations showed that reduced LV GLS would exist 2 months to 1 year after recovery (Figure S4G). The number of studies was too small to permit subgroup analysis based on the severity of the acute COVID-19 phase.
3.3 The effect of SARS-CoV-2 infection on right ventricular function after recovery
3.3.1 Right ventricular ejection fraction (%)
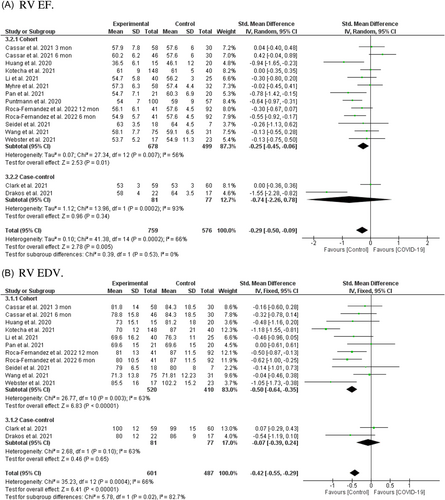
Among 13 studies including 1335 individuals (759 post-COVID-19 cases and 576 controls),22, 24, 26, 28, 29, 31, 34, 35, 37-41 a significant association was found between post-COVID-19 and reduced RV EF after recovery from SARS-CoV-2 infection (SMD = −0.29, 95% CI = −0.50 to −0.09, p = 0.005; Figure 3A). Subgroup analysis based on study type showed a difference between cohorts (SMD = −0.25, 95% CI = −0.45 to −0.036, p = 0.01) and case-controls (SMD = −0.47, 95% CI = −2.26 to −0.78, p = 0.34). Moreover, subgroup analysis based on different post-COVID-19 follow-up durations showed that reduced RV EF existed 2–6 months after recovery (Figure S4H). Subgroup analysis based on the severity of the acute COVID-19 phase and subsequent chronic outcome revealed that RV EF only decreased in patients with a history of ICU admission (Figure S4S).
3.3.2 Right ventricular end-diastolic volume (ml/m2)
The random-effect model analyses included 11 studies with a total of 1088 individuals (601 post-COVID-19 cases and 487 controls),22, 26, 28, 31, 38-41 and a significant association was found between post-COVID-19 and reduced RV EDV after recovery from SARS-CoV-2 infection (SMD = −0.42, 95% CI = −0.55 to −0.29, p = 0.00001; Figure 3B). The pooled main effects were comparable for the different study designs: SMD = −0.50, 95% CI = −0.64, −0.35; p = 0.00001 (in nine cohorts), SMD = −0.07, 95% CI = −0.39, 0.24; p = 0.65 (in two case-controls). Subgroup analysis based on different post-COVID-19 follow-up durations showed that reduced RV EDV existed for 2 months to 1 year after recovery from SARS-CoV-2 infection (Figure S4I). Subgroup analysis based on the severity of the acute COVID-19 phase and subsequent chronic cardiac outcomes revealed no difference between severe acute illness and reduced RV EDV (Figure S4T).
3.3.3 Right ventricular end-systolic volume (ml/m2)
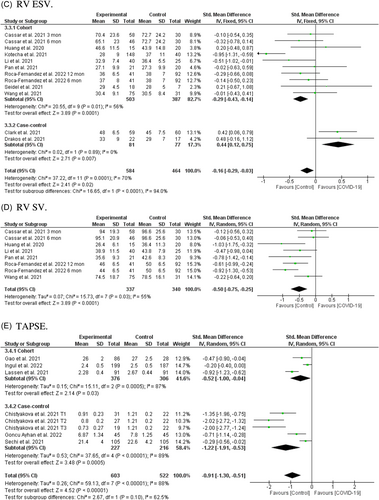
In 10 studies including 1012 individuals (548 post-COVID-19 cases and 464 controls)22, 26, 28, 31, 38-40 a significant association was found between post-COVID-19 and RV ESV after recovery from SARS-CoV-2 infection (SMD = −0.16, 95% CI = −0.29 to −0.03, p = 0.02; Figure 3C). However, subgroup analysis based on study type showed significant difference between eight included cohorts (SMD = −0.29, 95% CI = −0.43 to −0.14, p = 0.0001) and two included case-control (SMD = 0.44, 95% CI = −0.12 to 0.75, p = 0.007). Moreover, subgroup analysis based on different post-COVID-19 follow-up durations showed no significant difference between different periods after recovery from SARS-CoV-2 infection (Figure S4J). Subgroup analysis based on the severity of the acute COVID-19 phase and subsequent chronic outcome revealed that RV ESV only decreased in patients with a history of ICU admission (Figure S4U).
3.3.4 Right ventricular stroke volume (ml)
Among eight reports from six cohort studies with a total of 677 individuals (337 post-COVID-19 cases and 340 controls),22, 28, 31, 35, 38, 40 a significant association was found between SARS-CoV-2 infection and reduced RV SV in COVID-19 survivors after recovery (MD = −0.50, 95% CI = −0.75 to −0.205, p = 0.0001; Figure 3D). Significant heterogeneity was observed among the included studies (I2 = 55%, p = 0.03). Additionally, subgroup analysis based on different post-COVID-19 follow-up durations showed that reduced RV SV, except in a 2–3-month period, existed in all other periods after recovery (Figure S4K). The number of studies was too small to permit subgroup analysis based on the severity of the acute COVID-19 phase.
3.3.5 Tricuspid annular plane systolic excursion (cm)
Pooled analysis of eight reports from six studies including 1125 individuals (603 post-COVID-19 cases and 522 controls)13, 17, 18, 23, 27, 30 showed a significant association between SARS-CoV-2 infection and reduced TAPSE in COVID-19 survivors after recovery (SMD = −0.91, 95% CI = −1.30 to −0.51, p = 0.00001; Figure 3E). Pooled analysis from both cohorts (SMD = −0.52, 95% CI = −1.00 to −0.04, p = 0.0005), and case-controls reached significant levels (SMD = −1.22, 95% CI = −1.91 to −0.53, p = 0.0005). Further, subgroup analysis based on different post-COVID-19 follow-up durations showed that reduced TAPSE existed between 2 months and 1 year after recovery (Figure S4L). Subgroup analysis based on the severity of the acute COVID-19 phase and subsequent chronic cardiac outcomes revealed no difference between severe acute illness and reduced TAPSE (Figure S4W).
3.4 The effect of SARS-CoV-2 infection on cardiac involvement in athletes after recovery
Four cohorts including 9079 athletes reported cardiac involvement after recovery from SARS-CoV-2 infection. Daniels et al.25 in a cohort study from the Big Ten COVID-19 Cardiac Registry of 1597 competitive athletes reported that 37 athletes (2.3%) after COVID-19 infection were diagnosed with clinical and subclinical myocarditis. The prevalence of myocarditis per program ranged from 0% to 7.6% (overall, 2.3% [95% CI = 1.6%–3.2%] and 31 of 37 CMR imaging findings were identified with elevated T2 and elevated T1 or LGE. Interestingly, follow-up CMR imaging performed in 73.0% of athletes diagnosed with myocarditis demonstrated resolution of T2 elevation in all (100%) and LGE in 40.7%.25
In addition, Martinez et al.32 in a cohort study of 789 professional athletes who tested positive for COVID-19 reported 3 athletes with CMR-confirmed myocarditis (0.4%). Follow-up cardiac screening indicated no adverse cardiac events and all athletes resumed professional sport participation. Moulson et al.33 in another cohort study of 3018 young competitive athletes reported that 21 athletes (0.7%) after COVID-19 infection were diagnosed with clinical and subclinical myocarditis. During short-term clinical surveillance (median follow-up, 113 days) they reported only one (0.03%) adverse cardiac event. Finally, Petek et al.36 in a cohort study of 3675 collegiate athletes after SARS-CoV-2 infection with intermediate-term (>1 year) follow-up reported 21 (0.6%) athletes with myocardial or myopericardial involvement. Follow-up cardiac screening (median: 86 days [interquartile range: 33, 90]) indicated no adverse cardiac events and all athletes successfully returned to their sport activities. It is important to note that none of the athletes in three cohorts25, 32, 36 were clinically assessed as having severe COVID-19 infection and in the Moulson et al.33 study only five (0.2%) athletes required hospitalization for noncardiac complications of COVID-19. Taken together, these reports indicate that SARS-CoV-2 infection among athletes is associated with a very low prevalence of cardiac involvement which mainly cleared after a median follow-up period and allowed them to safely return to their sport activities.
3.5 Publication bias
Funnel plots suggested no noticeable bias in the studies of the present meta-analysis. Further, Begg's correlation rank and Egger's regression did not show significant publication bias (Supporting Information Material S3 and Figures S3A–L).
4 DISCUSSION
In the present systematic review and meta-analysis, we performed a pooled analysis to evaluate the effect of SARS-CoV-2 infection on cardiac function in post-COVID-19 survivors after recovery. Based on the results of 21 eligible articles, the present meta-analysis shows reduced LV EF, LV EDV, LV SV, MAPSE, GLS, RV EF, RV EDV, RV ESV, RV SV, TAPSE, and increased LV mass in post-COVID-19 survivors compared with controls. In addition, current evidence indicates that myocardial or myopericardial involvement in athletes related to post-COVID-19 infection are very low which mainly cleared after a median follow-up period and allowed them to safely return to their sport activities.
Several factors may explain the heterogeneous results of the present meta-analysis. Heterogeneous clinical course, significant heterogeneity in severity and pre-existing diseases (including cardiovascular disease, diverse baseline health profiles, demographic characteristics, diabetes and hypertension, and COVID-19 severity),49 regional heterogeneity,50 socio-demographic heterogeneity,51 geo-clusters, geo-environmental factors and demographic heterogeneity,52, 53 heterogeneous epidemic waves across countries,54 heterogeneity in the sensitivity of the methods used to define cardiographic dysfunctions55 and heterogeneous pharmacotherapies56 may have a potential impact on the results.
The results of the present meta-analysis support the hypothesis of COVID-induced ventricular dysfunction. Several pathophysiological hypotheses have been proposed to explain COVID-19 and ventricular dysfunction. Like other viral infections, COVID-19 may trigger multi-systemic infectious disease5, 57 which leads to cardiac dysfunction.58 It has been shown that systemic inflammation induced by COVID-19 may culminate in ventricular failure.59 Moreover, COVID-19 is associated with direct myocardial injury through many different mechanisms, including inflammation, microvascular dysfunction, hypoxia, and ischemia.60
Other proposed mechanisms of cardiac dysfunction in patients with COVID-19 infection include direct viral infection of the myocardium and pulmonary hypertension-induced RV dysfunction.61 Data from cardiopulmonary exercise testing post-COVID-19 hospitalization suggest that obesity, deconditioning, dysautonomia, and lower ventilatory efficiency may contribute to the pathophysiologic mechanisms of ventricular dysfunction related to post-COVID-19 infection.62, 63 The present findings support what has been observed in other clinical settings characterized by ventricular dysfunction; indeed, reduced right ventricular function was reported as a risk factor for adverse events in community-acquired pneumonia,64 as well as in patients with ventricular dysfunction.65
Several studies illustrated that the cardiac dysfunction parameter is significantly associated with all-cause mortality in hospitalized patients with COVID-1966 and survivors of COVID-19.67 In a systematic review and meta-analysis, Diaz-Arocutipa et al.68 showed that among cardiac parameters, TAPSE was independently associated with higher mortality. In another systematic review and meta-analysis, it has been shown that TAPSE in COVID-19 patients is related to mortality, right ventricular dysfunction, cardiac injury, and COVID-19 nonsurvivors had lower TAPSE measurements compared with survivors, while every 1 mm decrease in TAPSE was associated with an increase of approximately 20% in mortality.69 In another systematic review and meta-analysis of 16 studies with 1579 patients, Tian et al.70 illustrated that lower TAPSE and poor COVID-19 outcomes were independently associated with mortality and right ventricular dysfunction. Additionally, it has been demonstrated that lower GLS in patients with COVID-19 correlates with disease-related mortality.15 In a recent systematic review and meta-analysis, Wibowo et al.71 illustrated that lower LV-GLS in patients with COVID-19 was associated with poor outcomes and mortality, while for every 1% decrease in LV-GLS, the mortality increased by 1.3×. Reduced GLS after COVID-19 might also be affected by acute conditions such as myopericardial damage and acute respiratory distress syndrome related to other chronic causes such as cardiovascular diseases, hypertension, and diabetes.21, 71
The present systematic review and meta-analysis has several limitations. First, significant statistical heterogeneity was observed in the results. Differences in types of patients enrolled, time points of cardiovascular assessment, follow-up durations, and number of subjects included might have played a role in the observed heterogeneity. Second, most of the included studies enrolled COVID-19 patients from the first wave only, and data from other variants is limited. Third, severely diseased COVID-19 patients had not been included in some studies. Moreover, in studies that included severe COVID-19 patients, they reported mixed data related to both hospitalized and ICU admitted patients, and there was no separate data for severe COVID-19 patients to reflect the full spectrum of severe and critical patients. Fourth, the follow-up period in all included studies varied between 1 month to 1 year, and a more extended follow-up period would be needed to provide more valuable information on the long-term cardiac consequences of COVID-19 infection. Finally, all included studies had no information on treatment with antivirals and interleukin-6 antagonists.
5 CONCLUSIONS
Recovered COVID-19 patients may exhibit cardiac dysfunction following resolution of COVID-19 infection. The prevalence of cardiac dysfunction was higher in patients with a history of ICU admission during the acute phase of the disease. We propose comprehensive surveillance with cardiac evaluations that could help stratify the risks of cardiac complications in recovered COVID-19 patients.
AUTHOR CONTRIBUTIONS
Masoud Rahmati and Jae Il Shin: developed the idea and designed the study and had full access to all data in the study and take responsibility for the integrity of the data and the accuracy of the data analysis. Masoud Rahmati and Ebrahim Banitalebi: ran the search strategy. Masoud Rahmati and Ebrahim Banitalebi: selected articles and extracted data. Masoud Rahmati: evaluated the quality of the literature. Masoud Rahmati, Ebrahim Banitalebi, Ai Koyanagi, Dong K Yon, Seung Won Lee, Jae Il Shin, and Lee Smith: wrote the manuscript. All listed authors reviewed and approved the final manuscript.
CONFLICT OF INTERESTS
The authors declare that there are no conflict of interests.
Open Research
DATA AVAILABILITY STATEMENT
All data relevant to the study are included in the article or uploaded as Supporting Information. The data are available by accessing the published studies listed in Table 1.


