Proteomics profiling of nontumor liver tissues identifies prognostic biomarkers in hepatitis B-related hepatocellular carcinoma
Abstract
Hepatocellular carcinoma (HCC) often occurs following chronic hepatitis B virus (HBV) infection, leading to high recurrence and a low 5-year survival rate. We developed an overall survival (OS) prediction model based on protein expression profiles in HBV-infected nontumor liver tissues. We aimed to demonstrate the feasibility of using protein expression profiles in nontumor liver tissues for survival prediction. A univariate Cox and differential expression analysis were performed to identify candidate prognostic factors. A multivariate Cox analysis was performed to develop the liver gene prognostic index (LGPI). The survival differences between the different risk groups in the training and validation cohorts were also estimated. A total of 363 patients, 159 in the training cohort, and 204 in the validation cohort were included. Of the 6478 proteins extracted from nontumor liver tissues, we identified 1275 proteins altered between HCC and nontumor liver tissues. A total of 1090 out of 6478 proteins were significantly related to OS. The prognostic values of the proteins in nontumor tissues were mostly positively related to those in the tumor tissues. Protective proteins were mainly enriched in the metabolism-related pathways. From the differentially expressed proteins, the top 10 most significant prognosis-related proteins were submitted for LGPI construction. In the training and validation cohorts, this LGPI showed a great ability for distinguishing patients' OS risk stratifications. After adjusting for clinicopathological features, the LGPI was an independent prognostic factor in the training and validation cohorts. We demonstrated the prognostic value of protein expression profiling in nontumor liver tissues. The proposed LGPI was a promising predictive model for estimating OS in HBV-related HCC.
1 INTRODUCTION
Liver cancer is the third leading cause of cancer-related deaths and an important barrier to increasing life expectancy worldwide.1 The 5-year survival rate of liver cancer is approximately 18%, and it is the second most lethal after pancreatic cancer.2 Hepatocellular carcinoma (HCC) is the predominant subtype of primary liver cancer, accounting for approximately 90% of all cases.3 The molecular pathogenesis of HCC varies, and chronic hepatitis B virus (HBV) infection is the leading cause of HCC.4 Although hepatic resection is one of the most effective approaches for curative treatment, HCC still has high recurrence and low 5-year survival rates.5 Therefore, identifying a reliable prognostic model that provides survival estimates is indispensable for selecting individualized treatment strategies.6 Over the last few decades, many prognostic models have been proposed to address the need for survival surveillance.7, 8
The comprehensive characterization of HCC samples has led to a better understanding of the molecular characteristics of HCC. For example, The Cancer Genome Atlas project, a next-generation sequencing-based study, uncovered multi-omics information of HCC.9 The Clinical Proteomic Tumor Analysis Consortium (CPTAC) project proposed a comprehensive proteomic analysis to identify key alterations and effective molecular biomarkers in HBV-related HCC.10 Furthermore, gene expression profiling-based models to predict the outcome of HCC have also been gradually used.6, 11 However, previous studies on HCC prognostic biomarker identification mainly focused on HCC itself, and the roles of molecular alterations in nontumor tissues in HCC prognosis W ignored. After hepatectomy, the remaining liver may also contribute to cancers due to the underlying liver disease. Hence, these nontumor tissues may also have a substantial impact on the prognosis of HCC.12
Here, we aimed to assess the prognostic value of proteins in HBV-infected nontumor liver tissues based on proteomic data. Two proteins related to overall survival (OS) were integrated into a gene signature for prognostic prediction. Our study provides a promising prognostic predictor that may benefit the clinical practice.
2 METHODS
2.1 Data collections
Quantified protein profiles of paired tumor and adjacent nontumor liver tissue samples from 159 patients were obtained from the CPTAC data set and used for the training cohort.10 Details of the proteomics analysis processes have been described in a previous study.10 Another publicly available study of an HCC cohort with gene expression profiles and clinical information was acquired from the NCBI GEO repository (accession number GSE14520, platform: GPL3921) used for the validation cohort.13 In the validation cohort, 445 samples with gene expression profiles were downloaded, including 225 tumor samples and 220 nontumor liver tissues. Finally, 204 nontumor liver tissues were included in our analysis, as 16 samples were without HBV infection or lacked clinical information about HBV infection status. This study of deidentified data was approved by the Institutional Review Board of the First Affiliated Hospital of Guangxi Medical University.
2.2 Proteome data analysis
In the training cohort, 6478 proteins without missing values were included in the analyses. The linear models for microarray data (LIMMA) package was used to select proteins that were altered between HCC and adjacent nontumor liver tissues according to the following criteria: a fold change >1.5 and false discovery rate <0.05.
2.3 Survival analysis and functional annotation
These 6478 proteins were also subjected to a univariate Cox analysis to identify the association between each protein and OS. Candidate protective proteins (hazard ratio [HR] < 1, p < 0.05) and risk proteins (HR > 1, p < 0.05) were subjected to enrichment analysis to obtain a biological understanding of these proteins. Gene enrichment analysis was conducted by the “clusterProfiler” package in R software.14 We used the enriched Kyoto Encyclopedia of Genes and Genomes function to identify the related pathways.
2.4 Development and validation of the LGPI
Differentially expressed proteins that ranked in the top 10 in the univariate survival analysis (ranking by p value) were subjected to the multivariate Cox analysis. LGPI was constructed according to the results of the multivariate Cox analysis and further normalized as a Z-score. The best cut-off was identified in the training cohort by using the “survminer” package in the R software and utilized to separate patients into different groups. LGPI was also calculated in the validation cohort according to the method used in the training cohort. Patients in the validation cohort were also divided into different groups based on the cutoff values obtained from the training cohort. Then, Kaplan–Meier estimator plots were generated to observe survival differences between the two groups.
2.5 Statistical analyses
All statistical analyses were conducted using R software (version 4.1.2; https://www.r-project.org/). A multivariate analysis was performed using the Cox proportional hazards regression model for factors significantly associated with OS in the univariate analyses. The R package “forestplot” was used to present the results of the subgroup analysis. The R package “survminer” was used to determine the optimal cut-off. Statistical significance was defined as p < 0.05.
3 RESULTS
3.1 Survival associated proteins in nontumor liver tissues
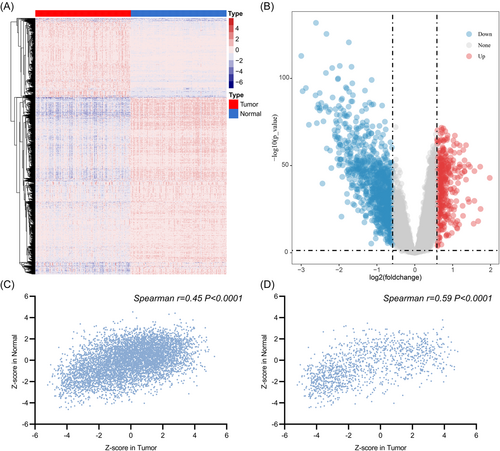
A total of 159 patients with HCC in the training cohort and 204 patients with HCC in the validation cohort were included in the analyses. The details of the characteristics are summarized in Table 1. The differential analysis identified 1275 proteins that were differentially expressed between HCC and paired nontumor liver tissues (Figure 1A,B). When compared with the nontumor liver tissues, 393 upregulated and 882 downregulated genes were identified in tumor tissues.
| Training cohort | Validation cohort | |
|---|---|---|
| Age, median (range), years | 54 (20–81) | 50 (21–77) |
| Sex | ||
| Female | 31 | 26 |
| Male | 128 | 178 |
| ALT( > / ≤ 50 U/L) | ||
| High | 47 | 83 |
| Low | 112 | 121 |
| Main tumor size (>/≤5 cm) | ||
| Large | 83 | 71 |
| Small | 76 | 132 |
| NA | - | 1 |
| Multinodular | ||
| Yes | 42 | 41 |
| No | 117 | 163 |
| Cirrhosis | ||
| Yes | 112 | 189 |
| No | 47 | 15 |
| TNM staging | ||
| I–II | 105 | 162 |
| III–IV | 54 | 42 |
| BCLC staging | ||
| 0 or A | 68 | 159 |
| B or C | 91 | 45 |
| AFP ( > / ≤300 ng/ml) | ||
| High | 61 | 91 |
| Low | 98 | 110 |
| NA | - | 3 |
- Abbreviations: AFP, alpha fetoprotein; ALT, alanine aminotransferase; BCLC, barcelona clinic liver cancer; TNM, tumor node metastasis.
The association of 6478 proteins with OS was also evaluated in the tumor and nontumor tissues. The univariate Cox analysis revealed 1090 prognosis-related proteins in nontumor liver tissues. Among these proteins, 456 were risk factors and 634 were protective factors; and 2211 protein expression levels in the tumor tissues were found to be related to OS, including 1045 as risk factors and 1166 as protective factors.
We also explored the prognostic values of each protein extracted from tumor and nontumor tissues. The Spearman correlation analysis for genes in 159 pairs of liver tumor and nontumor liver tissues showed that prognostic values in tumor and nontumor liver tissues were significantly correlated (Figure 1C). Similar correlations were observed for 1275 differentially expressed proteins (Figure 1D).
3.2 Functional enrichment for prognosis-related proteins
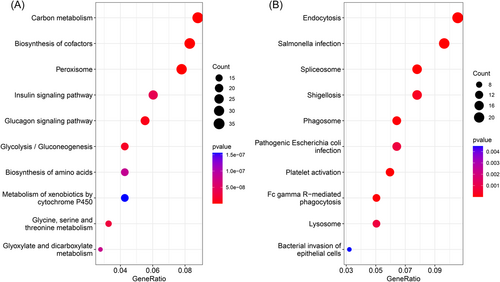
A total of 1090 prognosis-related proteins in nontumor liver tissues were subjected to a functional enrichment analysis. Protective proteins were mainly enriched in metabolism-related pathways. The top three most significantly enriched pathways were “carbon metabolism,” “biosynthesis of cofactors,” and “peroxisome” (Figure 2A). And the top three most significantly enriched pathways of risky proteins were “endocytosis,” “salmonella infection,” and “spliceosome” (Figure 2B).
3.3 Construction and definition of the LGPI
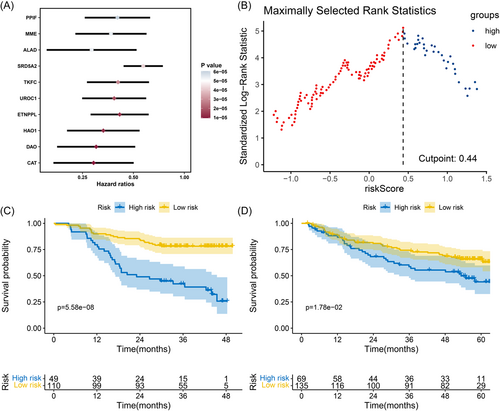
Of the 1275 differentially expressed proteins, 330 of the 1275 proteins in nontumor liver tissues were identified as prognostic proteins (p < 0.05). To prevent overfitting, the top 10 most significant proteins (according to p values) were further subjected to a multivariate Cox analysis (Figure 3A). We then constructed the LGPI consisting of two genes (DAO and MME) with the following formula: LGPI = (−0.87) × protein expression level of DAO + (−0.65) × protein expression level of MME. The LGPI was Z-score normalized for further analysis. The optimal cut-off point was identified as 0.44 (Figure 3B). Patients with HCC were divided into high- and low-risk subgroups based on the optimal cut-off points. In the training cohort, 49 patients were placed in the high-risk group, and 110 patients were placed in the low-risk group. A significant survival difference was observed between the high-and low-risk groups (HR = 3.877, 95% confidence interval [CI]: 2.127–7.066, Log-rank p < 0.001) (Figure 3C). In the validation cohort, we calculated the LGPI score for each patient based on the proposed formula. Then, the LGPI Z-score was normalized. Patients were divided into a high-risk group (n = 69) and a low-risk group (n = 135) based on the cut-offs identified in the training cohort. A significant survival rate difference was observed (HR = 1.706, 95% CI: 1.056–2.754; Log-rank p = 0.018) (Figure 3D).
3.4 Validation of the LGPI as an independent prognostic factor
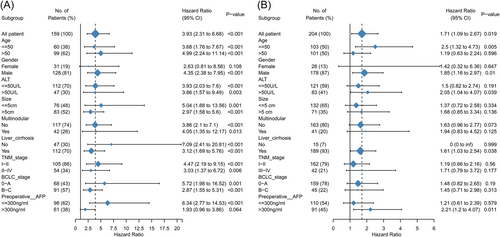
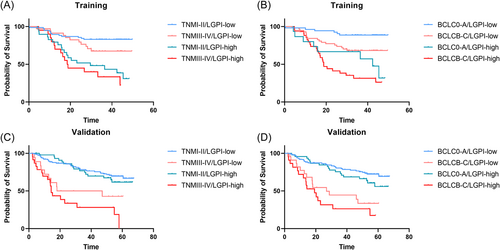
In the multivariate analyses, LGPI remained an independent prognostic factor in the training and validation cohorts. In the training cohort, LGPI was an independent prognostic factor after adjusting for clinicopathological factors (hazard ratio [HR] = 3.399, 95% confidence interval [CI]: 1.827–6.325; p < 0.001) (Table 2). In the validation cohort, LGPI was also an independent prognostic factor after adjusting for clinicopathological factors (HR = 1.689, 95% CI: 1.051–2.714; p = 0.030) (Table 2). We performed subgroup analyses to observe survival differences between the high- and low-risk groups when considering different clinicopathological parameters in the training (Figure 4A) and validation (Figure 4B) cohorts. To leverage clinical and molecular information, we also combined two HCC staging systems, tumor node metastasis (TNM) and Barcelona clinic liver cancer (BCLC), with LGPI group strategies (Figure 5).
| Parameters | Training cohort | Validation cohort | ||
|---|---|---|---|---|
| HR (95% CI) | p value | HR (95% CI) | p value | |
| Age | 0.96 (0.93–0.99) | 0.002 | 0.997 (0.974–1.021) | 0.811 |
| Sex (male/female) | 1.191 (0.611–2.325) | 0.608 | 1.444 (0.646–3.227) | 0.370 |
| ALT ( > / ≤ 50 U/L) | 1.326 (0.749–2.348) | 0.333 | 0.761 (0.466–1.240) | 0.273 |
| Main tumor size (>/≤5 cm) | 2.135 (0.870–5.239) | 0.098 | 0.603 (0.325–1.118) | 0.108 |
| Multinodular (yes/no) | 1.226 (0.499–3.015) | 0.657 | 0.487 (0.264–0.897) | 0.021 |
| Cirrhosis (yes/no) | 1.2623 (0.656–2.426) | 0.485 | 2.176 (0.515–9.190) | 0.290 |
| TNM staging (III-IV/I-II) | 0.737 (0.384–1.415) | 0.360 | 1.717 (1.144–2.579) | 0.009 |
| BCLC staging (B or C/0 or A) | 0.616 (0.115–3.304) | 0.705 | 2.210 (1.519–3.216) | <0.001 |
| AFP ( > / ≤300 ng/ml) | 1.932 (1.058–3.527) | 0.032 | 1.413 (0.879–2.271) | 0.154 |
| LGPI (high/low) | 3.399 (1.827–6.325) | <0.001 | 1.689 (1.051–2.714) | 0.030 |
- Note: Age, TNM staging, BCLC staging were coded as continuous variable. Specifically, TNM stage was coded as I = 1, II = 2, III = 3, IV = 4. BCLC staging was coded as 0 = 1, A = 2, B = 3, C = 4. The risk factors of sex, ALT, main tumor size, multinodular, cirrhosis, AFP and LGPI are male, >5 cm, yes, yes, >300 ng/ml and high-risk group.
- Abbreviations: AFP, alpha fetoprotein; ALT, alanine aminotransferase; BCLC, barcelona clinic liver cancer; LGPI, liver gene prognostic index; TNM, tumor node metastasis.
4 DISCUSSION
Patients with HCC are at risk of recurrence, even after undergoing a complete hepatectomy. Effective prognostic biomarkers are indispensable for determining patients with poor survival. Most previous studies on prognostic factor identification of HCC mainly focused on HCC itself but greatly downplayed the role of nontumor tissues. We developed a prognostic signature for HCC based on the expression levels of two proteins in nontumor liver tissues.
Many previous studies developed linear models to predict prognosis for patients with HCC.15, 16 For example, Wu et al. recently proposed a pyroptosis-related long noncoding gene signature for HCC, which could be used to predict the survival rate of patients with HCC.17 Fang et al. analyzed the significance of m6A RNA methylation regulators in HBV-related HCC and proposed a prognostic indicator based on their expression levels.18 However, the molecular prognostic value of adjacent nontumor liver tissues is less documented. Previous studies also have shown that molecular biomarkers in nontumor tissues are related to HCC progression, metastasis, and inferior survival rates.6, 19 HBV infection is a predominant risk factor for the onset and development of HCC. After resection, the presence of HBV continues to influence residual liver tissue, with the potential for recurrence. An hepatitis B surface antigen (HBsAg) level >200 IU/ml is an independent predictor of late recurrence, while an HBsAg level >50 IU/ml is an independent predictor of very late recurrence and late mortality.20 Therefore, the molecular profiles of HBV-related liver tissues may also have prognostic value. Gene expression profiles in HBV-related liver tissues should be explored further as guides for HCC prognosis.
We identified proteins in nontumor liver tissues that were related to OS for HCC. Although the number of proteins in nontumor tissues with prognostic value was lower than that in tumor tissues, there were significant positive relationships between the prognostic values of protein levels in tumor and nontumor tissues. Hence, genes in nontumor liver tissues may also actively participate in HCC prognosis. Functional enrichment analysis showed that protective proteins in the liver tissues were markedly enriched in several metabolism-related pathways. A previous study based on the Korean National Health Insurance Service database showed that metabolic risk factor burden was associated with an increased risk of HCC, non-HCC cancer, and all-cause mortality in patients with chronic hepatitis B.21 Our findings suggest that liver metabolism is the main cause of poor HCC prognosis. However, many problems regarding liver metabolism and HCC prognosis remain, which need to be resolved.
Notably, two proteins, DAO and MME, were included in the prognostic signature development. DAO is a gene that encodes the peroxisomal enzyme d-amino acid oxidase. The plasma DAO level is an independent factor for readmission for HBV-related recurrent hepatic encephalopathy. The high expression of DAO in HCC tissues has also been recognized as a protective factor.22 A previous study suggested that MME may be important in combination with hepatitis C virus-related HCC.23 However, the role of MME in HBV-associated HCC remains unclear. The LGPI was based on two proteins and showed moderate performance in the training and validation cohorts for OS prediction. Subgroup analyses showed that the prognostic value of LGPI in some subgroups of the validation cohort was not very good, which may be due to differences in basic characteristics between the training and validation cohorts. Future larger cohorts are needed to validate our results.
However, there are several limitations of this study. First, the retrospective nature of our study limited the prognostic value of LGPI. The LGPI could be further validated in a future prospective study. Second, although the gene functional enrichment analysis suggested that liver tissue metabolism status may be related to the prognosis of patients with HBV-related HCC, future in vivo or in vitro studies are needed for validation. Third, the validation cohort only provided gene expression in RNA levels rather than protein levels, and immunochemistry tests to validate our results are needed in the future. Furthermore, the complex nature and batch effects of different detection platforms should be noted.
In conclusion, the LGPI algorithm showed molecular factors in liver nontumor tissues have promising prognostic value for HCC. Moreover, it allows for a simple but accurate clinical description, and future prospective studies are needed to validate the prediction performance of the LGPI for HCC prognosis.
AUTHOR CONTRIBUTIONS
All authors fulfilled the ICMJE authorship criteria and agree to be accountable for all aspects of this study. Peng Lin participated in the study design, data acquisition, statistical analysis, data interpretation, and drafting of the manuscript. Dong-Yue Wen participated in statistical analysis, data interpretation, and drafting of the manuscript. Jin-Shu Pang participated in the statistical analysis, data interpretation, drafting of the manuscript. Wei Liao participated in statistical analysis, data interpretation, and drafting of the manuscript. Yu-Ji Chen participated in statistical analysis, data interpretation, and drafting of the manuscript. Yun He participated in study design, statistical analysis, data interpretation, and manuscript revision. Hong Yang participated in study design, statistical analysis, data interpretation, and manuscript revision. All authors approved the final version of the manuscript.
ACKNOWLEDGMENTS
The data used in this study were generated by the National Cancer Institute Clinical Proteomic Tumor Analysis Consortium (CPTAC) and the National Center for Biotechnology Information Gene Expression Omnibus (GEO) repository (accession number GSE14520). This study was supported by grants from the Innovation Project of Guangxi Graduate Education (YCBZ2022077) and Self-funded Scientific Research Project of the Guangxi Zhuang Autonomous Region Health Committee (Z20200396).
CONFLICTS OF INTEREST
The authors declare no conflicts of interest.
Open Research
DATA AVAILABILITY STATEMENT
The data that support the findings of this study are available from the public database, Clinical Proteomic Tumor Analysis Consortium (CPTAC), and the National Center for Biotechnology Information Gene Expression Omnibus (GEO) repository (accession number GSE14520).


