Spatiotemporal evolution, pattern of diffusion, and influencing factors of the COVID-19 epidemic in Hainan Province, China
Abstract
Within 1 month after the first case occurred in Hainan Province, China, the number of confirmed cases rose to 168, and there was no increase in almost 3 months. As the southernmost province and a famous tourist destination in China, its regular economic exchanges and high-intensity population movements may affect the spread of the epidemic. It is of great theoretical and practical significance to investigate the spatiotemporal evolution, the pattern of diffusion, and factors influencing the coronavirus disease 2019 (COVID-19) epidemic in Hainan Province. Basic and geographic information of confirmed COVID-19 cases was obtained from government websites and other official media. We examined the groups of infection and calculated the diffusion ratio to demonstrate the trend of the epidemic. Map drawing, spatial analysis, and partial least squares regression were used to express the spatiotemporal evolution, the pattern of diffusion, and factors affecting the epidemic. Furthermore, we have made recommendations on the formulation and adaptation of possible future preventive steps. Results show that the COVID-19 epidemic in Hainan Province has substantial spatial heterogeneity but minimal distribution. The tourist city and central city have formed a dual-core pattern for the spread of the epidemic, which could extend to other similar regions. Population density, mobility, and level of urban development have been the major factors of epidemic distribution in the study area.
Highlights
-
A diffusion ratio was used to measure the intensity of the spread.
-
A duel-core model of the COVID-19 diffusion was identified, which may apply to other regions.
-
Economic factors played a significant role in COVID-19 spread in Hainan Province.
Abbreviations
-
- COVID-19
-
- coronavirus disease 2019
-
- WHO
-
- World Health Organization
1 INTRODUCTION
The coronavirus disease 2019 (COVID-19) outbreak has evolved into a pandemic that threatens social security and public health and has become a focal and pain point of global concern.1, 2 Suppression and reduction of the epidemic have become the dominant theme of human life at the beginning of the 2020s. Up to 28 October 2021, more than 245 million laboratory-confirmed cases have been recorded worldwide as stated by the World Health Organization (WHO). The USA, India, Brazil, the UK, Russia, as well as other countries, have become the new core areas of COVID-19, and the epidemic continues to spread still rapidly. At present, the global spread has not been fully suppressed, and the prevention situation is grim. China's epidemic prevention has achieved important results in phases, and the economy and society are accelerating their recovery.3 At this critical stage, it is important to guard against the importation of confirmed cases overseas and the recurrence of the internal epidemic. Data from the National Health Commission of the People's Republic of China (http://www.nhc.gov.cn/) showed that there were a total of 125 738 confirmed cases and 5696 deaths in China by October 28, 2021. China's progress in preventing epidemics is obvious to all and provides a “Chinese model” for humanity to respond jointly to COVID-19.
Hainan is the second largest island in China, also a special economic zone, a free trade zone, and a famous tourist attraction. As of February 1, 2021, Hainan Province has reported 171 confirmed cases, ranking 27th in the country, with an epidemic density of 49.11 cases per 10 000 km2, and an infection rate of 0.18 cases per 10 000 people. There are currently no new unhealed cases. First, Hainan is close to Guangdong Province, a region with a high incidence of epidemics in China. It is important to examine the spatiotemporal evolution of the epidemic in this region to investigate the spread at the provincial level. Second, the unique geographic location of Hainan Province shows its preventive policies for other regions. Therefore, this article uses text analysis, spatial analysis, and partial least squares regression to explain the demographic characteristics of the confirmed cases in Hainan Province and to examine the spatiotemporal evolution, pattern of diffusion, and influencing factors of the COVID-19 epidemic in Hainan Province.
2 METHODS
2.1 Data collection
This study study selected Hainan Province as the study area, and the secondary data were obtained from various data sources such as (1) spatial data: vector administrative boundaries, derived from the 1:1 000 000 which are provided by the National Geomatics Center of China (http://www.ngcc.cn/ngcc/); (2) aspatial data: statistics, derived from Hainan Statistical Yearbook 2018 (http://www.hainan.gov.cn/hn/zwgk/tjdc/hnnj/); (3) epidemic data: collected from the Hainan Health and Wellness Committee website and its WeChat public account and other official media reports on the epidemic situation in the study area. As of 30 October 2020, the detailed information of 171 confirmed cases was obtained through the manual interpretation and collection methods (Table 1), including demographic information such as age and gender and spatial information like activity trajectory (Within 1 month of the outbreak, the number of confirmed cases rose to 168, and the 169th, 170th, 171st patients did not appear until May 15, 2020. Therefore, this study does not include these three confirmed cases.).
| Age range in years | 0–79 |
|---|---|
| Average age in years | 48.4 |
| Median age in years | 51 |
| Age group in years | |
| A < 18% | 8 (4.7) |
| B 18%–40% | 52 (31.0) |
| C 41%–65% | 83 (49.4) |
| D > 65% | 25 (14.9) |
| Sex | |
| Female % | 86 (51.2) |
| Male % | 82 (48.8) |
| Long-term work or life in Wuhan City (imported cases) | 113 (67.3) |
| Direct or indirect exposure to people from Wuhan City (transitioned cases) | 43 (25.6) |
| internal diffusion (diffuse cases) | 12 (7.1) |
- Note: The numbers in parentheses represent percentages.
2.2 Study area
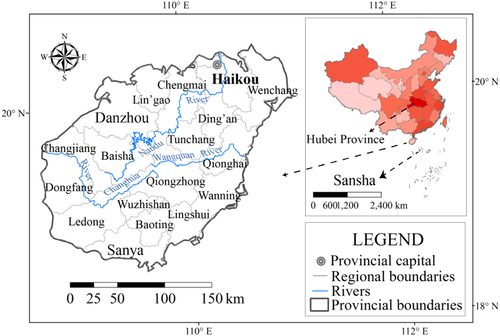
Hainan Province is located in South China (Figure 1), which borders Guangdong across the Qiongzhou Strait in the north, Guangxi Province and Vietnam across the Beibu Gulf in the west, Taiwan across the South China Sea in the east, and Malaysia, the Philippines and other countries in the south. It governs the followings: four prefecture-level cities, Haikou City, Sansha City, Sanya City, and Danzhou City; five county-level cities; Wuzhishan, Wenchang, Qionghai, Wanning and Dongfang, four counties; Ding'an, Tunchang, Chengmai, and Lin'gao Baisha, six ethnic autonomous counties; Changjiang, Ledong, Lingshui, Baoting, Baisha and Qiongzhong; and the islands and sea areas of the Xisha Islands, Nansha Islands, and Zhongsha Islands. The total land area is 35 000 km2, and the sea area is approximately 2 million km2. The topography of Hainan Province is high in the middle, low and flat in the surrounding, and mostly mountainous. The climate there is a tropical marine monsoon climate, with warm and abundant rainfall throughout the year. The average annual temperature is 22–27°C, and the annual rainfall is about 1000–2600 mm. The vegetation is mainly tropical arbors and shrubs.
2.3 Data analysis
Text analysis: Text analysis quantifies information by extracting the features of language, words, images, or other media. This study was used the manual interpretation of cases to extract age, gender, activity trajectory, and other information to provide a data basis for further analysis.
Spatial autocorrelation analysis: Global Moran's I, an important indicator to measure spatial correlation, was used to measure the strength of the spatial autocorrelation of the epidemic in this article. This parameter is often used to identify whether spatial phenomena are dispersed, random, or clustered.
Kernel density: By dividing the high, middle, and low-value areas to represent the distribution characteristics of geographical events in space, and the core area of the epidemic can be presented.
Partial least squares regression (PLS): Based on multiple regression and principal component regression, PLS regression has strong explanatory power for the causes of complex phenomena. It makes up for the deficiency of least squares, and variable importance in the projection (VIP) is the core indicator to reflect the strength of correlation.
In addition, this article used Excel 2019 for data sorting and preprocessing, ArcGIS 10.3 for epidemic mapping and spatial analysis, SPSS 25.0 for data analysis, and OriginLab 2018 for figures.
3 RESULTS
3.1 Demographic characteristics
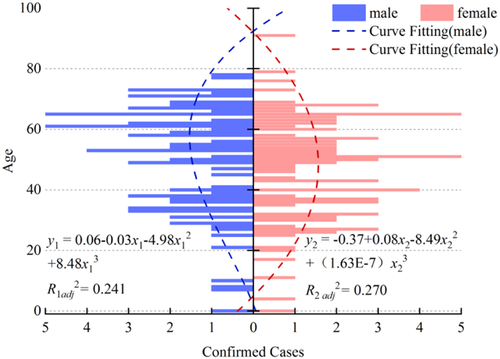
In terms of gender, confirmed cases in Hainan Province depicted a gender-balanced distribution (Figure 2) with 82 male cases and 86 female cases. The polynomial fitting results revealed that the differences in the age structure of confirmed cases in different genders. The age structure of female diagnosed cases was approximately normal, with a median age of 50 years and an average age of 47.4 years. The age structure of males showed a negatively skewed distribution, with a median age of 54 years and an average age of 50.3 years, slightly higher than the women group. The multiple regression equation for male was y1 = 0.06 − 0.03x1 − 4.98x12 + 8.84x13 (R1adj2 = 0.241), and the multiple regression equation for female was y2 = −0.37 − 0.08x2 − 8.49x22 + (1.63E−7) x23 (R2adj2 = 0.270). The age of the confirmed cases was concentrated between 30 and 65 years (105 cases), accounting for 62.5% of the total. Overall, most of the confirmed cases in Hainan Province were middle-aged (41–65 years; 49.4%) and young adults (18–40 years; 31.0%), elderly (66 years; 14.9%) and adolescents (17%), and younger (4.7%), consistent with the age characteristics of confirmed cases nationwide.4 The middle-aged and young people are the main groups with social mobility. The characteristics of frequent social activities and outdoor life, as well as the long outdoor exposure time, make them vulnerable to infection.
3.2 Temporal process
Since January 23, 2020, the Hainan Health and Wellness Committee reported the first imported case in the study area, and then the number of confirmed cases has increased gradually. There were 18 confirmed cases detected on January 27, 2020, and it is the highest number on a single day so far (Figure 3A). The number of confirmed cases in the next few days has gradually declined. However, this number increased rapidly again in the next 10 days, reaching the second-highest peak with 12 cases on February 12. As of February 12, the average number of daily confirmed cases was 7.48. Within approximately 10 days after the first imported case, the cumulative number of cured cases was small, and it rose rapidly after February 6. These two curves of the cumulative number of cured cases and confirmed cases form an approximately closed, centrally symmetric “lip” structure. Presently, the COVID-19 epidemic in Hainan Province has reported six deaths, with a mortality rate of 3.57%. The polynomial fitting results showed that the number of daily confirmed cases was a trend of “burst growth followed by slow decline.”
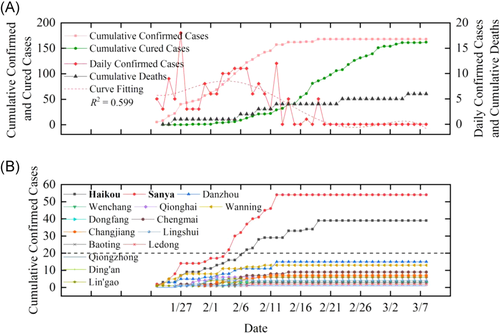
The distribution of confirmed cases in various regions of Hainan Province has shown in two levels (Figure 3B) (level 1, more than 20 cases; level 2, less than 20 cases). Sanya City and Haikou City were located in level 1, with 54 and 39 cases, respectively; the cumulative number of confirmed cases in other regions was less than 20 cases. As a well-known tourist city, the external import is the main reason for the high incidence of the epidemic in Sanya City and was more serious in the early stage than in other regions. By contrast, as the largest city and most populous city in Hainan Province, the number of confirmed cases in Haikou City has grown slowly, and it was notably higher than the other regions until early February. With the rising number of cured cases, the epidemic has been gradually controlled. Overall, the COVID-19 epidemic in Hainan Province showed a “burst growth followed by slow decline” in terms of time.
3.3 Infection groups and their evolution
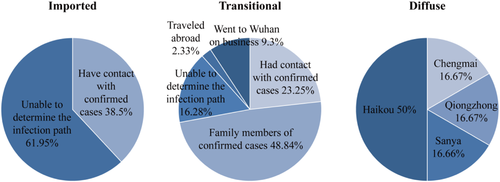
Wuhan City, Hubei Province is the most severe area of the COVID-19 epidemic in China, and the epidemic in other surrounding provinces could be related to Wuhan City. We manually interpreted the infection history and activity trajectory of the confirmed COVID-19 cases in Hainan Province and divided them into three infection groups: confirmed cases who worked and lived long-term in Wuhan City or other cities in Hubei Province as imported patients (Group 1), Nearly 40% of the imported patients can trace the infection trajectory in Wuhan City or other cities in Hubei Province (Figure 4, Imported), More than 60% of imported patients lived in this area, but how they were infected remains unclear. Confirmed cases who had direct contact with imported infected persons or who had short-term trips to Wuhan City before and after the epidemic were defined as transitional patients (Group 2). Among them, nearly half were infected by family members (Figure 4, Transitional). Contact with confirmed cases and traveling to Wuhan City were also two routes of infection. Confirmed cases without a history of residence in Wuhan City and those who could not be identified as transitional patients were defined as diffuse patients (Group 3), and half of these patients live in Haikou City, the largest city on this island (Figure 4 Diffuse).
The confirmed cases in Hainan Province were mainly external imported cases (Figure 5A), with 113 cases, accounting for 67.3% of the total; the number of 43 cases were mixed transitional, accounting for 25.6%; internal diffuse cases were fewer, a total of 12 cases, accounting for 7.1%. Due to untimely epidemic prevention, the number of external imported cases in a short period rose rapidly, reaching a peak of 17 cases on January 27, 2020 and reaching 10% of the total on this single day. From January 28 to February 12, the number of external imported cases increased first and then decreased, with an average of 4.2 confirmed cases daily, and then entered the stage of prevention. External imported cases decreased significantly from February 13 to 19 and five cases were confirmed. Mixed transitional cases were concentrated from February 4 to 12, 2020; 33 cases were confirmed during this period, accounting for 76.7% of this type and 19.5% of the total number of confirmed cases. Internal diffuse cases were concentrated from February 7 to 14; nine cases were confirmed during this period, accounting for 75% of this type and 5.3% of the total.
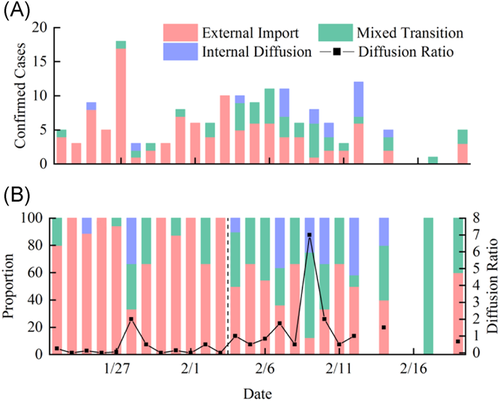
Judging from the changes in the proportion of the three types of cases (Figure 5B), external imported cases primarily comprised the confirmed cases from January 23 to February 3, accounting for 88.5%. This number gradually declined, accounting for 48.9% from February 4 to 19. The proportion of mixed transitional cases has gradually increased, accounting for 9.2% of the total before February 3, and rose to 40.0% from February 4 to 19. With the active development of epidemic prevention and control, although the proportion of internal diffuse cases has increased, the number has gradually decreased.
In this paper, we used the diffusion ratio to measure the spread of the epidemic (diffusion ratio = (mixed transition cases + internal diffuse cases)/external imported cases). The diffusion ratio of COVID-19 in Hainan Province reached the first extreme value of 2.0 on January 28, indicating that an imported case can infect two patients. The diffusion ratio was at a low value from January 29 to February 3, with an average value of approximately 0.3. The diffusion ratio gradually increased after February 4 and reached a maximum value of 7 on February 9, the number of transitional cases and internal diffuse cases was seven times that imported cases in a single day. After that, the diffusion ratio has dropped rapidly, with an average value of 1.56 from February 4 to 19. Thus, COVID-19 in Hainan Province was in the stage of external import before February 3 and began to spread after February 4. However, due to the implementation of prevention and control policies, the number of confirmed cases per day has gradually decreased, indicating that the COVID-19 epidemic in Hainan Province was dominated by external imported infections and had limited internal spread.
3.4 Spatial distribution
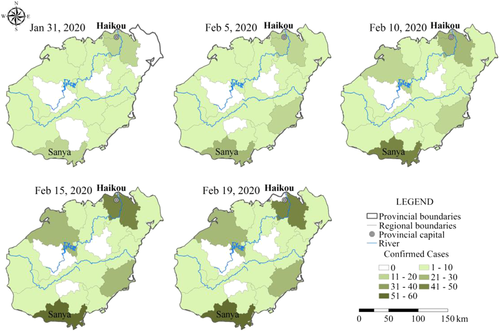
The outbreak of COVID-19 in Hainan Province began with three confirmed cases on January 23. A week later, by the last day of January, the whole island had already experienced outbreaks in all but the five regions of Wenchang, Baisha, Tunchang, Wuzhishan, and Baoting, (Figure 6 January 31, 2020). As of February 5, the number of confirmed cases in Sanya City has gradually surpassed that in other regions, reaching 30 cases, followed by 16 cases in Haikou City, and the remaining uninfected areas comprise only three central regions (Figure 6 February 5, 2020). As of February 10, the epidemic in Sanya City and Haikou City has been significantly more serious than that in other regions. The confirmed cases in these two cities accounted for 52.1% of the province, especially in Sanya City, with 45 cases, accounting for 32%. In addition, the number of confirmed cases in Danzhou and Wanning gradually increased, reaching 11 and 13 cases, respectively (Figure 6 February 10, 2020). Moreover, the spatial distribution pattern of the epidemic in Hainan Province has gradually formed. In the subsequent 10 days, 26 new cases were added across the whole island, mostly in Sanya City (6 new cases) and Haikou City (9 new cases), with no effect on the overall pattern. Within about a month of the outbreak, Sanya City and Haikou City were the regions with more confirmed cases and faster growth. The four regions of Sanya City, Haikou City, Danzhou City, and Wanning City constituted an approximate cross-shaped spatial distribution pattern. Regardless of the number of confirmed cases or diffusion ratio, the factors influencing the more serious epidemic situations in the coastal areas could be the following: First, the diffusion has developed from the edge to the middle. The timely implementation of policies has effectively prevented the spread of the epidemic. Second, the central part of the island is mostly mountainous with inconvenient transportation and a sparse population, slowing the outbreak.
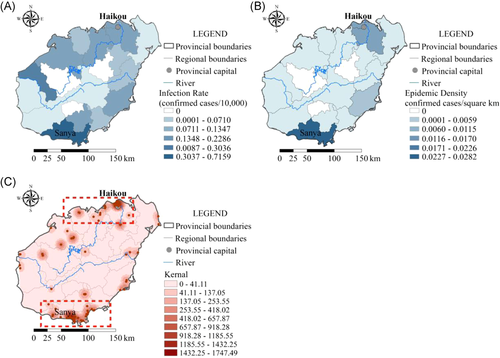
The current distribution of confirmed cases shows that the epidemic situation is very serious at the north and south ends of the Hainan Province (Sanya City and Haikou City). The coastal areas were all affected, and the central region was less affected. The results of Spatial Autocorrelation Analysis showed that Moran's I was 0.396, p was 0.005, and Zscore was 2.795, indicating the high spatial autocorrelation and significant clustering effect. The infection rate distribution (Figure 7A) showed that Sanya City had the highest infection rate, with 0.72 cases per 10 000 people, which was more than twice that of Changjiang with the second-highest infection rate (0.30 cases per 10 000 people). In general, the infection rate in coastal areas was significantly higher than in the central areas. The density of confirmed cases (Figure 7B) showed that Sanya City and Haikou City were the areas with the highest epidemic density on the island, those were 0.028 cases/km2 and 0.017 cases/km2, respectively. The distribution density in other areas was small and scattered. Kernel analysis was conducted using collected ground truths of the confirmed cases (Figure 7C), and the results showed that the confirmed cases were mainly aggregated in the north and south borders of this island, namely, Haikou city and Sanya City, and the epidemic in coastal areas was more serious than the central mountainous areas. The above results show that there is an obvious spatial correlation and spatial agglomeration in the COVID-19 distribution.
3.5 Pattern of diffusion
The diffusion in the north of Hainan Province was higher than in the south (Figure 8A), especially in Haikou City, with the highest diffusion ratio on the whole island. Therefore, one imported case can infect more than one local person. The diffusion ratio of the northern coastal areas was significantly higher than the other areas, and the diffusion ratios of Haikou City, Danzhou City, and Wenchang City were exceeded from 0.5. Qiongzhong, Changjiang, and Baoting (shaded areas) had only diffuse cases, and no imported cases were found, indicating that the movement of people on the island promoted the spread of the epidemic. Currently, there are no confirmed cases in some areas of the central region (blank areas), so the diffusion ratio in these areas was 0. The cumulative diffusion ratio of various regions on the island (Figure 8B) showed that, although Sanya City had the most imported cases, the local diffusion in Sanya City was not significant.
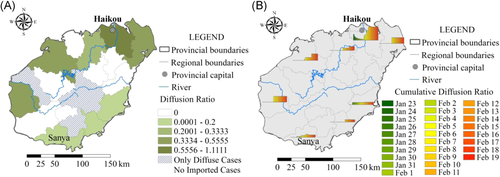
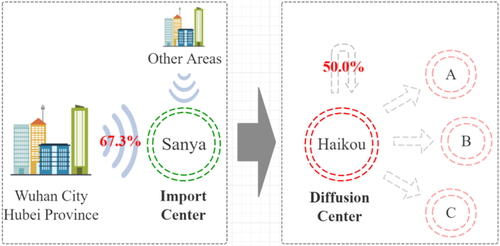
Since February, as the largest city of Hainan Province, the diffusion in Haikou City has increased significantly, and eventually has become the epidemic diffuse center, while Sanya City was the epidemic import center in Hainan Province. Among the confirmed cases in Hainan Province, 67.3% had lived or worked in Wuhan or other areas of Hubei Province for a long time, and 25.6% had short-term travel to Wuhan or had direct contact with confirmed cases returned from Hubei Province. More than half of the patients in these two groups were detected in Sanya City. The tourism industry in Sanya city is very developed and this has caused to increase the import risk of confirmed cases and inevitably became the import center (67.3% of imported cases were detected in Sanya City). As the largest city and transportation center in Hainan Province, Haikou's diffusion ratio has increased rapidly in the latter half of the period and became the epidemic diffusion center (50.0% of diffuse cases were detected in Haikou City.). These two cities constitute a dual-core model for the spread of the epidemic in Hainan Province (Figure 9). This diffusion model may apply to some countries or regions with similar geographical characteristics as Hainan Province. Generally, tourist cities with a large number of migrant populations provide a channel for the entry of the confirmed cases, while the capital or the central city as a transportation hub provides a diffusion path for spreading the epidemic.
Similar patterns of distribution can be identified in Pakistan, where the first confirmed case occurred in the port city of Karachi on February 26 and has since spread across the country, and most of the imported cases came from its neighbors, Iran and China.5 When the epidemic spread to Spain, Barcelona became the import center, and a few months later, the tourist destination of Catalonia and the transport hub of Madrid were the worst-affected areas in Spain. By the end of October, more than a million cases had been diagnosed in Spain, prompting the government to reimpose a state of emergency and a curfew.6 The spread in France has the same characteristics, with Provence and Paris being the most affected regions in France. Marseille, the capital of Provence and France's largest Mediterranean port, was seriously affected in the early days of the outbreak.7 But when the most popular tourist city is also its transport hub, the first city to suffer an outbreak is also the worst one. On January 22, 2020, the first confirmed case in Thailand was detected in Bangkok, which now accounts for about half of the total and was the worst affected region in Thailand.8 Hainan Province contained the outbreak and resumed production within two months, so regions with similar patterns of spread can learn from the experience.
3.6 Influencing factors
The preceding period of the epidemic in Hainan Province was an import period, where the severity was determined by the size and distribution of imported cases. In the later period, internal diffusion was gradually strengthened, which was affected by multiple factors such as density and mobility of the population, economic development, and transportation between various regions. Therefore, the number of confirmed cases in regions was selected as the dependent variable. Based on data availability and regional characteristics, population size, population density, the proportion of males, the proportion of the urban population, and the proportion of population aged 15–64 were selected to represent demographic characteristics. Gross domestic product (GDP) and the proportion of tertiary industry were selected to represent the economic development and industrial structure. The number of tourists overnight staying indicates the level of tourism. The number of medical beds indicates the level of medical care in different regions (Table 2).
| Category | Num. | Factor | Unit | Pearson correlation coefficient (p) with number of confirmed cases |
|---|---|---|---|---|
| Population | 1 | Population size | 10 000 | 0.679** |
| 2 | Population density | 10 000/km2 | 0.685** | |
| 3 | Male | Percent | 0.629** | |
| 4 | Urban population | Percent | 0.852*** | |
| 5 | Population aged 25~64 | Percent | −0.478* | |
| Economic and industry | 6 | GDP | 10 000 RMB | 0.758*** |
| 7 | Tertiary industry | Percent | 0.662** | |
| Tourism | 8 | Tourists overnight staying | 10 000 | 0.971*** |
| Medical treatment | 9 | Medical beds | / | 0.658** |
- Abbreviation: COVID-19, coronavirus disease 2019; GDP, gross domestic product.
- * p < 0.05
- ** p < 0.01
- *** p < 0.001.
According to the correlation results, the distribution of confirmed cases in Hainan Province has shown a positive significant correlation with the urban population ratio, GDP, and the number of tourists overnight staying in each region (p < 0.001). Additionally, the more densely populated region, the more severe outbreak (p < 0.01), consistent with the transmission characteristics of epidemic diseases. On the economic side, the epidemic was more severe in areas with income levels (p < 0.001), which is related to population size, density, development, and other factors. The more tourists overnight staying, the severer the epidemic (p < 0.001), reflecting the promotion effect of a connection between regions and population mobility on the epidemic.
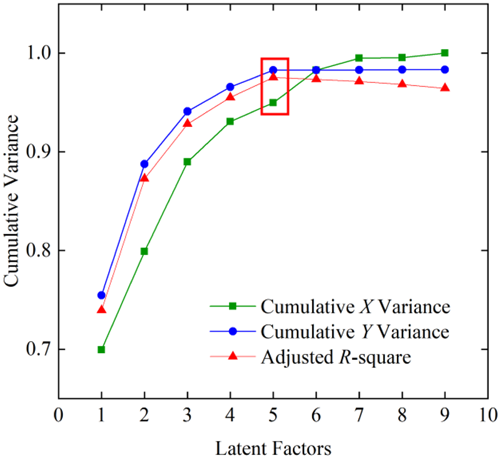
Partial Least Squares regression analyzed the relationship between the number of confirmed cases and nine influencing factors. Results (Figure 10) (Table 3) indicated that the first five potential factors have strong explanatory power for the dependent variables (Radj2 = 0.975). In detail, there were two potential factors in which VIP values were greater than 1, namely the proportion of the urban population (VIP = 1.195) and the number of overnight tourists (VIP = 1.542), which were essential variables affecting the epidemic distribution in Hainan Province. The VIP values of GDP and the number of medical beds were greater than 0.9, suggesting that these factors also influence the distribution of confirmed cases to a certain extent. The VIP contribution values of other factors were all less than 0.9, indicating that they were not important factors.
| Factor | Regression coefficient | The VIP value of the potential factor | ||||
|---|---|---|---|---|---|---|
| 1 | 2 | 3 | 4 | 5 | ||
| Population size | 0.032 | 0.942 | 0.920 | 0.894 | 0.883 | 0.887 |
| Population density | 23.305 | 0.952 | 0.942 | 0.915 | 0.904 | 0.896 |
| Male % | 184.718 | 0.663 | 0.634 | 0.815 | 0.805 | 0.802 |
| Urban population % | 8.530 | 1.183 | 1.183 | 1.172 | 1.172 | 1.195 |
| 15–64 years old % | −0.403 | 0.874 | 0.872 | 0.894 | 0.920 | 0.912 |
| GDP | 7.045E−07 | 1.053 | 0.979 | 0.956 | 0.944 | 0.940 |
| Tertiary industry % | 0.028 | 0.919 | 0.855 | 0.841 | 0.845 | 0.856 |
| Overnight visitors | 2.949E−06 | 1.348 | 1.453 | 1.502 | 1.529 | 1.542 |
| Medical beds | 0.005 | 0.914 | 0.963 | 0.952 | 0.949 | 0.951 |
As China's most distinctive tropical tourist destination, Hainan attracts more than 70 million tourists every year, and tourism has become a pillar industry here, which has contributed a lot to the development. In 2018, tourism revenue in Hainan exceeded 95 billion (Yuan), accounting for 8.1% of GDP, and is rising year by year. In the first 2 months of 2020, Hainan received 4.3671 million tourist visits, of which more than 46% went to Sanya. In January, in particular, Sanya received 2.198 million visitors, and this figure dropped to 157 thousand in February as a result of nationwide epidemic prevention. The outbreak in early 2020 coincided with the Chinese Lunar New Year, and frequent population movements caused by the influx of tourists from all over the world significantly contributed to the spread of the epidemic.
The cities of Hainan Province are mainly distributed in the coastal areas, especially the northern and southern ends, and the central part of the island is mostly mountainous. So far, there have been no cases of infection in several central regions. Cities have a higher population density than the countryside, and there have a greater range of human activities and more frequent contacts. Crowded places such as shopping malls, supermarkets, stations, and airports provide conditions for the epidemic transmission of person to person. On the other hand, population size and density are also positively correlated with the number of confirmed cases. GDP and the number of medical beds respectively represent economic and medical levels and also reflect urban development. Overall, tourism was the main reason for the importation of the epidemic, and population density, mobility, and urban development were the key factors affecting the distribution of the epidemic in Hainan Province.
China has experienced SARS in 2003 and MERS in 2012 of the coronavirus outbreaks, providing invaluable experience for the current COVID-19 epidemic control.9 Notably, the contradiction now is that faster information transmission has improved the efficiency of policy implementation, but the increase in the frequency and range of activities between people has strengthened in the time of epidemic distribution. The rapid decision-making of the government and rapid response of all sectors of society are the main reasons for the control of the epidemic in China. China's epidemic prevention has achieved tremendous achievements, for which it has paid a painful price.10 The number of daily confirmed cases in Hubei Province, the most severe province in China, has dropped to 0, indicating that China's epidemic prevention is nearing completion. Nonetheless, in the face of the grim situation of epidemic development worldwide, the normalization of epidemic prevention policies is crucial. Restoring social order and economic development based on preventing the import of overseas cases and the rebound of the domestic epidemic situation is the current main task for the Chinese government.
Hainan is close to Guangdong Province, where the epidemic is more severe (cumulative cases: 3217, as of October 28, 2020, ranked fourth only to Hubei, Taiwan, and Hongkong) (http://www.nhc.gov.cn/), placing high demands on the epidemic prevention work of the island. The cumulative number of confirmed cases in Hainan Province ranks 29th in this country, and it is one of the regions with relatively stable epidemic control. The fatality of patients infected by COVID-19 in Hainan Province was 3.6%, significantly higher than the whole national average level and that in other provinces, mainly due to the difference in the number of confirmed cases. The special geographic location makes its epidemic control work of reference value for many countries.
Preventing a rebound of the epidemic in the post-epidemic period is crucial. Therefore, we propose to further contain and eliminate the epidemic from the following aspects. First, real-time, daily monitoring should be implemented in time. Emphasis should be placed on monitoring the gathering places of people with high mobility, such as communities and enterprises. Additionally, the health status and travel information of each resident and employee should be recorded and updated on time. At present, the spread of the epidemic globally persists, and the entry of confirmed cases abroad should be avoided, especially in tourist destinations and border zones (e.g., Hainan). The government can provide corresponding assistance to those former patients and their families to alleviate their psychological and life pressures. Furthermore, the government can focus on the progress of epidemic prevention in various regions, as well as optimize and adjust strategies promptly according to the actual situation. Second, in terms of space, prevention work should be continuously refined according to different levels such as community, county, and city, to ensure higher efficiency. On the community scale, management departments should keep abreast of the health status and living needs of each household resident, which can be done through a health brochure or register. Additionally, the public space of the community should be periodically disinfected and inspected. Online work and communication can be used to reduce crowd contact and avoid crowd formation. Regarding shopping malls and other public places that have resumed, normal safety inspections should be conducted, and the latest epidemic situation needs to be reported on time. If there are new confirmed cases, the distribution of social resources should be adjusted in a timely, and under the premise of preventing further spread, to ensure that patients can be quickly treated. Humans are the core carriers of virus transmission and the spread of the epidemic and are the key to eliminating the virus and preventing and controlling the epidemic. Therefore, in this critical period, for everyone, regulating individual behavior is the most basic but also crucial for epidemic prevention. The regulation of individual behavior depends on the strength of epidemic prevention awareness and effective supervision of all social departments. The media platform can disseminate the epidemic situation, policies, and regulations through publicity methods to improve the efficiency of the individual's timely access to information.
The demographic characteristics of 168 confirmed cases in Hainan Province were consistent with the statistical results of other regions in China.11 There is no specific regional directivity in this epidemic, and patients in all regions have consistent gender and age characteristics.4 The outbreak in Hainan Province lasted about a month, consistent with the remaining provinces of China except for the Hubei Province. However, the current situation in Hubei has improved with no uncured cases remaining (http://www.nhc.gov.cn/). The most southern city in China, Sanya City, where millions of tourists flock every year, has led to foreign patients entering the island at the beginning of the outbreak.
The outbreak of COVID-19 in the early 2020s exceeded the boundaries of countries and continents and became a pandemic affecting human health and social development. China has actively and quickly implemented policies to effectively prevent the spread of the epidemic, providing much experience for other regions that are conservatively affected by the outbreak. Generally speaking, it is important to restrain population access in the import center and the population mobility in the diffusion center.12
4 CONCLUSIONS
Based on the basic information and spatiotemporal trajectory of confirmed cases reported by official media, this article used text analysis, spatial analysis, and Partial Least Squares regression to clarify the demographic characteristics, spatiotemporal evolution, the pattern of diffusion, and influencing factors of the COVID-19 epidemic in the Hainan Province, and provides suggestions on prevention policies based on the current epidemic situation. The main conclusions are as follows: (1) The gender distribution of confirmed cases is balanced without obvious gender preference. Middle-aged and young adults are the main groups, exceeding 80% of the total. (2) The development of the COVID-19 epidemic has shown the trend of “burst growth followed by slow decline.” The spatial heterogeneity of epidemic distribution was significant, the coastal areas, especially the north and south ends, were the severe areas in the islands. (3) The confirmed cases in Hainan Province were mainly imported cases, and the diffusion was relatively limited on this island. Sanya City was the import center of confirmed cases, and Haikou City was the diffusion center, which two constituted a dual-core spread model of the COVID-19 epidemic. (4) The number of confirmed cases was significant to the economic factors, namely the number of tourists overnight staying and the proportion of the urban population. Population density, mobility, and level of urban development are the major factors in the spread of the epidemic. (5) The previous prevention policies have achieved remarkable results. In the future, strategies should be continuously adjusted according to the variability of the epidemic, and work efficiency can be improved at all levels of government, community, and individuals.
ACKNOWLEGDMENTS
Thank you to all institutions and people who have worked hard to prevent the COVID-19 epidemic. Guide Fund for Emergency Research on COVID-19, Northwest University.
CONFLICT OF INTERESTS
The authors declare that there are no conflict of interests.
AUTHOR CONTRIBUTIONS
Gang Li designed the study. Xing Gao wrote and revised the paper. Jiaobei Wang and Tingting Xu helped analyze the data.
Open Research
DATA AVAILABILITY STATEMENT
All the data supporting the findings are collected from official websites (National Health Commission of the People's Republic of China, http://www.nhc.gov.cv; Health Commission of Hainan Province, http://wst.hainan.gov.cn).


