Natural course of persistent hepatitis B virus infection in hepatitis B e antigen-positive and hepatitis B e antigen-negative cohorts in Japan based on the Markov model
Abstract
This population-based study examined the natural course of hepatitis B e antigen (HBeAg)-positive or HBeAg-negative persistent hepatitis B virus (HBV) infection, adjusted by age and liver disease states using a Markov model. Using 12 417 person-years data (n = 862), annual transition probabilities were estimated, and age-adjusted cumulative incidence and natural history of persistent HBV infection were simulated in both sexes of groups 1 (HBeAg-negative status with HBV DNA level <4.0 log IU/mL at entry) and 2 (persistent HBeAg-positive status throughout the study). In group 1, 15.26% of 30-years old men with chronic hepatitis (CH) were expected to remain in the same state at age 65 years, 28.32% subsided into an hepatitis B surface antigen (HBsAg)-negative state, and 13.20% developed hepatocellular carcinoma (HCC). The expectations for 40-years old men in group 1 were 21.43%, 19.86%, and 15.04%, respectively. The expectations for 30 years women in group 1 were 30.57%, 21.15%, and 4.08%, respectively. These results suggest that HBeAg positivity caused a higher risk of HCC onset in persistent HBV infection after adjustments for age, sex, and liver disease state. HCC was likely to develop, but unlikely to subside into HBsAg clearance, remaining in a CH state with aging, regardless of HBeAg state. Furthermore, both HCC development and HBsAg clearance occurred more frequently in men than in women, irrespective of HBeAg status.
Highlights
- 1.
HBeAg-positive state per se is one of the risk factor for severe liver complications.
- 2.
The rate of HBsAg clearance was higher in males than in females.
- 3.
Markov model is useful to simulate the age-matched survival rate or cumulative incidence using 1-year transition probability.
1 INTRODUCTION
Hepatitis B virus (HBV) was discovered as an Australian antigen by Blumberg in 19641; virus particles called Dane particles, comprising an outer lipid envelop and an icosahedral nucleocapsid core composed of proteins, were identified in 1970.2-5
In Japan, the rate of posttransfusion HBV infection has decreased greatly after the introduction of hepatitis B surface antigen (HBsAg) screening of donated blood in all blood centers since 1972. Thereafter, HBsAg testing has been widely used in hospitals and for health check-ups as a tool for the screening of HBV infections.
Persistent HBV infections in Japan are mainly perinatal infections caused by either mother-to-child transmission or horizontal infection during infant life. Since 1986, the national program for the prevention of mother-to-child transmission has been implemented using an original protocol in which babies born to HBV-infected mothers, (positive for HBsAg and hepatitis B e antigen [HBeAg]) received hepatitis B immune globulin at birth and 2 months as well as a vaccine at 2, 3, and 5 months after birth. Based on a large-scale epidemiological study, the prevalence of HBV infection among the generation born after the implementation of the prevention program in 1986 was lower than that of those born before 1986.6-8
When a new born baby is infected during delivery or during infant life, one of HBV-related antigens called HBeAg remains positive due to an immature immune system; this stage is known as the immune tolerance phase. When the immune system becomes mature, HBeAg seroconversion can occur as early as 10 years of age or at age 20 to 39 years through immune clearance of HBeAg, after which the HBe antibody is produced. Some persistent HBV infections remain HBeAg positive and do not undergo HBeAg seroconversion.9 Seroconversion of HBeAg is frequently found in subclinical infections, which are less likely to progress into acute hepatitis but sometimes become persistent HBV infections without obvious clinical symptoms.
Since they suffer from acute hepatitis at the time of immune clearance at age 20 to 29 years or later, most HBeAg-seroconverted individuals consult medical institutions for treatment. Therefore, it is difficult to clarify the natural course and liver pathology of persistent HBV infections from the beginning of infection throughout their life. Moreover, most HBeAg-seroconverted patients with persistent HBV infections are asymptomatic and are less likely to seek frequent consultation.10 Approximately 85% to 90% of individuals with persistent HBV infection are healthy; these individuals are known as asymptomatic carriers of HBV (AC). However, the remaining 10% to 15% of individuals suffers from chronic liver disease, such as chronic hepatitis (CH), liver cirrhosis (LC), or hepatocellular carcinoma (HCC). Patients requiring long-term medical follow-up have clinical signs and symptoms with underlying fibrosis and need treatment intervention; some of these patients have poor treatment outcomes.
Most studies regarding the transition of liver disease states and prognosis of persistent HBV infection throughout life focus on patients visiting hospitals. Nevertheless, it is difficult to clarify the natural course and prognosis of persistent HBV infections based on hospital-based studies because of a high possibility of some selection bias. For this reason, there are unclarified facts related to the overall natural course and prognosis of persistent HBV infections, especially with asymptomatic persistent infections.
Recent reports indicate that some HBeAg-negative HB patients have a poor prognosis and have a worsening disease state associated with severe hepatitis and HCC.11 However, when comparing the prognosis of HBeAg-positive and HBeAg-negative individuals with persistent HBV infections, it is difficult to determine in which serological stage the carcinogenesis has started, because having an HBeAg-negative status means that seroconversion to a positive status had been experienced previously. Therefore, the previous period of HBeAg-positive status should be kept in mind when considering the prognosis of HBeAg-negative individuals.
In this study, we estimated and compared the cumulative incidence rates of HCC and HBsAg seroclearance between an HBeAg-negative cohort at entry or seroconverted later (group 1) and an HBeAg-positive cohort at entry (group 2) usin7g a Markov probability model that can adjust for age, sex, and liver state.
2 MATERIALS AND METHODS
2.1 Subjects
Among residents who received free HBsAg screening at a medical institution or during health check-ups between 1977 and 2017 in a specific area of the Kyushu region, 951 residents with persistent HBV infection were selected after primary recruitment. Residents with HBV and hepatitis C (HCV) coinfection or acute HBV infection were excluded from this study. Among the 951 residents included, 89 residents were then excluded based on the following exclusion criteria: (a) diagnosis of HCC within 3 months later from the entry (n = 38); (b) a follow-up period of less than 1 year (n = 45); or (c) no testing for serum HBeAg at entry (n = 6). Hence, 862 residents with persistent HBV infections assessed during their resident health check-ups were found to be eligible for this study, and their outcomes with respect to annual liver disease state were analysed based on annual health check-ups records (Figure 1, Table 1). Data on liver disease states after antiviral treatment were excluded from annual transition probability calculations. Finally, 12 417 person-year (PY) units were used for estimation in this study.

Study participants. Group 1 (HBeAg negative at entry) and group 2 (HBeAg positive at entry)
| Age at the entry (y) | Overall follow-up period including treatment onward period (y) | Follow-up period for this study (y) | ||||||||
|---|---|---|---|---|---|---|---|---|---|---|
| N | Mean ± SD | Median | Min-max | Mean ± SD | Median | Min-max | Mean ± SD | Median | Min-max | |
| Total | 862 | 45.3±17.0 | 44.3 | 0.9-95.3 | 15.7±8.8 | 16.8 | 0.6-34.8 | 15.5±8.8 | 14.9 | 0.6-34.6 |
| With anti-viral treatment | 34 | 40.3±13.4 | 38.7 | 8.4-74.4 | 20.5±9.0 | 22.7 | 2.8-34.8 | 15.0±8.8 | 17.1 | 0.8-30.9 |
| Without anti-virus treatment | 828 | 45.4±17.1 | 44.7 | 0.9-95.3 | 15.5±8.8 | 16.6 | 0.6-34.6 | 15.5±8.8 | 16.6 | 0.6-34.6 |
| Men | 495 | 44.6±15.8 | 43.3 | 0.9-83.5 | 15.4±8.9 | 16.4 | 0.6-34.8 | 15.1±8.8 | 16.3 | 0.6-32.6 |
| With anti-viral treatment | 23 | 37.8±12.5 | 38.2 | 8.4-66.7 | 20.1±8.6 | 23.4 | 5.9-34.8 | 14.1±8.6 | 16.4 | 0.8-26.3 |
| Without anti-virus treatment | 472 | 44.9±15.9 | 43.8 | 0.9-83.5 | 15.2±8.8 | 16.3 | 0.6-32.6 | 15.2±8.8 | 16.3 | 0.6-32.6 |
| Women | 367 | 46.1±18.5 | 45.9 | 1.0-95.3 | 16.2±8.8 | 17.3 | 1.0-34.6 | 16.1±8.7 | 17.1 | 1.0-34.6 |
| With anti-viral treatment | 11 | 45.4±14.5 | 44.6 | 19.9-74.4 | 21.4±10.0 | 22.0 | 2.8-32.6 | 16.9±9.1 | 17.8 | 1.5-30.9 |
| Without anti-virus treatment | 356 | 46.2±18.7 | 46.0 | 1.0-95.3 | 16.0±8.7 | 17.0 | 1.0-34.6 | 16.0±8.7 | 17.0 | 1.0-34.6 |
2.2 Definition of group 1 (HBeAg negative at entry) and group 2 (HBeAg positive at entry)
The following two groups were defined in this study for comparison of cumulative incidence: group 1 included 617 residents who were HBeAg negative with serum HBV DNA less than 4.0 log IU/mL assayed by a polymerase chain reaction method; group 2 included 245 residents who were HBeAg positive at entry.
2.3 Liver disease states and definitions
- (1)
LC, defined as a clinical stage with one or more of either an aspartate aminotransferase (AST)-to-platelet ratio index ≥1.4 (AST level 80 IU/L or less) or a fibrosis-4 index value ≥3.6, platelet count ≤130 000, or endoscopically observed esophageal or gastric varices;
- (2)
CH, defined in the clinical stage with an alanine aminotransferase (ALT) ≥35 IU/L and HBV DNA ≥4.0 log IU/mL (not at the LC stage); and
- (3)
AC, defined at a clinical stage with ALT <35 IU/L and HBV DNA <4.0 log IU/mL (and not at the LC stage).
The disappearance of HBsAg suggests that the antigen is undetectable in sera, which can be measured by chemiluminescence immunoassays. HCC screening was performed using computed tomography and/or magnetic resonance imaging but the gold standard was histological findings from resected specimens of hepatic tumors or biopsy, or radiological findings of selective hepatic angiography.
2.4 The Markov probability model estimation of cumulative LC and HCC incidence
Yearly liver disease state transition probabilities were calculated for groups 1 and 2, and sex-specific and 10-year increment age groups were based on 12 417 PY data from annual clinical records of 862 HBV carriers (Figure 1). The progression of liver disease states over an extended period of time was simulated based on an annual transition probabilities matrix for groups 1 and 2, along with sex-specific and 10-year increment age groups. In a matrix, transition probabilities for 10 subsets were categorized by sex, which was then further stratified by five liver disease states (AC, CH, LC, HCC, and HBsAg negative) (Figure 2) over five decades of age (20 to 29, 30 to 39, 40 to 49, 50 to 59, and 60 to 69 years).

Structure of the Markov model. Transition diagram of liver disease states based on the Markov model is shown. Five states were defined: “AC, asymptomatic carrier,” “CH, chronic hepatitis,” “LC, liver cirrhosis,” “HCC, hepatocellular carcinoma,” “HBsAg, hepatitis B surface antigen negative.” Of these, HCC and HBsAg negative were the absorbing states from which no transition to other states occurred
Based on this procedure, the initial starting condition (age, liver state) was determined, and the simulation was performed. At first, an age of 30 years with CH was assumed as the initial starting condition, and cumulative incidences of LC and HCC were estimated for the next 35 years in groups 1 and 2. Thereafter, an age of 40 years with CH was assumed as the initial starting condition, and similar estimates were made for the next 25 years in the two groups and then compared.
2.5 Cumulative HBeAg-positive rate, subsequent progression to HCC, and cumulative incidence of HCC and HBsAg negative estimated using the Kaplan-Meier method
For all 862 HBV carriers, the sex-specific and age-specific cumulative HBeAg-positive rate during the follow-up period was calculated using the Kaplan-Meier method at entry. The cumulative incidence of HCC and HBsAg negative were calculated for each group consisting of 617 HBV carriers who were HBeAg negative at entry (group 1) and 245 HBV carriers who were HBeAg positive at entry (group 2). Thereafter, the cumulative incidence rates based on the Kaplan-Meier method were calculated for HBeAg-positive (group 2) and HBeAg-negative (group 1) at entry. Statistical analysis was performed using JMP version 9 (SAS Institute Inc., Cary, NC). A P value less than 0.05 was considered statistically significant.
3 ETHICAL CONSIDERATIONS
This study was approved by the ethics committee for epidemiological research of Hiroshima University (Epi-1082) in Japan. The main objective was explained to all participants, and informed consent was obtained after the procedure was explained to the participants.
4 RESULTS
4.1 Characteristics of residents
4.1.1 Age distribution and clinical diagnosis at entry
Among the 862 participants, the mean age was 45.3 ± 17.0 years, the overall follow-up period was 15.5 ± 8.8 years (range, 0.6 to 34.8 years), and the follow-up period for the study was 15.5 ± 8.8 years (the follow-up period after treatment initiation was not taken into account). There were 495 male residents (age 44.6 ± 15.8 years, with follow-up period of 15.1 ± 8.8 years) and 367 female residents (age 46.1 ± 18.5 years, with follow-up period of 16.1 ± 8.7 years). In all groups, the highest proportion of participation was found in the 30 to 39-year age group (Appendix 2). Seroconversion of HBeAg was frequently found in the 40 to 49-year age group. Regarding clinical diagnosis at entry, 58% (288 of 495), 27% (135 of 495), and 15% (72 of 495) of male residents and 71% (259 of 367), 22% (85 of 367), and 6% (23 of 367) of female residents were diagnosed as AC, CH, and LC, respectively.
4.1.2 Age-specific HBeAg-positive rate
The age-specific HBeAg-positive rate at entry was higher in both sexes at younger ages (83.9%, 44.9%, and 39.7% of male residents and 67.7%, 33.3%, and 22.2% of female residents at 0 to 19, 20 to 29, and 30 to 39 years, respectively) (Figure 3). Thereafter, estimated age-specific HBeAg-positive rates at 10-year intervals were linked for the same age group.

Age-specific HBeAg-positive rate. HBeAg-positive rates at entry are plotted as larger dots in the charts. Kaplan-Meier estimated age-specific HBeAg-positive rate after 10, 20, and 30 years are shown as smaller dots. HBeAg, hepatitis B e antigen
4.2 Subsequence progression to HCC and cumulative incidence of HCC and HBsAg negative estimated by Kaplan-Meier in both the HBeAg-positive and HBeAg-negative cohort at entry
During the follow-up period, 44 of 245 (18.0%) of cohort with the HBeAg-positive at entry (group 2) progressed to HCC, and 21 of 617 (3.4%) of cohort with the HBeAg negative at entry (group 1) progressed to HCC (P < 0.001). In addition, the overall incidence rate of HCC among the HBeAg-positive cohort (group 2) (1.30/100 PY; 95% confidence interval [CI]: 0.94–1.74/100 PY) at entry estimated using the PY method was higher than that of the HBeAg-negative cohort (group 1) (0.23/100 PY; 95% CI: 0.14–0.36/100 PY).
Overall, this showed that higher numbers of occurrence were found in the HBeAg-positive cohort, even though the average age of the HBeAg-positive cohort was younger than that of the HBeAg-negative cohort.
Using the Kaplan-Meier method, the cumulative incidence rates of HCC among the overall 862 HBV carriers were estimated to be higher in the HBeAg-positive cohort than that in the HBeAg-negative cohort and seroconverted cohort (P < 0.0001) (log-rank test) (Figure 4). Similary, HBsAg negative rate among group 2 is lower than that among group 1 (P < 0.0001)

Cumulative incidence rates of liver cirrhosis and HCC. Cumulative incidence rates were estimated using the Kaplan-Meier method among the two groups. HBeAg, hepatitis B e antigen; HBsAg, hepatitis B surface antigen; HCC, hepatocellular carcinoma
4.3 Natural histories of persistent HBV infection simulated using the Markov model
The 1-year liver disease state transition probabilities among five liver disease states were calculated based on 12 417 PY (9022 PY for group 1 and 3395 PY for group 2) (Figure 1). Age-specific and sex-specific 1-year liver disease state-transition probability matrices of groups A and B are shown in Appendix 1: Tables A1-A3. Based on the matrices, the percentage probabilities for transition across five states in hypothetical cohorts of AC and CH were simulated using the Markov model (Appendix Table A4, Figure 5).

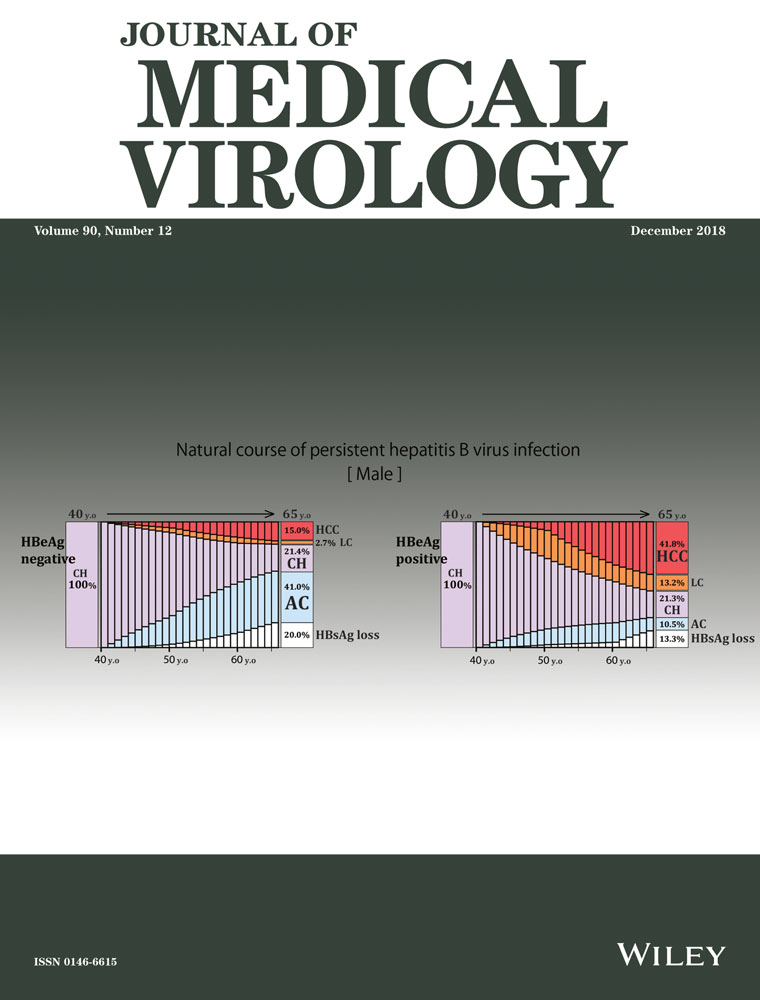
Natural histories of hepatitis B virus persistent infection in hypothetical cohorts of asymptomatic carriers and chronic hepatitis patients. Light blue represents asymptomatic carriers ; light purple, chronic hepatitis; orange, liver cirrhosis; red, hepatocellular carcinoma; and white, HBsAg negative
Assuming CH at 30 years of age as an initial starting condition to simulate for the following 35 years, 46.08% of male residents in group 1 remained in the CH state at age 50 years and 15.26% did so at 65 years old, while 39.94% and 28.32% subsided into an AC and HBsAg-negative state at 65 years, respectively. Only 13.20% of residents developed HCC at age 65 years (Figure 5, group 1). In group 2, 43.01% remained in the CH state at 50 years old and 18.15% at 65 years old, while 12.81% and 19.77% subsided into an AC and HBsAg-negative state at 65 years, respectively; 38.45% of residents developed HCC at age 65 years.
Assuming a CH state at age 40 years as an initial starting condition to simulate for the next 25 years, 21.43% of male residents in group 1 remained in the CH state at age 65 years, while 41.02% and 19.86% subsided into an AC, HBsAg-negative state at 65 years, respectively. Additionally, 15.04% developed HCC at age 65 years (Figure 5, group 2). In other words, if the CH state was sustained past age 40 years, HCC was likely to develop, but unlikely to subside into a better condition such as AC or HBsAg clearance.
Assuming that the disease remained in the CH state at age 30 years in group 1, the incidence of HCC was 13.20% for males and 4.08% for females. The rates of HBsAg loss in males and females were 28.32% and 21.15%, respectively. The incidence rates of HCC and HBsAg loss were higher in males than in females, while the rate of sustained CH status until age 65 years was lower in males than in females.
Assuming the disease remained in the CH state at age 30 years in group 2, the incidence of HCC was 38.45% in males and 18.20% in females. The rates of HBsAg loss in males and females were 19.77% and 16.17%, respectively. The incidence of HCC and HBsAg loss were higher in males than in females, while the rate of sustained CH status until age 65 years was 18.15% in males and 26.08% in females.
Assuming AC at 20 years of age as an initial starting condition to simulate for the following 40 years, in group 1, 53.94% of male and 64.84% of female residents remained in the AC state, whereas 44.43% and 31.62% transitioned into an HBsAg-negative state at age 60 years. The incidence rates of HBsAg clearance and HCC development, which is inversely related, was higher in males than in females. The rate of sustained AC status until age 65 years was 53.94% in males versus 64.84% in females.
Over the next 30 years, 15.19% of male residents were expected to remain in the CH state, 1.55% were expected to change to the LC state, 16.94% were expected to change to the HCC state, and 39.32% were expected to transition to an HBsAg-negative state. For female residents, the values were 28.70%, 2.28%, 8.25%, 36.34%, and 24.43%, respectively. In group 2 at a CH state at age 40 years, HCC onset was found at age 50 to 59 years for male residents and 60 to 69 years in for female residents.
5 DISCUSSION
The natural course of HBV infection can vary widely in different clinical and epidemiological settings, and is affected by both viral load and host factors. Therefore, it has proven to be quite difficult to obtain a clear understanding. Moreover, HBV has become a significant global burden with the worldwide endemic spread.12, 13
In our previous study on the natural history on HCV infection in 2003,14 we had estimated according to simulations with a Markov model, in which data from 2251 PY were analysed based on 924 HCV carriers from 1990 to 1999. The Markov model predicted the actual outcomes concerning the natural history of persistent HCV infection: there was no significant difference between this simulated study and an actual study of 153 HCV carriers identified among blood donors after 5 years.15, 16 The model also indicated that most people with persistent HCV infection were asymptomatic and that their liver condition would progress to LC or HCC.
The natural history of persistent HBV infection is quite difficult to understand because studies generally do not investigate AC of HBV or those who never consult medical facilities. Furthermore, the progression of liver disease states can also vary individually due to the influence of many confounding factors. Persistent HBV infection can be found in two different forms: HBeAg-positive CH and HBeAg-negative CH. According to the treatment guidelines for HBV by the Japan Society of Hepatology, HBeAg-negative CH should be recognized as a more advanced stage because it is frequently found in older individuals with a high grade of fibrosis compared with HBeAg-positive CH.17 HBeAg-negative CH is the state of CH after seroconversion from the HBeAg-positive state. Therefore the “advanced stage” in the guideline refers to the late phase of persistent HBV infection, which is due to the effect of aging and damage during the HBeAg-positive stage. It does not refer to the severity of the disease with a poor prognosis; it only mentions whether HBeAg is positive or negative.
The liver is a target organ of viral infection; furthermore, a longer period of persistent HBV infection indicates a longer inflammatory response, which might be responsible for a high occurrence of HCC and LC. This suggests that the risk of occurrence of HCC or LC increases with age due to the “carry-over effect” in which the patients with HBeAg-negative persistent HBV infection have already experienced fibrosis-like liver injury when they are in the HBeAg-positive stage before seroconversion. Therefore, this effect should be considered while estimating the transition probabilities among HBeAg-negative persistent HBV infection. It is assumed that occurrence of LC or HCC after seroconversion and the disease state transition probability among HBeAg-negative individuals with persistent HBV infection may depend on the severity of previous virus-induced liver damage. Hence, it should be noted that the HBeAg-positive state per se is one of the risk factors for severe liver complications.
When comparing the natural histories of persistent HBV infection between HBeAg-positive and HBeAg-negative cohorts with underlying CH, many confounding factors make it difficult to conclude that the resultant transition is mainly due to the positive or negative status of HBeAg. For example, age confounds the development and prognosis of the disease state. Therefore, a simple comparison is affected by factors such as HBeAg-positive or negative status, age, and sex, thus complicating the interpretation. The Markov model can adjust for such confounders as age, sex, and the carry-over effect, which cannot be done using the Kaplan-Meier method. In addition, in the Markov model, the age-matched survival rates and cumulative incidences can be estimated using 1-year transition probability. Accordingly, the Markov model has become a useful model for evaluating cost-effectiveness of interventions or prevention measures in health care system. For these reasons, this study was conducted to predict 1-year transition probability and its corresponding transition of liver disease states adjusted for HBeAg status using the theoretical epidemiological model; this was based on clinical records from annual health check-ups and long-term follow-ups of those with persistent HBV infection. In addition, the prognosis of persistent HBV infection can be estimated and compared between the HBeAg-positive cohort (group 2) and HBeAg-negative cohort (group 1). The outcome suggests that HBeAg-positive status is a high-risk state for LC and HCC in persistent HBV infections.
Liaw et al18 compared the cumulative incidences of LC and HCC with persistent HBV infections between HBeAg-positive and HBeAg-negative groups at entry and found that there was no statistical difference between the two groups. In this study, we also estimated the rates of LC and HCC among residents with CHB. Both LC and HCC occurred more frequently in male residents than that in female residents, irrespective of HBeAg status.
Interestingly, the rates of HBsAg clearance also occurred more frequently in males than in females, irrespective of HBeAg status. In addition, if CH aged 30 years did not improve its condition but continued in the same liver stage until age 40 years, HCC risk increased and the HBsAg clearance rate declined, regardless of gender and HBeAg status. Differences in disease state transition may be related to the strength of the immune response. A strong immune response could suppress the viral replication, but prolonged inflammation causes progression of fibrosis. Gender differences in disease state transition may indicate differences in the degree of immune response.
This study has a little limitation, that is, most of subjects enrolled at annual public health check-ups. Thus, subjects profile had little detailed information, such as serum HBsAg levels, HBV genotype, α-fetoprotein, cigarette smoking, consumption of alcohol, and any family history of HCC or LC.
In conclusion, this population-based study indicated that the rate of HBsAg disappearance was higher in males than in females, and that males are likewise more likely than females to develop HCC
ACKNOWLEDGEMENTS
The study was partly funded by a grant from the Japanese Ministry of Health, Labour, and Welfare (H28-Kansei-ippan-001).
CONFLICTS OF INTEREST
The authors declare that there are no conflicts of interest.
APPENDIX A
| Male | Female | |||||||||
|---|---|---|---|---|---|---|---|---|---|---|
| Initial disease states | HBsAg(−) | AC | CH | LC | HCC | HBsAg(−) | AC | CH | LC | HCC |
| Starting age: 30-39 y | ||||||||||
| HBsAg negative | 100.00 | 0.00 | 0.00 | 0.00 | 0.00 | 100.00 | 0.00 | 0.00 | 0.00 | 0.00 |
| AC | 0.74 | 98.70 | 0.56 | 0.00 | 0.00 | 0.73 | 98.35 | 0.91 | 0.00 | 0.00 |
| CH | 0.00 | 2.87 | 96.41 | 0.48 | 0.24 | 0.00 | 3.14 | 96.86 | 0.00 | 0.00 |
| LC | 0.92 | 0.00 | 0.00 | 99.08 | 0.00 | 0.00 | 0.00 | 0.00 | 100.00 | 0.00 |
| HCC | 0.00 | 0.00 | 0.00 | 0.00 | 100.00 | 0.00 | 0.00 | 0.00 | 0.00 | 100.00 |
| Starting age: 40-49 y | ||||||||||
| HBsAg negative | 100.00 | 0.00 | 0.00 | 0.00 | 0.00 | 100.00 | 0.00 | 0.00 | 0.00 | 0.00 |
| AC | 2.36 | 96.89 | 0.64 | 0.00 | 0.11 | 0.81 | 99.05 | 0.14 | 0.00 | 0.00 |
| CH | 0.00 | 2.48 | 94.82 | 2.28 | 0.41 | 0.00 | 2.43 | 97.17 | 0.40 | 0.00 |
| LC | 0.40 | 0.00 | 0.00 | 96.83 | 2.78 | 0.00 | 0.00 | 0.00 | 97.22 | 2.78 |
| HCC | 0.00 | 0.00 | 0.00 | 0.00 | 100.00 | 0.00 | 0.00 | 0.00 | 0.00 | 100.00 |
| Starting age: 50-59 y | ||||||||||
| HBsAg negative | 100.00 | 0.00 | 0.00 | 0.00 | 0.00 | 100.00 | 0.00 | 0.00 | 0.00 | 0.00 |
| AC | 2.43 | 97.46 | 0.11 | 0.00 | 0.00 | 2.15 | 97.34 | 0.51 | 0.00 | 0.00 |
| CH | 0.00 | 3.23 | 93.55 | 1.17 | 2.05 | 0.00 | 3.24 | 94.60 | 1.80 | 0.36 |
| LC | 1.20 | 0.00 | 0.00 | 92.40 | 6.40 | 2.53 | 0.00 | 0.00 | 92.41 | 5.06 |
| HCC | 0.00 | 0.00 | 0.00 | 0.00 | 100.00 | 0.00 | 0.00 | 0.00 | 0.00 | 100.00 |
| Starting age: 60-69 y | ||||||||||
| HBsAg negative | 100.00 | 0.00 | 0.00 | 0.00 | 0.00 | 100.00 | 0.00 | 0.00 | 0.00 | 0.00 |
| AC | 3.47 | 95.66 | 0.62 | 0.00 | 0.25 | 1.72 | 97.88 | 0.26 | 0.13 | 0.00 |
| CH | 0.00 | 5.49 | 91.46 | 1.22 | 1.83 | 1.34 | 2.01 | 93.96 | 0.67 | 2.01 |
| LC | 4.26 | 0.00 | 0.00 | 91.49 | 4.26 | 5.36 | 0.00 | 0.00 | 89.29 | 5.36 |
| HCC | 0.00 | 0.00 | 0.00 | 0.00 | 100.00 | 0.00 | 0.00 | 0.00 | 0.00 | 100.00 |
- Abbreviations: AC, asymptomatic carrier; CH, chronic hepatitis; HBsAg, hepatitis B surface antigen; HCC, hepatocellular carcinoma; LC, liver cirrhosis.
| Male | Female | |||||||||||||
|---|---|---|---|---|---|---|---|---|---|---|---|---|---|---|
| Initial disease states | HBsAg(−) | AC | CH | LC | HCC | HBsAg(−) | AC | CH | LC | HCC | ||||
| Starting age: 30-39 y | ||||||||||||||
| HBsAg negative | 100.00 | 0.00 | 0.00 | 0.00 | 0.00 | 100.00 | 0.00 | 0.00 | 0.00 | 0.00 | ||||
| AC | 1.02 | 98.98 | 0.00 | 0.00 | 0.00 | 0.96 | 98.56 | 0.48 | 0.00 | 0.00 | ||||
| CH | 0.00 | 2.92 | 96.35 | 0.73 | 0.00 | 0.00 | 3.17 | 96.83 | 0.00 | 0.00 | ||||
| LC | 2.38 | 0.00 | 0.00 | 97.62 | 0.00 | 0.00 | 0.00 | 0.00 | 100.00 | 0.00 | ||||
| HCC | 0.00 | 0.00 | 0.00 | 0.00 | 100.00 | 0.00 | 0.00 | 0.00 | 0.00 | 100.00 | ||||
| Starting age: 40-49 y | ||||||||||||||
| HBsAg negative | 100.00 | 0.00 | 0.00 | 0.00 | 0.00 | 100.00 | 0.00 | 0.00 | 0.00 | 0.00 | ||||
| AC | 2.40 | 97.23 | 0.38 | 0.00 | 0.00 | 0.96 | 99.04 | 0.00 | 0.00 | 0.00 | ||||
| CH | 0.00 | 3.11 | 95.85 | 0.52 | 0.52 | 0.00 | 0.76 | 99.24 | 0.00 | 0.00 | ||||
| LC | 0.00 | 0.00 | 0.00 | 97.75 | 2.25 | 0.00 | 0.00 | 0.00 | 100.00 | 0.00 | ||||
| HCC | 0.00 | 0.00 | 0.00 | 0.00 | 100.00 | 0.00 | 0.00 | 0.00 | 0.00 | 100.00 | ||||
| Starting age: 50-59 y | ||||||||||||||
| HBsAg negative | 100.00 | 0.00 | 0.00 | 0.00 | 0.00 | 100.00 | 0.00 | 0.00 | 0.00 | 0.00 | ||||
| AC | 2.52 | 97.48 | 0.00 | 0.00 | 0.00 | 2.00 | 97.86 | 0.14 | 0.00 | 0.00 | ||||
| CH | 0.00 | 5.33 | 92.67 | 0.67 | 1.33 | 0.00 | 3.07 | 95.71 | 1.23 | 0.00 | ||||
| LC | 2.88 | 0.00 | 0.00 | 94.23 | 2.88 | 4.26 | 0.00 | 0.00 | 91.49 | 4.26 | ||||
| HCC | 0.00 | 0.00 | 0.00 | 0.00 | 100.00 | 0.00 | 0.00 | 0.00 | 0.00 | 100.00 | ||||
| Starting age: 60-69 y | ||||||||||||||
| HBsAg negative | 100.00 | 0.00 | 0.00 | 0.00 | 0.00 | 100.00 | 0.00 | 0.00 | 0.00 | 0.00 | ||||
| AC | 3.21 | 96.02 | 0.51 | 0.00 | 0.26 | 1.78 | 97.95 | 0.27 | 0.00 | 0.00 | ||||
| CH | 0.00 | 6.80 | 92.23 | 0.00 | 0.97 | 2.44 | 3.66 | 92.68 | 0.00 | 1.22 | ||||
| LC | 5.80 | 0.00 | 0.00 | 89.86 | 4.35 | 6.45 | 0.00 | 0.00 | 90.32 | 3.23 | ||||
| HCC | 0.00 | 0.00 | 0.00 | 0.00 | 100.00 | 0.00 | 0.00 | 0.00 | 0.00 | 100.00 | ||||
- Abbreviations: AC, asymptomatic carrier; CH, chronic hepatitis; HBsAg, hepatitis B surface antigen; HCC, hepatocellular carcinoma; LC, liver cirrhosis.
| Male | Female | |||||||||||||
|---|---|---|---|---|---|---|---|---|---|---|---|---|---|---|
| Initial disease states | HBsAg(−) | AC | CH | LC | HCC | HBsAg(−) | AC | CH | LC | HCC | ||||
| Starting age: 30-39 y | ||||||||||||||
| HBsAg negative | 100.00 | 0.00 | 0.00 | 0.00 | 0.00 | 100.00 | 0.00 | 0.00 | 0.00 | 0.00 | ||||
| AC | 0.00 | 97.90 | 2.10 | 0.00 | 0.00 | 0.00 | 97.69 | 2.31 | 0.00 | 0.00 | ||||
| CH | 0.00 | 2.85 | 96.44 | 0.36 | 0.36 | 0.00 | 3.13 | 96.88 | 0.00 | 0.00 | ||||
| LC | 0.00 | 0.00 | 0.00 | 100.00 | 0.00 | 0.00 | 0.00 | 0.00 | 100.00 | 0.00 | ||||
| HCC | 0.00 | 0.00 | 0.00 | 0.00 | 100.00 | 0.00 | 0.00 | 0.00 | 0.00 | 100.00 | ||||
| Starting age: 40-49 y | ||||||||||||||
| HBsAg negative | 100.00 | 0.00 | 0.00 | 0.00 | 0.00 | 100.00 | 0.00 | 0.00 | 0.00 | 0.00 | ||||
| AC | 2.16 | 94.96 | 2.16 | 0.00 | 0.72 | 0.00 | 99.13 | 0.87 | 0.00 | 0.00 | ||||
| CH | 0.00 | 2.07 | 94.14 | 3.45 | 0.34 | 0.00 | 4.35 | 94.78 | 0.87 | 0.00 | ||||
| LC | 0.61 | 0.00 | 0.00 | 96.32 | 3.07 | 0.00 | 0.00 | 0.00 | 95.00 | 5.00 | ||||
| HCC | 0.00 | 0.00 | 0.00 | 0.00 | 100.00 | 0.00 | 0.00 | 0.00 | 0.00 | 100.00 | ||||
| Starting age: 50-59 y | ||||||||||||||
| HBsAg negative | 100.00 | 0.00 | 0.00 | 0.00 | 0.00 | 100.00 | 0.00 | 0.00 | 0.00 | 0.00 | ||||
| AC | 1.39 | 97.22 | 1.39 | 0.00 | 0.00 | 3.37 | 93.26 | 3.37 | 0.00 | 0.00 | ||||
| CH | 0.00 | 1.57 | 94.24 | 1.57 | 2.62 | 0.00 | 3.48 | 93.04 | 2.61 | 0.87 | ||||
| LC | 0.00 | 0.00 | 0.00 | 91.10 | 8.90 | 0.00 | 0.00 | 0.00 | 93.75 | 6.25 | ||||
| HCC | 0.00 | 0.00 | 0.00 | 0.00 | 100.00 | 0.00 | 0.00 | 0.00 | 0.00 | 100.00 | ||||
| Starting age: 60-69 y | ||||||||||||||
| HBsAg negative | 100.00 | 0.00 | 0.00 | 0.00 | 0.00 | 100.00 | 0.00 | 0.00 | 0.00 | 0.00 | ||||
| AC | 10.71 | 85.71 | 3.57 | 0.00 | 0.00 | 0.00 | 95.65 | 0.00 | 4.35 | 0.00 | ||||
| CH | 0.00 | 3.28 | 90.16 | 3.28 | 3.28 | 0.00 | 0.00 | 95.52 | 1.49 | 2.99 | ||||
| LC | 2.78 | 0.00 | 0.00 | 93.06 | 4.17 | 4.00 | 0.00 | 0.00 | 88.00 | 8.00 | ||||
| HCC | 0.00 | 0.00 | 0.00 | 0.00 | 100.00 | 0.00 | 0.00 | 0.00 | 0.00 | 100.00 | ||||
- Abbreviation: AC, asymptomatic carrier state; CH, chronic hepatitis; HBsAg, hepatitis B surface antigen; HCC, hepatocellular carcinoma; LC, liver cirrhosis.
| Male | Female | |||||||||||
|---|---|---|---|---|---|---|---|---|---|---|---|---|
| HBeAg entry | Initial state | 30 y | 40 y | 50 y | 60 y | 65 y | 30 y | 40 y | 50 y | 60 y | 65 y | |
| Overall | 30 y | HCC | 0.00 | 2.04 | 7.21 | 21.17 | 24.98 | 0.00 | 0.00 | 0.32 | 4.40 | 8.99 |
| CH | LC | 0.00 | 3.91 | 13.84 | 8.88 | 6.65 | 0.00 | 0.00 | 2.32 | 6.65 | 4.79 | |
| CH | 100.00 | 69.96 | 42.49 | 22.05 | 14.93 | 100.00 | 73.70 | 55.66 | 33.60 | 25.09 | ||
| AC | 0.00 | 23.06 | 28.85 | 31.45 | 29.92 | 0.00 | 25.39 | 38.22 | 41.90 | 40.53 | ||
| HBsAg negative | 0.00 | 1.02 | 7.62 | 16.45 | 23.52 | 0.00 | 0.91 | 3.48 | 13.46 | 20.60 | ||
| 40 y | HCC | 0.00 | 5.68 | 23.42 | 28.19 | 0.00 | 0.44 | 5.92 | 11.96 | |||
| CH | LC | 0.00 | 15.57 | 10.68 | 8.17 | 0.00 | 3.14 | 8.89 | 6.27 | |||
| CH | 100.00 | 59.27 | 30.60 | 20.29 | 100.00 | 75.14 | 44.25 | 32.80 | ||||
| AC | 0.00 | 17.03 | 25.90 | 27.26 | 0.00 | 20.49 | 32.64 | 33.11 | ||||
| HBsAg negative | 0.00 | 2.44 | 9.40 | 16.09 | 0.00 | 0.80 | 8.30 | 15.86 | ||||
| HBeAg negative (group 1) | 30 y | HCC | 0.00 | 0.00 | 4.43 | 10.77 | 13.20 | 0.00 | 0.00 | 0.00 | 1.13 | 4.08 |
| CH | LC | 0.00 | 5.54 | 7.11 | 5.59 | 3.28 | 0.00 | 0.00 | 0.00 | 4.62 | 2.78 | |
| CH | 100.00 | 68.95 | 46.08 | 21.51 | 15.26 | 100.00 | 72.98 | 67.64 | 44.01 | 30.57 | ||
| AC | 0.00 | 23.66 | 33.60 | 41.75 | 39.94 | 0.00 | 25.81 | 28.54 | 38.52 | 41.42 | ||
| HBsAg negative | 0.00 | 1.84 | 8.79 | 20.38 | 28.32 | 0.00 | 1.21 | 3.82 | 11.72 | 21.15 | ||
| 40 y | HCC | 0.00 | 4.76 | 12.42 | 15.04 | 0.00 | 0.00 | 1.55 | 5.56 | |||
| CH | LC | 0.00 | 3.88 | 4.53 | 2.65 | 0.00 | 0.00 | 6.32 | 3.80 | |||
| CH | 100.00 | 65.88 | 30.76 | 21.43 | 100.00 | 92.68 | 59.96 | 41.36 | ||||
| AC | 0.00 | 22.69 | 40.05 | 41.02 | 0.00 | 7.01 | 26.88 | 33.33 | ||||
| HBsAg negative | 0.00 | 2.79 | 12.24 | 19.86 | 0.00 | 0.31 | 5.30 | 15.96 | ||||
| HBeAg positive (group 2) | 30 y | HCC | 0.00 | 3.06 | 10.18 | 32.43 | 38.45 | 0.00 | 0.00 | 1.13 | 9.24 | 18.20 |
| CH | LC | 0.00 | 3.06 | 18.64 | 10.90 | 10.82 | 0.00 | 0.00 | 4.17 | 9.98 | 12.29 | |
| CH | 100.00 | 71.70 | 43.01 | 26.18 | 18.15 | 100.00 | 75.38 | 46.70 | 32.79 | 26.08 | ||
| AC | 0.00 | 22.17 | 22.53 | 21.75 | 12.81 | 0.00 | 24.62 | 47.99 | 34.05 | 27.26 | ||
| HBsAg negative | 0.00 | 0.00 | 5.63 | 8.74 | 19.77 | 0.00 | 0.00 | 0.00 | 13.93 | 16.17 | ||
| 40 y | HCC | 0.00 | 6.88 | 34.42 | 41.75 | 0.00 | 1.49 | 11.54 | 21.63 | |||
| CH | LC | 0.00 | 22.37 | 13.34 | 13.20 | 0.00 | 5.45 | 12.19 | 12.85 | |||
| CH | 100.00 | 55.93 | 32.46 | 21.28 | 100.00 | 59.78 | 36.88 | 29.33 | ||||
| AC | 0.00 | 12.57 | 15.54 | 10.51 | 0.00 | 33.28 | 28.72 | 23.00 | ||||
| HBsAg negative | 0.00 | 2.25 | 4.23 | 13.27 | 0.00 | 0.00 | 10.67 | 13.20 | ||||
- Abbreviation: AC, asymptomatic carrier state; CH, chronic hepatitis; HBsAg, hepatitis B surface antigen; HCC, hepatocellular carcinoma; LC, liver cirrhosis.
APPENDIX B
See Figure B1 here.

Age disrtibution of the study subjects at entry. HBeAg, hepatitis B e antigen; HBV, hepatitis B virus; HCC, hepatocellular carcinoma