Breast percent density changes in digital mammography pre- and post-radiotherapy
Abstract
Introduction
Breast cancer (BC), the most frequently diagnosed malignancy among women worldwide, presents a public health challenge and affects mortality rates. Breast-conserving therapy (BCT) is a common treatment, but the risk from residual disease necessitates radiotherapy. Digital mammography monitors treatment response by identifying post-operative and radiotherapy tissue alterations, but accurate assessment of mammographic density remains a challenge. This study used OpenBreast to measure percent density (PD), offering insights into changes in mammographic density before and after BCT with radiation therapy.
Methods
This retrospective analysis included 92 female patients with BC who underwent BCT, chemotherapy, and radiotherapy, excluding those who received hormonal therapy or bilateral BCT. Percent/percentage density measurements were extracted using OpenBreast, an automated software that applies computational techniques to density analyses. Data were analysed at baseline, 3 months, and 15 months post-treatment using standardised mean difference (SMD) with Cohen's d, chi-square, and paired sample t-tests. The predictive power of PD changes for BC was measured based on the receiver operating characteristic (ROC) curve analysis.
Results
The mean age was 53.2 years. There were no significant differences in PD between the periods. Standardised mean difference analysis revealed no significant changes in the SMD for PD before treatment compared with 3- and 15-months post-treatment. Although PD increased numerically after radiotherapy, ROC analysis revealed optimal sensitivity at 15 months post-treatment for detecting changes in breast density.
Conclusions
This study utilised an automated breast density segmentation tool to assess the changes in mammographic density before and after BC treatment. No significant differences in the density were observed during the short-term follow-up period. However, the results suggest that quantitative density assessment could be valuable for long-term monitoring of treatment effects. The study underscores the necessity for larger and longitudinal studies to accurately measure and validate the effectiveness of quantitative methods in clinical BC management.
Introduction
Cancer is a primary cause of mortality and a major impediment to increased life expectancy in every nation around the world.1 Breast cancer (BC) is a critical public health issue and currently the most frequently diagnosed malignancy in women worldwide.1, 2 With an expected 2.3 million new cases and 685,000 deaths in 2020, breast cancer (BC) has surpassed lung cancer as the most frequently diagnosed malignancy, followed by lung, colorectal, prostate, and stomach cancers.3 In 2020, BC accounted for 24.5% of all cancer cases and 15.5% of cancer-related deaths among women, making it the most common type of cancer and leading cause of cancer-related deaths in most countries.4 Breast-conserving therapy (BCT) is a standard treatment for BC. Breast-conserving therapy aims to excise cancerous tissue while sparing as much of the breast as possible; however, the inability to remove breast cancer in its entirety necessitates adjunctive treatments such as radiotherapy and chemotherapy to manage residual disease risk.5
Digital mammography, which uses low-dose X-rays to carefully examine the human breast, is widely recognised as the most reliable diagnostic tool for breast cancer diagnosis. This technology is excellent for detecting early-stage BC, providing important insights into small changes in the breast tissue. These changes can include increased breast tissue density, changes in skin or structural features, and signs of fluid accumulation or scar formation, which can provide information about treatment response and aid in detecting recurrent cancers after breast-conserving therapy (BCT).6 Moreover, post-radiation therapy, density changes can be attributed to various factors including fibrosis, parenchymal oedema, postoperative collections, scar tissue formation, and skin thickening. These changes do not solely indicate increased fibroglandular tissue but also represent a complex interplay of treatment-induced alterations in breast tissue composition.7, 8
Importantly, mammography can detect these changes and capture breast tissue density information. Advanced computational analysis of mammography images enables the quantification of breast tissue density, which is a powerful-independent risk factor for BC.9 Percent density (PD) was measured by assessing the proportion of dense fibroglandular tissue in the breast.10-12 Until recently, digital mammography faced challenges in providing quantitative tissue density data, which is an important aspect of assessing BC risk.13, 14 However, recent advancements have begun to overcome these barriers, improving the analysis of density and allowing for the detection of subtle changes in post-treatment tissue, as well as enhancing the detection of masses and overall assessment of recurrence risk.13, 14 This quantification is crucial, as studies have shown that women with higher PD values (>75%) have a significantly higher risk of developing BC (up to four–six times higher) than women with lower PD values (<5%).12, 15
Computational techniques, such as cumulus-like interactive thresholding, have been introduced, offering a consistent means of measuring mammographic density that is less influenced by reader variability. Among these innovations is OpenBreast, which is a clinically validated software crafted for automated density measurements using an advanced thresholding technique. OpenBreast stages include data extraction from parenchymal analysis,11 digital mammography image standardisation,10 breast segmentation and identification of the chest wall,16 identifying the breast regions of interest (ROIs),17, 18 and breast density segmentation.19 Experts in medical imaging are increasingly interested in creating completely automated approaches that can reliably and quantitatively evaluate the PD levels. Estimation of PD may now be performed automatically using tools such as OpenBreast. OpenBreast is an example of a software tool that can estimate the PD values in a completely automated way.12
This study aims to analyse digital mammography images using OpenBreast to quantitatively evaluate changes in breast PD in women with BC before and after pre-radiotherapy treatment, and at 3 months and 15 months post-treatment.
Methods
Patient selection
This retrospective study included 92 female BC patients with a history of BCT surgery, chemotherapy (using six–eight rounds of anthracycline), and radiotherapy (2–3 weeks after chemotherapy). Radiotherapy was administered 2–3 weeks following the final cycle of chemotherapy to allow sufficient time for recovery from chemotherapy effects while capitalising on the increased sensitivity of residual tumour cells to radiation during the proliferative phase immediately after chemotherapy. PD was measured in the breast during BCT, and women who received hormonal therapy and bilateral BCT were excluded. This work was adapted from the MD thesis and supported by Hamadan University of Medical Sciences, Hamadan, Iran (Research Code: 30539). Ethical Code (approval ID): IR.UMSHA.REC.1398.434.
Treatment design
The treatment procedure was designed using the 3D-CRT technique, with a dose of 60 Gy in 30 sessions. The linear accelerator used was the Elekta Synergy Platform (Stockholm, Sweden) with an ISOgray treatment planning system. For patients with thin breast tissue, a six MV photon beam was used, whereas both six and 18 MV photon beams were applied to patients with thick breast tissue.
OpenBreast
OpenBreast density analysis software is a parenchymal analysis framework that applies automated segmentation and feature extraction to mammographic images to quantify the breast density.10 Specifically, OpenBreast utilises a Cumulus-like interactive thresholding technique to separate dense and non-dense tissues in the breast region.10 By manually adjusting the intensity threshold in the mammogram, this method enables a human reader to separate dense parenchymal tissue from non-dense tissue.10 Parenchymal analysis workflow, as described by OpenBreast, was applied.
Segmentation and ROI detection
Breast segmentation is a crucial step in quantifying breast tissue density using the OpenBreast density analysis software. This involves the identification of the breast area in a mammogram image. This process includes various tasks such as background detection, chest wall detection, and nipple recognition. OpenBreast developed at the Universidad Industrial de Santander's School of Electrical, Electronics, and Telecommunications Engineering in Boucaramanga, Colombia, provides a comprehensive framework for breast segmentation and ROI detection (www.github.com/spertuz/openbreast).10, 11, 20
Density analysis
Analysis of mammographic images
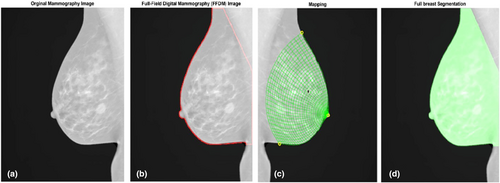
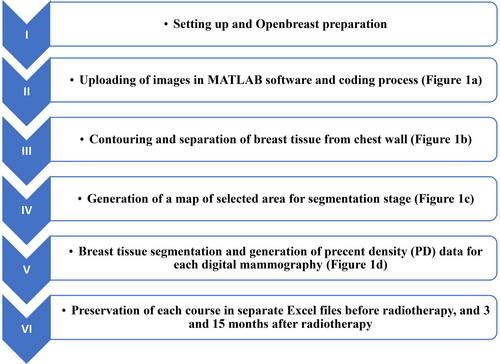
Mammography was conducted before, as well as at the 3 and 15-month time points, following breast radiotherapy. To assess alterations in breast tissue before and after radiotherapy, MATLAB 2021a software was used for the analysis. The Openbreast toolbox was utilised for the analysis, with the coding implemented in the MATLAB software. Breast tissue density was assessed at both pre- and post-treatment stages (Fig. 1). The steps involved in this process are illustrated in the flowchart in (Fig. 2).
Statistical analysis
Collected data were analysed using SPSS™ software (v. 20) using descriptive statistics, Chi-square, and Paired Sample T-test samples. Statistical significance was set at P < 0.05, and the data are expressed as the mean ± SD. Stata version 17 (StataCorp, College Station, TX, USA) was also used for the statistical analysis. The standardised mean difference (SMD) was used to analyse the mean PD among patients before treatment, 3 months after radiotherapy, and 15 months after radiotherapy. Cohen's d cut-off values (0.2, 0.5, and 0.8) were applied.31
Results
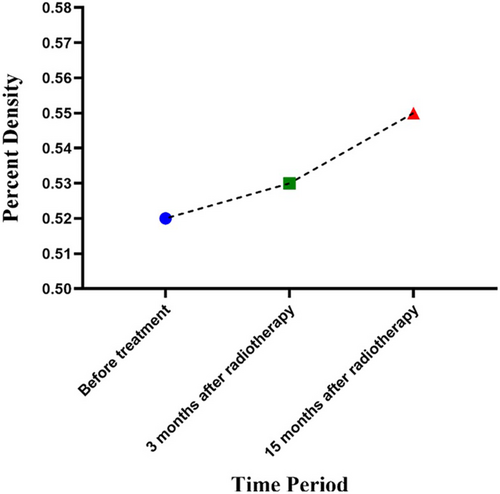
The mean age of the patients was 53.2 ± 7.6 years. Tables 1 and 2 present the mean breast densities before and after RT, as well as the changes in breast PD in different time periods, respectively. Changes in breast density are shown in Figure 3.
| Time period | Percent density (PD) (Mean ± SD) | Mean difference | P-value (Before vs. After Radiotherapy) |
|---|---|---|---|
| Before radiotherapy | 0.52 ± 0.13 | −0.002 | 1 |
| 3 months after radiotherapy | 0.53 ± 0.09 | −0.023 | 0.47 |
| 15 months after radiotherapy | 0.55 ± 0.09 | −0.02 | 0.17 |
| Decreasing cases n (%) | Mean reduction (%) | Increasing cases n (%) | Mean increase (%) | No change cases n (%) | |
|---|---|---|---|---|---|
| Before versus 3 months after | 49 (53.2%) | 8.68 | 41 (44.5%) | 10.91 | 2 (2.3%) |
| Before versus 15 months after | 46 (52%) | 8.54 | 44 (47.7%) | 13.63 | 2 (2.3%) |
We conducted a comparative receiver operating characteristic (ROC) analysis to compare changes in breast density across the four different states, as illustrated in Figure 4. These comparisons included density changes ‘before versus 3 months after’, ‘before versus 15 months after’, ‘3 months after versus 15 months after’, and comparisons of ‘PD changes after 3 months versus PD changes after 15 months’.
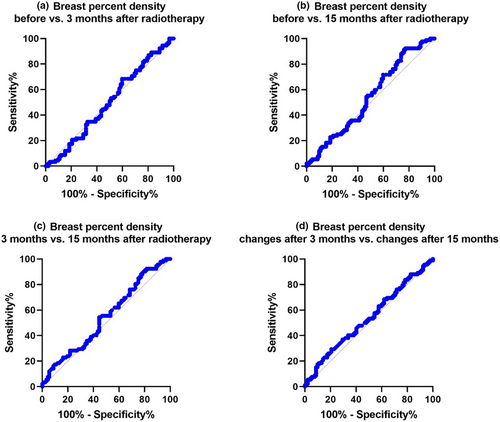
These results are shown in Figure 4a–d, respectively. The sensitivity for ‘before versus 3 months after’ radiotherapy is 68.48%, while for ‘before versus 15 months after’ radiotherapy, it was 92.39%. Maximum sensitivity was achieved ‘before versus 15 months after’. The maximum specificity was seen in ‘before versus 3 months after’, and the specificities for ‘before versus 3 months after’ and ‘before versus 15 months after’ and ‘3 months after versus 15 months after’, but the specificity changed. Therefore, it can be assumed that the sensitivity and specificity values are not high. The sensitivity and specificity of PD changes after 3 months versus PD changes after 15 months were 29.35% and 79.35%, respectively. Again, the sensitivity and specificity levels were not high at the same time. If the objective was to compare PD before and after therapy, longer time intervals for follow-up and screening for PD changes would be more appropriate. Our results also showed that the higher sensitivity value (92.39%) at 15 months compared with at 3 months of follow-up is likely linked to PD changes in breast tissue density (Table 3).
| Parameter | AUC | Cut-off values | Sensitivity (%) | Specificity (%) |
|---|---|---|---|---|
| Before versus 3 months after | 0.5002 | 0.5130 | 68.48 | 40.22 |
| Before versus 15 months after | 0.5401 | 0.4446 | 92.39 | 22.83 |
| 3 months after versus 15 months after | 0.5434 | 0.4448 | 92.39 | 18.48 |
| PD changes after 3 months versus PD changes after 15 months | 0.5357 | 6.533 | 29.35 | 79.35 |
The study did not report any significant change in the SMD between PD before treatment versus PD 3 months after radiotherapy (−0.08, 95% CI −0.37 to 0.19), PD before treatment versus PD 15 months after radiotherapy (−0.26, 95% CI −0.55 to 0.22), and PD 3 months after radiotherapy versus PD 15 months after radiotherapy (−0.22, 95% CI −0.51 to 0.06).
Discussion
This study evaluated the quantitative changes in breast density on digital mammography before and after radiotherapy for BC. The key finding was that there were no statistically significant differences in percent breast density at 3 months or 15 months after radiotherapy compared to baseline. However, there was a numerical increase in mean PD at both time points after radiotherapy. The lack of significant differences could be due to the relatively small sample size of 92 patients, resulting in insufficient power to detect small underlying changes in the density. Nevertheless, the numerical increase in breast density observed here aligns with prior evidence suggesting that radiotherapy can increase breast density, likely due to acute inflammatory effects and subsequent fibrous tissue formation.32-35 Denser breast tissue on mammography makes the detection of small tumours more challenging, and is an independent risk factor for BC.36 Although mammographic density is a reliable indicator of BC risk in populations, one study suggested that it cannot accurately predict BC risk in individuals. Factors such as age, parity, menopausal status, race/ethnicity, and body mass index (BMI) can influence mammographic density.32-34
ROC analysis indicated that a longer interval of 15 months after radiotherapy provided higher sensitivity for detecting changes in density than just 3 months. This suggests that breast density continues to evolve over the first year after radiotherapy. However, even after 15 months, specificity remained low. Larger prospective studies with radiotherapy and non-radiotherapy control groups are required to define the optimal timeline and threshold for clinically meaningful density changes.
According to a previous study, mammographic PD is a highly reliable quantitative value for breast density evaluation as it has a highly acceptable intra-rater agreement.37 Similarly, another study found that OpenBreast showed significant levels of agreement with manual segmentation.20 These findings support the validity of our method for assessing the changes in breast tissue density over time. A study found that mammographic density was significantly associated with survival rates in BC patients with.38 However, our study did not find a clear association between PD and radiotherapy after 15 months, suggesting that further research is needed to investigate this relationship more thoroughly. Similar to our study, another study found an increase in parenchymal density and skin thickness of the breast region after radiotherapy, similar to our study.39
A primary study observed epithelial and vascular alterations in subjects treated with radiotherapy as well as soft tissue changes in both the treatment and control groups.40 Another study reported that decreased mammographic density after BC diagnosis appears to be a prognostic marker for improving the long-term survival rate during adjuvant Tamoxifen treatment.41 However, our study found an overall increase in breast tissue density after radiotherapy, which may be due to differences in treatment protocols or patient populations.
A previous study showed that high breast density and obesity are essential independent predictors of late local recurrence after BCT and radiotherapy.42 However, another group found conflicting data on the relationship between high mammographic density and various cancer-related factors, underlining the need for further studies.43
A recent study used Volpara™ software to analyse mammographic density in Japanese patients and found that measuring mammographic density could enhance the accuracy of BC detection.44 Our study also employed breast densitometry software to quantify density, in line with the growing recognition of the importance of standardised, automated methods for assessing breast tissue density. Another study demonstrated that the automated percentage of breast density measurement is a viable option for future testing in a clinical setting,45 which is in line with our research methodology. Further, there is a need for standardised methods to limit the impact of individual readers' subjective assessments of breast density.46 Using the OpenBreast tool, we aimed to minimise this impact and provide a more objective assessment of breast tissue density changes over time.
Our findings underscore the importance of using standardised automated methods to assess breast tissue density in clinical practice and research. Our study had several strengths, including the use of digital mammography to quantify breast tissue density; the inclusion of patients undergoing surgery, chemotherapy, and radiotherapy; and the evaluation of PD changes over time. However, this study had some limitations. This study had a relatively small sample size, which may have limited the statistical power of the analysis. Although we observed a slight increase in PD at 15 months after radiotherapy, longer follow-up periods may be necessary to detect any significant changes in PD. In addition, this study did not consider other factors that may influence breast tissue density, such as age, menopausal status, or hormonal therapy. Future studies with larger sample sizes, longer follow-up periods, and more comprehensive assessments of breast tissue density and other relevant clinical factors are necessary to fully understand the relationship between breast tissue density and radiotherapy outcomes.
Conclusions
This study investigated changes in breast tissue density using digital mammography in women after BC treatment. We found no statistically significant differences in PD at either 3 or 15-months post-radiotherapy compared to baseline. The minor numerical increase in PD did not translate into statistical significance, possibly due to the small sample size and the retrospective nature of the study. Moreover, this increase aligns with the known radiotherapy effect of density increase through inflammation and fibrosis, which can complicate tumour detection in mammography. This study suggests that PD changes may continue over the first year after radiotherapy. Our study underscores the need for larger studies with longer follow-up periods to enhance our understanding of the changes in PD. It also highlights the potential benefits of standardised quantitative breast density assessments for monitoring the long-term effects of radiotherapy.
Author's Contributions
S.G., S.M., and K.M. contributed to the conception and design of the study. S.M., S.G., and K.M. contributed to the data collection. S.G., S.M., M.M., and H.G. drafted the text and prepared a graphical table of the content. S.M., S.G., and K.M. contributed to revising the manuscript.
Conflict of Interest
The authors declare no financial or other conflicts of interest.
Ethical Approval
This work was adapted from the MD thesis and supported by Hamadan University of Medical Sciences, Hamadan, Iran (Research Code: 30539). Ethical Code (approval ID): IR.UMSHA.REC.1398.434.
Open Research
Data Availability Statement
The data that support the findings of this study are available from the corresponding author upon reasonable request.


