Application of Multiparameter Quantitative Magnetic Resonance Imaging in the Evaluation of Graves' Ophthalmopathy
Grant sources: This study was supported by funding for start of clinical research of Southern Medical University (LC2016PY046); Guangdong Science and Technology Plan Project (2019B020230001).
Abstract
Background
Assessment of the activity of Graves' ophthalmopathy (GO) is difficult. Existing methods need improvement.
Purpose
Investigate the application of multiparametric magnetic resonance imaging (MRI) in GO.
Study Type
Retrospective.
Population
A total of 235 GO patients (age: 38.8 ± 13.4 years; 90 male; 96 active patients).
Field Strength/Sequence
Short-tau inversion recovery (STIR) fast spin echo, multiecho spin echo T2 mapping and 3D T1-weighted fast field echo sequences at 3.0 T.
Assessment
Two physicians assessed the mean and maximum signal intensity ratio of extraocular muscles to white matter (SIR), T2 relaxation time (T2RT), extraocular muscle area (EMA), fat fraction (FF), retrobulbar fat volume (RFV), and extraocular muscle volume (EMV). Clinical activity score (CAS) ≧ 3 was in active stage.
Statistical Tests
The optimal cut-off point of diagnostic efficacy was selected using receiver operating characteristic (ROC) curve analysis and evaluated using area under the curve (AUC), compared using Student's t test, analysis of variance or Kruskal–Wallis H test. The correlation used Pearson correlation analysis. The discriminant equation used a binary logistic regression analysis. P < 0.05 was considered statistically significant.
Results
The SIRmean, SIRmax, T2RTmean, T2RTmax, EMA, and EMV in active GO patients were significantly higher than those in inactive and were positively correlated with CAS (r = 0.276, 0.228, 0.438, 0.388, 0.502, and 0333, respectively). The FFmax of active patients was significantly lower than that of inactive patients and was negatively correlated with CAS (r = −0.44). Logistic regression analysis indicated that T2RTmean was independently associated with GO active periods and had good diagnostic performance (area under ROC curve = 0.736, sensitivity 70.7%, specificity 69.3%). T2RTmean ≧ 74.295 could be a diagnostic cut-off for judging GO activity (sensitivity 55.3%).
Conclusion
SIR, T2RT, EMV, and FF can quantitatively assess the activity and severity of GO and can potentially provide a basis for clinical judgment and selection of treatment options.
Evidence Level
4.
Technical Efficacy
Stage 2.
Graves' ophthalmopathy (GO), also known as thyroid associated ophthalmopathy (TAO), is an autoimmune disease with extensive ocular inflammation and involvement of extraocular muscle function.1 In severe cases, it can lead to blindness or disfigurement.2 Clinical manifestations of GO can be seen in about 25%–50% patients with Graves' disease (GD).3 The Rundle curve showed that the natural course of GO was a biphasic process, including an active stage characterized by orbital inflammation and an inactive stage characterized by fibrosis and repair.4 The key to effective treatment of GO lies in accurate clinical assessment (including active stage and severity of the disease).5 In clinical practice, the clinical activity score (CAS) is mainly used to assess the activity of the disease, but CAS is the evaluation of the symptoms and signs of patients, it is difficult to avoid subjectivity, so that uniformity and accuracy cannot be ensured.6 Therefore, it is desirable to find more reliable and quantifiable parameters of GO activity. Imaging is an alternative method of assessment and has the advantages of being noninvasive and of allowing objective monitoring of the changes in the microstructure of the retrobulbar soft tissue.5
Compared with CT or ultrasound, magnetic resonance imaging (MRI) has important advantages such as nonionizing radiation, high inherent soft tissue contrast, better reflection of tissue water content, and the ability to quantify multiple parameters.7 In recent years, studies have been performed using orbital MRI to quantitatively analyze GO patients.8-13 Currently, the most commonly used imaging sequences are short-tau inversion recovery (STIR),7, 10, 11, 13 T2 mapping,8, 9 and diffusion-weighted imaging (DWI).14-16 Orbital MRI has enabled accurate quantification and can reflect the inflammation, steatosis, fibrosis and other pathological changes of GO.7, 8, 10-12 The microstructural changes of the ocular soft tissue can be detected earlier and more accurately and can be monitored over time.17, 18 Calculation of orbital soft tissue volume using 3D reconstruction of MRI data19 has been shown to be both reliable and accurate, but the relationships between imaging parameters and GO disease activity and severity have not been fully explored.
Thus, the aim of this study was to investigate the application of multiparametric MRI in the clinical assessment of GO patients.
Materials and Methods
Patients
This study had been reviewed by our institutional review board the informed consent requirement had been waived and includes patients with GO who visited the clinic from September 2018 to April 2021. A total of 235 GO patients (260 eyes) who met the inclusion criteria were included in this study (90 males, 4.26% [10/235] with unilateral disease). Subject demographics are shown in Table 1. The diagnosis met Bartley's diagnostic criteria,20 as follows: 1) those with eyelid retraction were diagnosed with one of the following pieces of objective evidence: thyroid dysfunction or dysregulation, extraocular muscle involvement, exophthalmos, and optic nerve dysfunction; 2) those without eyelid retraction had thyroid abnormality or dysregulation combined with at least one of the following clinical features: exophthalmos, extraocular muscle involvement, and optic nerve dysfunction. Patients with other diseases causing similar ocular signs were excluded.
| Characteristics | Results |
|---|---|
| Male/Female | 90 (38.30%)/145 (61.70%) |
| Age (years) | 38.76 ± 13.37 |
| Smoker/nonsmoker, n (%) | 56 (23.83%)/179 (76.17%) |
| Unilateral/bilateral, n (%) | 10 (4.26%)/225 (95.74%) |
| Duration of GD (months) | 13 (6, 36) |
| Duration of GO (months) | 7 (3, 22) |
| Treatment of GD | |
| None, n (%) | 11 (4.68%) |
| Anti-thyroid drugs, n (%) | 176 (74.89%) |
| RAI treatment, n (%) | 42 (17.87%) |
| Thyroidectomy, n (%) | 6 (2.55%) |
| Thyroid function | |
| Free triiodothyronine (pmol/L) | 7.41 ± 5.98 |
| Free thyroxine (pmol/L) | 19.19 ± 15.26 |
| Thyrotropin (uIU/L) | 2.05 ± 5.80 |
| TRAb (IU/L) | 19.92 ± 85.30 |
| Thyroid function status, n (%) | |
| Normal | 85 (36.17%) |
| Subclinical hyperthyroidism | 87 (37.02%) |
| Hyperthyroidism | 34 (14.47%) |
| Subclinical hypothyroidism | 17 (7.23%) |
| Hypothyroidism | 12 (5.11%) |
- RAI = radioactive iodine; TRAb = thyrotropin receptor antibody. Continuous variables with normal distribution are presented as mean ± SD and with skewed distribution presented as median (interquartile ranges), respectively. Categorical variables were summarized as a numerical proportion.
Clinical Data and Evaluation
The clinical data of all patients, including smoking history, high-density and low-density lipoprotein cholesterol (HDL-C and LDL-C), total cholesterol (TC), triglyceride (TG) level, disease course of GD and GO and thyroid function (thyrotropin, thyrotropin receptor antibody [TRAb]) were collected, and ocular assessment and orbital MRI were performed. The exophthalmos was repeatedly measured three times by the same observer using the same Hertel instrument and taken an average. CAS consists of seven items including: spontaneous retrobulbar pain, pain on attempted upward or downward gaze, redness of eyelids, redness of conjunctiva, swelling of caruncle or plica, swelling of eyelids, and swelling of conjunctiva (chemosis).21 One clinical manifestation was scored as 1 point, with a total score of 7 points, with higher scores representing a higher degree of inflammatory response, a score ≥3 points represented a patient in an active stage, and a score change ≥2 points was considered clinically meaningful.22 Disease severity was assessed using the European Group on Graves' Orbitopathy (EUGOGO) classification of severity5 and was classified as mild, moderate–severe and sight threatening.
MRI Acquisition
A Philips Ingenia 3.0 T MR scanner (Ingenia, Philips, Amsterdam, Netherlands) was used for orbital scanning. During the scan, the patient was in a supine position, the head was placed in the head coil, eyes were closed and focused on the front, and eye movements were asked to restrict. A sagittal acquisition coincided with the longitudinal axis of the coil.
Scanning sequences
- STIR fast spin echo sequence: Repetition time (TR) 3219 msec, echo time (TE) 18 msec, field of view (FOV) 14 cm × 14.8 cm, slice thickness 3 mm, slice gap 0.3 mm, matrix 208 × 175. Scan time was 3 minutes, and the images were sent to the PACS system.
- Multiecho spin echo T2 mapping sequence: TR 2000 msec, TE 12, 24, 36, 48, 60, 72, 84, 96 msec, FOV 16 cm × 16 cm, slice thickness 3 mm, slice gap 0.3 mm, matrix 268 × 213. Scan time was 8 minutes 42 seconds, and the images were processed by the Philips Intellispace Portal software workstation.
- Three-dimensional T1-weighted fast field echo (3D-T1-FFE) sequence: TR 25 msec, TE 4.61 ms, FOV 18 cm × 18 cm, slice thickness 0.8 mm, slice interval 0 mm, flip angle 30°, matrix 240 × 239. Scan time was 6 minutes 7 seconds, and the images were sent to the PACS system.
Image processing
- SIR of the extraocular muscle to the ipsilateral white matter: In the coronal slice of the STIR sequence showing the maximum extraocular muscle area (EMA) of each eye, four extraocular muscles (superior rectus, inferior rectus, medial rectus, and lateral rectus) were manually delineated by two observers, and signal intensity measured. For each observer, measurements were repeated three times and an average taken. The signal intensity in ipsilateral white matter regions of interest was also measured three times by each observer and an average take (Fig. 1). The ratio of signal intensity of extraocular muscles to white matter signal (SIR) was calculated, and the mean SIR of the eight extraocular muscles (four for each eye) was recorded as the mean SIR (SIRmean). The maximum SIR of the eight extraocular muscles was the maximum SIR (SIRmax).
- T2 relaxation time (T2RT) and EMA: In the corresponding coronal slice of the T2 mapping sequence, the extraocular muscles were delineated and the mean T2RT (T2RTmean), maximum T2RT (T2RTmax) and EMA were determined (Fig. 2). The sum of the cross-sectional areas of the eight extraocular muscles was the total area (TA), and the maximum EMA was the muscle with the maximum cross-sectional area (MCSA).
- Fat Fraction (FF): After exporting MRI data, a FF image was generated, and the three consecutive slices with the largest cross-sectional areas of the extraocular muscle were used to manually draw ROIs around the extraocular muscles. The whole muscle was included as much as possible, and the FF of each single slice was obtained (Fig. 3). The FF of the extraocular muscle with the most inflammation (i.e. the maximum SIR) was the maximum FF (FFmax) and the mean FF of the eight extraocular muscles was mean FF (FFmean).
- Three dimensional reconstruction of retrobulbar fat and extraocular muscle: MR DICOM data were imported into Mimics 15.0 digital medical processing software (Materialise, Leuven, Kingdom of Belgium), and the retrobulbar fat on the two sides was semi-automatically isolated by the same observers (YS.L and XT.F with 7 and 6 years of experience) and marked as masks with different colors. A new mask, which included retrobulbar fat and extraocular muscles, was established by duplicating the mask of the retrobulbar fat tissue and manually outlining extraocular muscle tissue. The Boolean operations function was used to obtain the extraocular muscle masks of the left and right eyes respectively.19 After selecting the corresponding mask, the 3D calculation tool ‘Calculate 3D’ was used to directly generate a 3D model and to automatically obtain the retrobulbar fat volume (RFV), extraocular muscle volume (EMV), and total volume (TV).
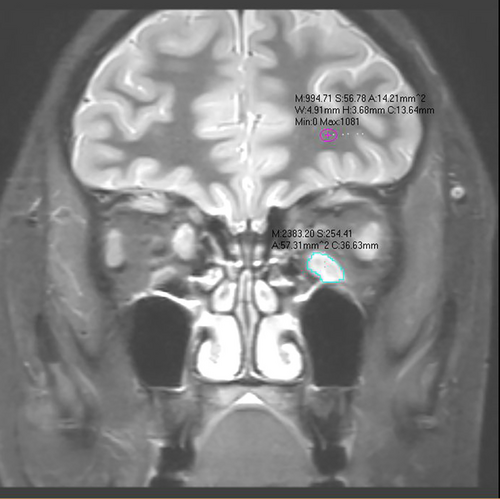
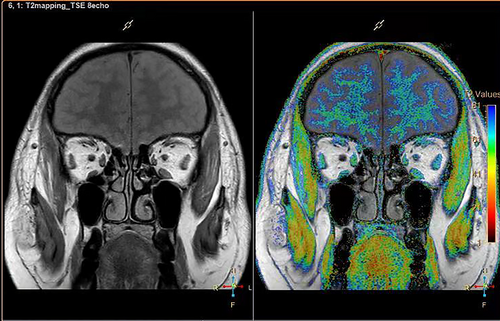
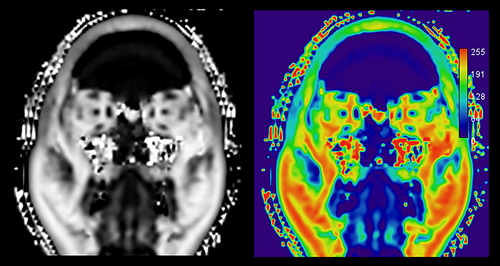
To improve the accuracy of the measurements, they were repeated three times by two physicians (L.Y.S. and F.X.T. with 7 and 6 years of experience, respectively) blind to the measurement each other, who blinded to clinical features.
Statistical Analysis
SPSS 26.0 was used for statistical analysis in this study. All measurement data were tested for normality and homogeneity of variance. Measurement data with normal distributions are represented by mean ± standard deviation, and those with skewed distributions are represented by median (interquartile range). The intraclass correlation coefficient (ICC) and coefficient of variation (CV) were used to test the consistency and repeatability of the two observers. Normally distributed data were analyzed by t test or analysis of variance (ANOVA), and non-normally distributed data were analyzed by nonparametric Kruskal Wallis H test or Mann–Whitney U test. The Pearson correlation coefficient (r) was used to describe correlation between two samples with normal distributions, and the Spearman correlation coefficient was used for correlations of non-normally distributed data. Diagnostic efficacy was assessed using the area under the receiver operating characteristic (ROC) curve (AUC). The Youden index determined the best cut-off point for ROC analyses. A binary logistic regression model was used to establish the equation to determine whether GO was in an active or inactive period. P < 0.05 was considered statistically significant.
Results
Clinical Characteristics
Among 235 patients, 48.51% (114/235) patients had GD onset earlier than the onset of eye disease, with a median time interval of 10 months (1–249 months); 46.81% (110/235) patients had GD and eye disease at the same time and 4.68% (11/235) patients had eye disease earlier than GD, with a median time interval of 3 months (1–108 months). The mean exophthalmos measured by the Hertel exophthalmometer in all patients was 18.29 ± 2.64 mm, and the mean exophthalmos measured by MR was 20.52 ± 2.45 mm, the results were the average of observers, the difference being statistically significant. Among the patients included in this study, 96 were in the active stage of disease. There were no significant differences in the duration of GO, smoking history, and HDL-C levels between the active and inactive groups (P = 0.067, 0.077, and 0.1, respectively), but there were statistically significant differences in the age, male/female ratio, proportion of patients with moderate to severe and vision threatening conditions, TC, LDL-C, and TG levels (Fig. 4, Table S1). There were significant differences in age, CAS, and the proportion of active patients between three EUGOGO groups (mild [N = 77], moderate to severe [N = 153], sight threatening [N = 5]), but there were no significant differences in male/female ratio, GO course of disease, and smoking history (Table S2).

SIR and T2RT in the Assessment of Disease Activity
Good-to-excellent interobserver reproducibility was obtained for the measurements of all the MRI parameters (Table S3).
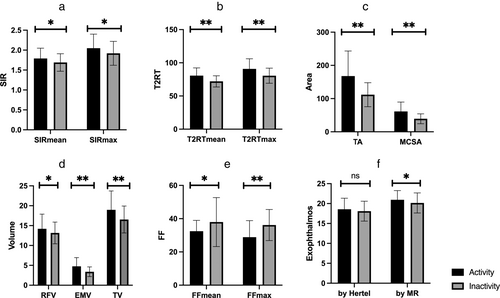
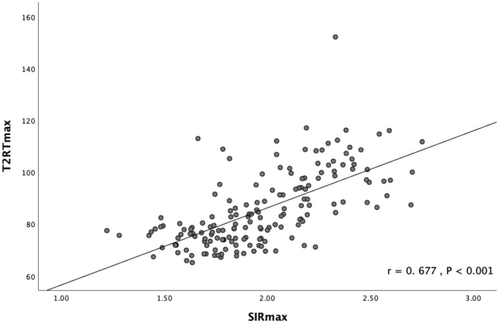
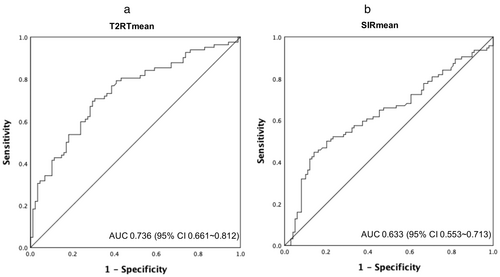
All the parameters measured by MRI in the active patients were significantly different from those in the inactive patients (Fig. 5, Table S4). The parameters measured by MRI were positively correlated with CAS, except for FF which was negatively correlated (Table 2). Looking at the imaging indicators of the most severely affected extraocular muscle alone, the maximum SIR was strongly correlated with the maximum T2RT (r = 0. 677; Fig. 6). The SIR and T2 values of the inferior rectus were the highest. The mean SIR, maximum SIR, mean T2RT, and maximum T2RT of the four extraocular muscles were analyzed by ROC (Table 3). As shown in Fig. 7, when a mean T2RT cut-off of 74.295 msec was used for judging the active phase of GO, the sensitivity was 70.7%, the specificity was 69.3%, and the AUC was 0.736. A mean SIR cut-off of 1.88 resulted in a sensitivity of 44.7%, a specificity of 85.9%, and AUC of 0.633. Logistic regression analysis showed that mean T2RT was independently associated with active GO (Table 4, Fig. 8).
| Parameters | r | P |
|---|---|---|
| SIRmean | 0.276 | <0.001** |
| SIRmax | 0.228 | 0.001* |
| T2RTmean (msec) | 0.438 | <0.001** |
| T2RTmax (msec) | 0.388 | <0.001** |
| TA (mm2) | 0.489 | <0.001** |
| MA (mm2) | 0.502 | <0.001** |
| RFV (mm3) | 0.145 | 0.019 |
| EMV (mm3) | 0.333 | <0.001** |
| TV (mm3) | 0.258 | 0.001* |
| FFmean (%) | −0.230 | 0.002* |
| FFmax (%) | −0.440 | <0.001** |
| Exophthalmos by Hertel (mm) | 0.179 | <0.001** |
| Exophthalmos by MR(mm) | 0.254 | <0.001** |
| TRAb (IU/L) | 0.205 | <0.001** |
- SIR = signal intensity ratio; SIRmean = mean SIR; SIRmax = maximum SIR; T2RT = T2 relaxation time; T2RTmean = mean T2RT; T2RTmax = maximum T2RT; TA = total area; MA = maximum area; RFV = retrobulbar fat volume; EMV = extraocular muscle volume; TV = total volume; FF = fat fraction; FFmean = mean FF; FFmax = maximum FF; TRAb = stimulating thyrotropin receptor autoantibodies.
- * P < 0.05.
- ** P < 0.001.
| Parameters | Cutoff | AUC | Sensitivity | Specificity |
|---|---|---|---|---|
| SIRmean | 1.88 | 0.633 | 0.447 | 0.859 |
| SIRmax | 2.04 | 0.626 | 0.553 | 0.717 |
| T2RTmean (msec) | 74.295 | 0.736 | 0.707 | 0.693 |
| T2RTmax (msec) | 80.1 | 0.713 | 0.72 | 0.64.8 |
- ROC = receiver operating characteristic curve; AUC = area under curve; SIR = signal intensity ratio; SIRmean = mean SIR; SIRmax = maximum SIR; T2RT = T2 relaxation time; T2RTmean = mean T2RT; T2RTmax = maximum T2RT.
| Variables | B | P | OR | 95% CI |
|---|---|---|---|---|
| T2RTmean (msec) | 0.099 | <0.001 | 1.104 | (1.060, 1.150) |
| Constant | −7.591 | <0.001 | 0.001 |
- T2RT = T2 relaxation time; T2RTmean = mean T2RT.

Correlations With Disease Severity
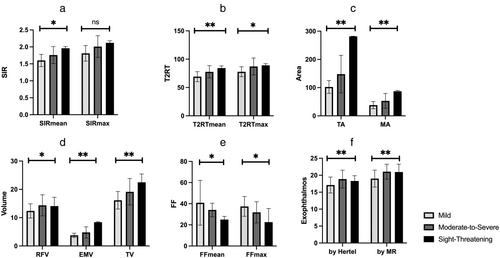
Except for the maximum SIR (P = 0.139), there were statistically significant differences in the other indicators among the mild, moderate–severe, and vision-threatening groups (Fig. 9, Table S5). Correlation analysis showed that the mean SIR, maximum SIR, mean T2RT, maximum T2RT, TA, MA, RFV, EMV, TV, exophthalmos, maximum FF, mean FF, and TRAb level were significantly correlated with disease severity (Table 5). Correlation with disease severity was positive for all variables except mean FF and max FF.
| Parameters | r | P |
|---|---|---|
| SIRmean | 0.265 | <0.001** |
| SIRmax | 0.211 | 0.003* |
| T2RTmean (msec) | 0.344 | <0.001** |
| T2RTmax (msec) | 0.310 | <0.001** |
| TA (mm2) | 0.419 | <0.001** |
| MA (mm2) | 0.361 | <0.001** |
| RFV (mm3) | 0.174 | 0.005* |
| EMV (mm3) | 0.373 | <0.001** |
| TV (mm3) | 0.298 | <0.001** |
| FFmean (%) | −0.249 | 0.001* |
| FFmax (%) | −0.335 | <0.001** |
| Exophthalmos by Hertlel (mm) | 0.330 | <0.001** |
| Exophthalmos by MR (mm) | 0.325 | <0.001** |
| TRAb | 0.140 | 0.004* |
- SIR = signal intensity ratio; SIRmean = mean SIR; SIRmax = maximum SIR; T2RT = T2 relaxation time; T2RTmean = mean T2RT; T2RTmax = maximum T2RT; TA = total area; MA = maximum area; RFV = retrobulbar fat volume; EMV = extraocular muscle volume; TV = total volume; FF = fat fraction; FFmean = mean FF; FFmax = maximum FF; TRAb = stimulating thyrotropin receptor autoantibodies.
- * P < 0.05.
- ** P < 0.001.
Discussion
In this study, we provided a clinical study with 235 patients with GO to investigate the application of orbital MRI multiparameter quantification in the assessment of GO and indicated that the mean T2RT value was an independent predictor for identifying the active period of GO. Multiple parameters of MRI combined with CAS can more accurately assess the activity of GO.
CAS is commonly used to assess the activity of GO, but due to its own subjectivity and the heterogeneity of GO, its comparability may be reduced, and some objective indicators are needed to balance it.13, 23 Based on our clinical experience, it is acceptable to use CAS scores for assessments in the same patient, but it is not effective as a method of comparison between patients. Its clinical application is therefore limited. Orbital MRI plays an important role in the diagnosis of GO and in the assessment of retrobulbar inflammatory status due to its high soft tissue contrast and quantification of multiple parameters. The STIR sequence suppresses the fat signal, while fluid-filled tissue is hyperintense. The orbital tissue in active GO shows hyperintensity on the STIR sequence due to inflammatory edema. The SIR in active GO patients has been shown to be significantly higher than in inactive patients and healthy controls, and SIR has been shown to be closely related to CAS.10, 11, 13, 24 However, the optimal diagnostic cut-off point of SIR in the active phase has not yet been clarified. T2-weighted imaging (T2WI) is a sequence for evaluating edema, inflammatory infiltration, and hemorrhage in MRI. The application of a T2 mapping sequence can not only measure T2RT to quantitatively reflect the state of inflammation but can also qualitatively assess extraocular muscle and adipose tissue.25 Hou et al9 used a T2 mapping sequence to measure T2RT in patients with GO, and the results suggested that CAS combined with T2 mapping could improve the sensitivity of assessing GO activity and could be used to predict and assess the treatment response to methylprednisolone. In this study, we used MRI data and 3D reconstruction to calculate RFV, EMV, and total volume.19 A recent study12 has also used CT and MR to measure orbital fat volume, and the correlation between CT and MR was favorable. In our study, it was shown that both SIR and T2RT were associated with the assessment of GO activity. The mean T2RT value was independently associated with GO activity. SIR, T2RT, TA, and EMV were all positively correlated with activity and severity, and FF was negatively correlated with activity and severity. This suggests that SIR, T2RT, EMV, FF, and other parameters of orbital MRI have potential to quantitatively assess the activity and severity of GO, providing a basis for clinical judgment and selection of treatment.
The average exophthalmos measured by the Hertel exophthalmometer in this study was similar to that in previously published studies from Japan, Singapore, Taiwan, and other East Asian regions.26-28 The normal exophthalmos varies with ethnicity, which may be related to differences in orbital structures.28 The Hertel exophthalmos meter measures exophthalmos from the lateral orbital margin to the corneal surface and perpendicular to the frontal plane.29 While it is the most widely used device for measuring exophthalmos, it has low reliability and accuracy.30 Differences in measurements may be related to foot plate misalignment, strabismus, lateral orbital rim asymmetry, soft tissue compression, parallax errors, or lack of uniform measurement.30 The mean exophthalmos measured by MRI in this study was significantly different from that measured by the Hertel exophthalmos meter. This is consistent with the results of Huh et al31 using CT. This difference may be due to different patient positions during the examination (Hertel ophthalmometer is used in the sitting position and MRI is in the supine position), skin, and soft tissue differences on the lateral orbital edge plane where the reference point of Hertel ophthalmometer foot plate is located (due to swelling, surgery, etc.) and interobserver variation. The measurement of exophthalmos by imaging can improve on the measurements of Hertel exophthalmometer. In our study, to reduce the measurement error, during the scan, the patient's head was placed in the head coil, eyes were closed and focused on the front, and eye movements were asked to restrict. Subsequent studies should be performed to establish the normal range of exophthalmos using imaging in the normal population and in GO patients to further improve the management of GO.
TRAb and hypercholesterolemia are also risk factors affecting the occurrence and development of GO.3 In this study, the levels of TRAb, total cholesterol, LDL-C and triglyceride in active patients were higher than in inactive patients, which is consistent with previous studies.32-34 This suggests that for GD patients with high TRAb level, we should be more cautious in choosing radioactive iodine therapy, pay attention to maintaining the stability of thyroid function, avoid smoking, and also regularly monitor the blood lipid level and correct hyperlipidemia in order to reduce the occurrence and development of GO.3, 26, 35
In this study, less than 5% of patients had unilateral disease, which is lower than the 9%–34% reported in non-Chinese literature.3 This may be related to differences in case composition. Approximately, 15% of patients had bilateral disease with asymmetric severity, and approximately 10% of patients had bilateral disease with different activity stages. According to previous studies,3, 36-38 the prevalence ranges from 4% to 36%, and asymmetric onset may be a marker of more severe and active disease. There are also studies showing that GO patients with euthyroidism or hypothyroidism tend to have milder and more asymmetric forms of the disease.39, 40 However, unilateral/asymmetric GO may sometimes develop into bilateral disease,41 prompting clinicians to pay attention to differential diagnosis, especially from other orbital diseases, such as inflammatory pseudotumor, carotid cavernous fistula, epidermis cyst.
Limitations
This was a cross-sectional study and changes of MRI parameters before and after treatment were not assessed. It was also a retrospective and single center study introduces inherent biases. There were only five patients in the sight-threatening category. In addition, the cut-off values for related MR parameters to assess GO activity have not been fully established.
Conclusion
This study showed that multiple quantitative MRI parameters were associated with the activity and severity of GO. The mean T2RT value was most strongly associated with identification of the active period of GO. Multiple parameters of MRI combined with CAS may have potential to more accurately assess the activity of GO and better guide clinical diagnosis and treatment.
Author Contributions
J.S. and Z.L. designed the study; Q.Z. and C.W. selected the cases and screened the data base; Q.Z. and Z.C. inputted the data; Y.L. and X.F. assessed the MR image; Z.L. and Y.L. analyzed the data; Z.L. wrote the manuscript; J.S. revised the manuscript. All authors read and approved the final manuscript.
Acknowledgments
The authors would like to thank Dr Quan Zhou, Dr Xiaodong Zhang (Department of Radiology, The Third Affiliated Hospital of Southern Medical University, Guangzhou, China) and Dr Shengli An (Department of Biostatistics, School of Public Health, Guangdong Provincial Key Laboratory of Tropical Disease Research, Southern Medical University, Guangzhou, China) for their constructive comments.
Conflict of Interest
The authors declare that they have no competing or financial interests regarding the submitted article.
Disclosure Statement
The authors have nothing to disclose.


