Increased protein–thiol solubilization in sweet wort by addition of proteases during mashing
Abstract
The flavour stability of beer is of major concern for breweries and is closely linked to oxidative processes in the beer. In this study, a new approach to boost the antioxidative capacity of beer was investigated. Protease treatment during mashing was performed in order to solubilize or extract more thiol-containing protein-derived compounds into the wort. Five different proteases were tested, and they were all capable of solubilizing increased amounts of thiols in wort during mashing but with different efficiencies. The wort was characterized by measuring total nitrogen by Kjeldahl, protein concentration by the Bradford method and protein composition by SDS–PAGE, in combination with matrix-assisted laser desorption ionization–mass spectrometry. The results indicated that the proteases increased thiol concentrations by solubilizing thiol-containing peptide fractions and not full-length proteins. Copyright © 2014 The Institute of Brewing & Distilling
Introduction
Oxidation of beer causes quality deterioration by reducing beer freshness and increasing the compounds that result in a stale flavour 1. Sulphite is produced by the yeast during beer fermentation and is an effective antioxidant in beer 2, 3, but protein thiols, which are derived from cysteine residues in proteins, are also believed to possess antioxidative capacity in the beer during storage 4-6. The concentration of thiols has been shown to correlate to oxidative stability determined by electron paramagnetic resonance spectroscopy 7, and long-term stored beers that were depleted of sulphite but contained reduced protein thiols have been found to be surprisingly flavour stable 5. It is well known that thiols, such as the tripeptide glutathione (GSH), are highly efficient antioxidants in living cells and work by reacting with reactive oxygen species through both non-radical and radical reactions 8. Rogers and Clarke 4 suggested that thiols react as catalysts in the removal of H2O2 in beer, and recently it was established that thiols are also capable of reacting at very fast rates through a radical reaction with the 1-hydroxylethyl radical, which is known to be the main radical species formed during beer aging processes 9. Scavenging of the 1-hydroxylethyl radical prevents the formation of other reactive oxygen species that induce further oxidative damage. The rates of scavenging the 1-hydroxylethyl radical by thiols were found to be competitive with the degradation of hop bitter acids and therefore likely to protect against oxidation mediated by the 1-hydroxylethyl radical 9. Therefore, increasing the concentration of protein thiols in the beer could be a means to increase the oxidative stability of the beer.
During the malting of barley, storage proteins are released and degraded by proteases activated in the barley 10, and an additional degree of protein is solubilized during mashing 11. The barley proteins are initially solubilized by endoproteases (hydrolysing internal peptide bonds in proteins) and then are further degraded by exoproteases (hydrolysing either the N- or C-terminal peptide bonds of polypeptides) 10. The proteins must be degraded to amino acids and small peptides to provide sufficient nutrients for brewing yeasts to grow, but a complete degradation is not desirable as the proteins contribute to foaming ability and mouth feel 10. During malting and brewing, proteins will degrade or precipitate owing to several heating steps, and the proteins that end up in the final beer have been shown to be heat-stable proteins, rich in disulphide bonds, that stabilize the protein structure 12. The most abundant protein in beer is protein Z (two cysteine residues) followed by Lipid Transfer Protein 1 (LTP1) (8 cysteine residues) 13, and the major contribution to the protein thiol concentration in beer is therefore believed to be derived primarily from LTP1. The protein structure of native barley LTP1 is stabilized by four disulphide bonds, but during fermentation these disulphides are reduced to thiols 14. LTP1 isolated or purified from beer has been found to exhibit high antioxidative activity in two different antioxidant assays 5, as well as being a highly efficient scavenger towards the 1-hydroxylethyl radical 9. These results suggest that LTP1 is an important protein in relation to the hypothesis about protein thiols being antioxidants in beer. A number of trypsin/α-amylase inhibitors have also been identified in beer 12, 15, and these proteins contain between six and 12 cysteine residues according to the NCBI protein database, so they could also contribute significantly to the thiol concentration in the beer.
The naturally occurring malt proteases have been shown to solubilize proteins according to the following order cysteine ≈ metallo > aspartic > serine ≈ 0 11. Recently, it was shown that treating wort with different commercially available proteases increased the extract yield and the free amino nitrogen, resulting in an increased fermentation performance of the yeast and in concentrations of flavour volatiles 16. In the current study, the ability of different endoproteases (one cysteine protease, two metalloproteases and two serine proteases) to release and solubilize more protein, through addition during mashing, was investigated in order to increase the amount of antioxidative protein-derived thiols in the wort. The protein composition of the obtained worts was subsequently characterized.
Materials and methods
Chemicals
ThioGlo 1® fluorescent thiol reagent was obtained from Berry & Associates Inc. (Dexter, MI, USA). Acetonitrile, GSH, 1-octanol, tris(2-carboxyethyl)phosphine (TCEP), and HCl were purchased from Sigma-Aldrich (St Louis, MO, USA). Tris(hydroxymethyl)amino methane (tris), trifluoroacetic acid (>99.8%) and CaCl2 · 2H2O were obtained from Merck (Darmstadt, Germany). NuPAGE® Novex 12% bis–tris gels, LDS sample buffer, MES running buffer, Mark 12™ unstained standard and Molecular Probes SYPRO® Ruby Protein Gel Stain were obtained from Invitrogen, CA, USA. Dithiothreitol and acetic acid were obtained from Applichem GmbH, Darmstadt, Germany. Iodoacetamide was from Acros Organics, Geel, Belgium. Bradford Bio-Rad Protein Assay Reagent was obtained from Bio-Rad Laboratories, Hercules, CA. Bovine Serum Albumin (BSA) standard of 2.0 mg/mL was obtained from Thermo Fisher Scientific Inc. (Rockford, IL, USA). Ethanol (96%) was obtained from Kemetyl (Køge, Denmark). Trypsin was from Promega (Madison, WI, USA) and NH4HCO3 was from ICN (Aurora, OH, USA). All chemicals were of analytical grade or highest possible purity. Water was purified through a Milli-Q water purification system (Millipore, Billerica, USA).
Proteases
Five different proteases were obtained from Novozymes A/S (Bagsværd, Denmark); one cysteine protease, two metalloproteases, two serine proteases and their characteristics are listed in Table 1.
| Protease | Type | Origin | MEROPS classification | IUBMB classification |
|---|---|---|---|---|
| P1 | Metalloprotease (Bacillolysin) | Bacillus amyloliquefaciens | Clan MA, family M4 M04.014 (identifier) | EC 3.4.24.28 |
| P2 | Serine protease | Nocardiopsis prasina | Clan PA, family S1E | EC 3.4.21.0 |
| P3 | Cysteine protease (Cathepsin L-like) | Zophobas atratus | Clan CA, family C1A | EC 3.4.22.15 |
| P4 | Metalloprotease (acid) | Thermoascus aurantiacus | Clan MA, family M35 | EC 3.4.24.0 |
| P5 | Serine protease | Bacillus licheniformis | Clan PA, family S1B | EC 3.4.21.19 |
Mashing
Mashing was carried out with a pilsner malt (dry matter of 95.18%) obtained from DMG A/S (Vordingborg, Denmark) on a mashing system (Lochner Labor und Technik GmbH, Berching, Germany) according to Analytica EBC 17 with a few modifications. Malt was milled on a Buhler Universal-type DLFU set to 0.2 mm (Braunschweig, Germany). Malt (50 g) was weighed out in each beaker and CaCl2 was added to a final concentration of 2.0 mm together with 200 mL of deionized water heated to 52°C. The beakers were placed in the mashing bath, and enzyme was added at a concentration of 50 mg enzyme protein/kg malt based on dry matter. Only CaCl2 and deionized water were added to the controls and each control and enzyme treatment were prepared in doublets. The mashing was initiated just after addition of the enzyme and the mashing profile was as follows: 15 min at 52°C, 30 min at 64°C, 30 min at 72°C, 10 min at 78°C, and 10 min at 95°C. The step at 95°C for 10 min was included to ensure that all proteases were inactivated at the end of mashing. After mashing, the samples were cooled to 25°C and each beaker was adjusted to 300 g to compensate for any water evaporation during mashing. The samples were filtered using folded filter paper (597 1/2, GE Healthcare, Buckinghamshire, UK), and after exactly 5 min of filtration, two aliquots of 1 mL of filtered wort were quickly frozen in liquid nitrogen and kept at −20°C until analysis. The remaining sample material was filtered for 90 min, and total yield, pH, Plato and turbidity were determined. The total yield was determined by weight, Plato was determined using an Alcolyzer Plus (Anton Paar GmbH, Graz, Austria), pH was determined using a pH meter (Meter Lab), and turbidity by a 2100AN turbidimeter (Hach, Loveland, CO). The remaining wort was stored at −20°C until analysis.
Spent grain was dried overnight in an oven at 60°C and subsequently milled, similarly to the malt. The spent grain was stored at −20°C until analysis.
Determination of protein and total nitrogen
The protein concentration of the beers was determined using the Bio-Rad Protein Assay Dye Reagent Concentrate based on the Bradford method according to the manufacturer's procedure with a few modifications. Bradford working reagent was prepared on the day of analysis by diluting the Protein Assay Dye Reagent Concentrate five times with Milli-Q water. Samples were prepared in triplicates by mixing 5 μL thawed wort sample and 1000 μL Bradford working reagent. The samples were incubated at room temperature and absorbance at 595 nm was read after exactly 15 min using microcuvettes and an Ultrospec 2100 pro (Amersham Biosciences, GE Healthcare, Freiburg, Germany). Protein concentration was determined from a standard curve prepared with 0–5 µg/mL BSA (final concentration), where BSA standard solutions were added to the samples instead of wort sample. Total nitrogen was determined on samples of wort and spent grain by the Kjeldahl method according to Analytica EBC 18.
Determination of the free and total thiol concentration
Free and total (free and reducible) thiol concentrations were determined by the procedure described by Lund and Andersen 7 using the fluorescent ThioGlo® 1 reagent with a few modifications.
An external standard curve of GSH was prepared in concentrations between 0 and 20 µm in 0.25 mm tris buffer (pH 7.5). For determination of total thiol concentrations, the disulphide reductant TCEP was added to wort samples in a final concentration of 1.92 mm and incubated for 5 min. Free and total thiol concentrations were determined by derivatization with ThioGlo 1 for exactly 5 min and measurements of fluorescence (λex = 390 nm, λem = 510 nm). Any possible interaction between TCEP and the maleimide group of ThioGlo 1 19 was controlled by background correction with a blank sample of ThioGlo 1 and TCEP in the applied concentrations. The free and total thiol concentrations were quantified from the external standard curve of GSH.
SDS–PAGE
Wort samples were analysed by gel-electrophoresis using NuPAGE® Novex 12% Bis-tris Gels according to the manufacturer's instructions. Loading samples were prepared with the same volume of each wort sample, and 0.1 m dithiothreitol (final concentration) was added to reduce the samples. All loading samples were heated at minimum 70°C for 10 min before loading to the gel. Aliquots of 10 μL loading sample containing 5 μL thawed wort were loaded to the gel, and aliquots of 3 μL Mark 12™ unstained standard were loaded to each gel. Electrophoresis was run at 200 V for 35 min in cassettes containing ice-cold MES running buffer. Following electrophoresis, the gels were fixed in a solution containing 50% ethanol and 7% acetic acid for 30 min on a rocking table, after which the fix solution was exchanged and left overnight at room temperature. The gels were stained by the fluorescent SYPRO® Ruby Protein Gel Stain overnight, washed with a solution of 10% ethanol and 7% acetic acid for 30 min and subsequently washed twice with Milli-Q water for 5 min, and photographed by a charge-coupled device camera (Raytest, Camilla II, Straubenhardt, Germany).
Identification of proteins from SDS–PAGE analysis by mass spectrometry
The Sypro Ruby stained protein bands were visualized with UV light and selected protein bands were cut out of the gel and digested with trypsin. The resulting peptides were analysed with matrix assisted laser desorption ionization-time-of-flight mass spectrometry (MALDI-TOF MS). In-gel digestion was performed as described by Jensen et al. 20. Custom-made chromatographic columns were used for desalting and concentration of the peptide mixture prior to mass spectrometric analysis 21. The proteins were identified with the use of a MALDI-TOF-TOF instrument (4800 Proteomics analyser, Applied Biosystems, Foster City, CA, USA). Both MS and MS/MS spectra were obtained and the proteins were identified using the Mascot database search program (Matrix Science, http://www.matrixscience.com) using the NCBInr database (National Centre for Biotechnology Information, http://www.ncbi.nlm.nih.gov/). The searches were not restricted regarding taxonomy. The mass tolerance was limited to 70 ppm for peptide mass fingerprinting and to 0.6 Da for peptide sequence data.
Amino acid analysis
The accurate protein concentration was determined of selected wort and spent grain samples by amino acid analysis using the AccQTaq Ultra UPLC method (Waters Corp, Milford, MA, USA). Wort or spent grain proteins were hydrolysed by drying aliquots of 25 μL or 25 µg of sample in a speed vac at 55°C for 45 min followed by incubation with 100 μL of a solution containing 18.5% HCl and 0.1% phenol for 16 h at 110°C. After hydrolysis, the samples were dried again in a speed vac at 55°C for 2 h. Aliquots of 150 μL 100 mm HCl were added to samples, which were shaken for 60 min using an orbital shaker and centrifuged at 5000 rpm for 10 min. Derivatization of hydrolysed samples was performed by mixing 70 μL of AccQ Taq Ultra Borate Buffer and 10 μL of sample followed by the addition of 20 μL AccQ Taq Ultra reagent with immediate mixing. Blank samples were prepared by mixing 80 μL of AccQ Taq Borate Buffer with 20 μL of AccQ Taq Ultra reagent. Amino acid calibration standards were prepared by mixing 200 μL of Waters Amino Acid Hydrolysate Standard with 800 μL Milli-Q water. The derivatized amino acids were separated by UPLC (Waters Corp., Milford, MA, USA) on an AccQ Taq Ultra Column (1.7 µm, 2.1 × 100 mm) set to 55°C with AccQ Taq eluents A and B (50:50) with a flow of 0.7 mL/min.
Data analysis
Statistical analysis was performed using SAS® 9.2 package (SAS Institute Inc., USA). Data were analysed by analysis of variance using PROC GLM. Means were used to compare differences and least significant difference was applied to compare the mean values. The significance level was p < 0.05.
Results and discussion
Basic wort characteristics and total nitrogen
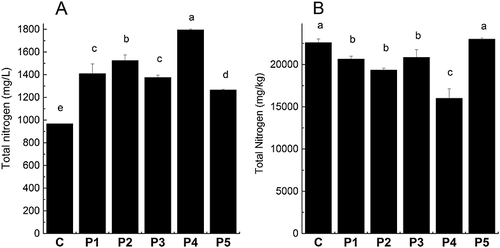
The addition of protease at beginning of mashing did not result in a significant change in pH or total yield (Table 2). Hydrolysis of wort proteins can cause a decrease in pH, but this was not the case in the present study, probably owing to the buffering capacity of the wort itself. Plato, which is a measure for total extract, increased significantly for all protease treatments. Turbidity also increased for P1, P2 and P3, which was probably caused by an increased amount of peptides in the wort. Determination of the amount of total nitrogen by the Kjeldahl method (Fig. 1) shows that all applied proteases increased the amount of total nitrogen in the wort (by 31–85% compared to the control) and decreased the amount of total nitrogen in the spent grain (except for P5), with P4 being the most efficient protease and P5 the least efficient protease. These results are in good agreement with the results for Plato.
| Sample | pH | Total yield (g) | Plato (%, m/m) | Turbidity (NTU) |
|---|---|---|---|---|
| C | 5.83 | 188 ± 2 | 13.30 ± 0.06c | 6 ± 1c |
| P1 | 5.79 | 195 ± 1 | 13.48 ± 0.05a | 10 ± 2a |
| P2 | 5.79 | 196.2 ± 0.4 | 13.48 ± 0.01a | 8.3 ± 0.5ab |
| P3 | 5.82 | 192 ± 4 | 13.50 ± 0.01a | 8.6 ± 0.4ab |
| P4 | 5.80 | 191 ± 7 | 13.55 ± 0.00a | 6.7 ± 0.8bc |
| P5 | 5.80 | 195 ± 2 | 13.38 ± 0.01b | 7.0 ± 0.7bc |
- Values are given as mean ± standard deviation based on two mashings. Means within the same column bearing different letters are significantly different (p < 0.05).
Thiol concentrations
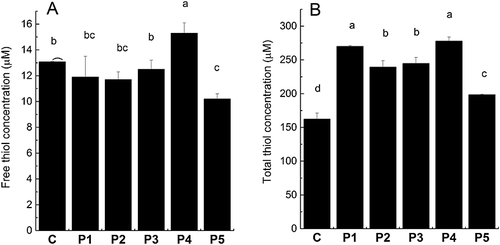
The primary goal of the present work was to increase the amount of antioxidative thiols in the wort. Therefore thiol determination of the wort samples was performed. However, since the EBC congress mashing and the following filtration are performed in open beakers with access to atmospheric air, the thiols are often oxidized during this process to values below the detection limit of the method (data not shown). Oxidation of thiols during mashing has previously been shown to increase in the presence of oxygen 22, 23. Therefore, wort samples were collected after precisely 5 min of filtration and quickly frozen in liquid nitrogen to avoid as much oxidation as possible. This procedure resulted in free thiol concentrations of 10–16 µm, which can be seen in Fig. 2(A). These results also show that P4 increases the free thiol concentration, while the other proteases show either no effect or a decreasing effect on the free thiol concentrations. Owing to the mashing under atmospheric air and thereby the possibility of thiol oxidation during mashing, the wort samples were reduced with the disulphide reducing agent, TCEP (Fig. 2B). These results provided significantly higher thiol concentrations (150–280 µm), and showed that all proteases efficiently increased the total thiol concentrations by 22–71% compared with the control, with P1 and P4 being most effective, followed by P2 and P3 and finally P5.
The concentration of free thiols in wort has been determined in previous studies, but the values are not comparable to the present study since they have been given as relative values, as absorbance values or as micromoles 22-24. Values of total thiol concentrations were significantly higher than the values reported by Hoff et al. 25, who found 60–100 µm total thiols, but this may be explained by the differences between the mashing programs used by Hoff et al. 25 and in the present study.
The free thiol concentration in twelve different beers has previously been quantified to be 13–46 µm 7. This concentration is dependent not only on the protein concentration but also on the redox status of the beer. The heat-stable malt proteins that are preserved during brewing and end up in the beer are typically disulphide-rich proteins 12. In order for the disulphides to be reduced and active as thiol antioxidants, they need to be reduced during fermentation and then preserved by an oxygen-limited bottling. Thus the total amount of thiols determined in the present study, after reduction with TCEP, is the maximum potential of thiols provided in the wort.
Protein concentration and composition
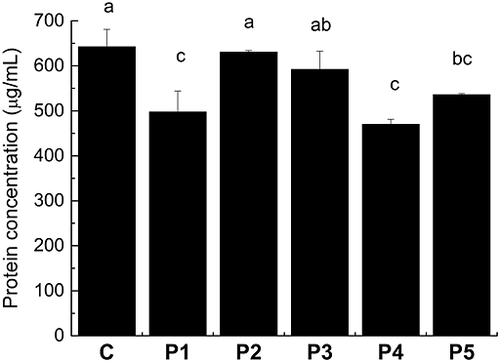
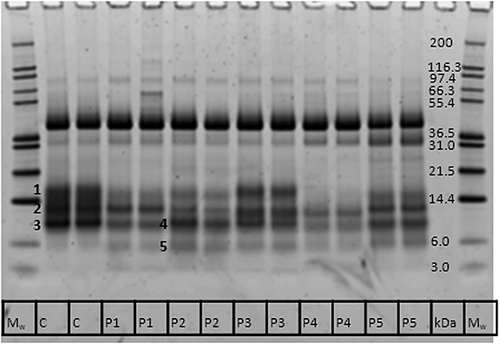
In order to obtain a better understanding of the effect and consequence of protease treatments, the protein concentration and composition were investigated. Protein concentration was determined by the Bradford method, which only includes proteins of at least 3 kDa 26, and these results show that most of the proteases decrease the protein concentration, indicating that the wort proteins were degraded (Fig. 3). This is evident from an SDS–PAGE analysis, where it can be observed that, in particular, proteins below 20 kDa were degraded when proteases were added at beginning of mashing, but to a very different extent, depending on the protease (Fig. 4). The majority of the proteins <20 kDa were degraded almost completely by P4, to a lesser extent by P1 and P2, and an even lesser extent by P5 and P3. The protein band located between the 36.5 and 55.4 kDa markers has previously been identified by mass spectrometry as protein Z, with a molecular mass of ca. 40 kDa 27. The band just below protein Z has also been identified as protein Z, and the intensity of this band is therefore a result of protein Z degradation, which is very intense for P5 and to a lesser extent for P4. A quantification of pixel intensity of the 40 kDa protein Z band shows that P1–P4 increase protein Z concentration (by 25–35% compared with control), while P5 reduces its concentration (by 27% compared with control; data not shown). Protein Z only contains two Cys, but since it is the most abundant protein in beer, the thiol concentration may be affected by increased solubilization or degradation of this protein by the protease treatments.
| Band no. | Identified protein | Accession number | Score | Mass (Da) | Sequence coverage (%) | Number of matched peptides | Number of Cys |
|---|---|---|---|---|---|---|---|
| 1 | Trypsin inhibitor CMe precursor | gi|1405736 | 97 | 16,341 | 36 | 3 | 10 |
| CMd preprotein (AA 14–146) | gi|758343 | 180 | 17,894 | 45 | 5 | 10 | |
| α-Amylase/trypsin inhibitor CMb | gi|585290 | 153 | 17,199 | 43 | 7 | 12 | |
| α-Amylase/trypsin inhibitor CMa | gi|585289 | 98 | 16,060 | 29 | 4 | 10 | |
| 2 | α-Amylase/trypsin inhibitor CMb | gi|585290 | 277 | 17,199 | 43 | 12 | 12 |
| Barwin | gi|114832 | 118 | 14,071 | 22 | 3 | 6 | |
| Trypsin inhibitor CMe precursor | gi|1405736 | 116 | 16,341 | 36 | 4 | 10 | |
| 3 | α-Amylase inhibitor BDAI-1 | gi|123970 | 408 | 17,045 | 52 | 7 | 11 |
| Trypsin/amylase inhibitor pUP38 | gi|225103 | 92 | 12,417 | 11 | 2 | 7 | |
| 4 | α-Amylase inhibitor BDAI-1 | gi|123970 | 366 | 17,045 | 40 | 4 | 11 |
| Lipid transfer protein 1 | gi|47168353 | 102 | 10,145 | 36 | 2 | 10 | |
| 5 | α-Amylase inhibitor BDAI-1 | gi|123970 | 82 | 17,045 | 21 | 3 | 11 |
Since LTP1 has been documented to have antioxidative capacity in previous studies 5, 9, it was relevant to know if the proteases altered the concentration of LTP1 in the wort. Therefore, proteins in the most distinct bands <20 kDa were identified by mass spectrometry to ascertain in which band LTP1 was present, and these bands are marked by numbers 1–5 in Fig. 4. Most of the proteins located from 10 to 20 kDa were found to be α-amylase and/or trypsin inhibitors, but LTP1 and barwin were also identified (Table 3). These proteins have previously been identified in wort and beer by two-dimensional gel electrophoresis and mass spectrometry 12, 15, 28, and contain between six and 12 thiol-containing Cys residues. LTP1 was identified in band number 4 of the P2 wort together with the α-amylase inhibitor BDAI-1. Surprisingly, LTP1 was not identified in the corresponding band of the control wort (band number 3), where only BDAI-1 and the trypsin/amylase inhibitor pUP38 were found. Since LTP1 has been identified in wort in previous studies, it is reasonable to assume that LTP1 is also present in the control wort, but that the lack of identification in band number 3 of the control wort is caused by a higher concentration of other proteins in band number 3. Hereby an easier identification of LTP1 in band number 4 of the protease-treated wort is obtained because, these other proteins are degraded either partly or completely. This assumption can be supported by two observations: (a) the band intensity of band number 4 was lower than that of band number 3, showing that there is less protein in band number 4; and (b) BDAI-1 was also identified in band number 5, showing degradation of BDAI-1 by the protease treatment, since this band was not present in the control wort. However, since several proteins were identified in the same protein bands, as shown in Table 3, it is not possible to conclude if the proteins increase or decrease in concentration as the protease treatment may have reversed effects on different proteins in the same band, which may eliminate the difference in protein concentration of that band.
Some of the identified proteins in wort are precipitated during wort boiling and are therefore not present in beer. The α-amylase/trypsin inhibitors CMa and CMc have been found to precipitate during boiling 28, and these two proteins together with CMd have not been identified beer 15, showing that these three thiol-containing proteins are lost during the brewing process. However, the protease treatments may influence protein precipitation during wort boiling by degrading proteins that then may become more soluble and may not precipitate during boiling, but this would have to be verified by determination of the protein composition in boiled wort that was treated with protease during mashing.
The metalloproteases P1 and P4 proved to be the most efficient proteases for increasing thiols in wort (Fig. 2B), but the composition of proteins in the obtained worts was found to be different. Comparison between total nitrogen in wort (Fig. 1A) and the protein concentration determined by the Bradford method (Fig. 3) shows that the total amounts of proteins are comparable for the P1 and P4 wort, while total nitrogen is higher for the P4 wort, indicating a higher concentration of peptides than in the P1 wort. The total thiol concentration (Fig. 2B) is relatively consistent with the total nitrogen concentration (Fig. 1A) for P2–P5 worts, while the P1 wort has a higher total thiol concentration relative to total nitrogen concentration than the other protease-treated worts. Since P1 provides less total nitrogen than P4 but the same concentration of thiols, this indicates that (a) P4 degrades more protein into peptides than P1 and/or (b) P4 extracts more thiol-containing peptides from the malt. The first suggestion is supported by the SDS–PAGE analysis, showing that the proteins of 10–20 kDa are more degraded by P4 than P1. However, the results of total nitrogen showing an increased concentration of total nitrogen in the wort and a decreased concentration of total nitrogen in the spent grain support the second suggestion, indicating an increased extraction of thiol-containing peptides from malt. Taking all of the data into consideration, it is likely that a combination of the two possibilities is occurring.
Both the Kjeldahl and the Bradford methods are relatively unspecific methods, so in order to determine the accurate protein concentration, amino acid analysis was performed for P4 wort and spent grain samples since this protease most efficiently extracts thiol-containing peptides from malt. Amino acid analysis confirmed the previous observations by showing that the total concentration of amino acids in the wort after hydrolysis was increased by P4 compared with the control and decreased by P4 in spent grain compared with the control (Table 4). Cysteine is degraded during the amino acid analysis, so this amino acid is not included in Table 4. The amino acid analysis also showed that the amino acid composition changed to a small extent in the P4 wort compared with the control wort, where the protease treatment mainly increased the content of glutamine/glutamic acid (Glx), leucine (Leu) and phenylalanine (Phe), and decreased the content of aspartic acid/asparagine (Asx), glycine (Gly), alanine (Ala) and lysine (Lys).
| Wort | Spent grain | |||
|---|---|---|---|---|
| Amino acid (%) | Control | P4 | Control | P4 |
| Asx | 10.8 | 8.2 | 7.0 | 7.8 |
| Glx | 22.2 | 24.9 | 20.4 | 17.3 |
| Ser | 4.8 | 4.7 | 5.4 | 5.6 |
| Gly | 5.7 | 4.9 | 5.5 | 6.0 |
| His | 3.4 | 3.2 | 3.6 | 3.7 |
| Arg | 6.2 | 6.5 | 8.1 | 8.5 |
| Thr | 4.8 | 4.6 | 5.0 | 5.5 |
| Ala | 6.6 | 5.6 | 4.9 | 5.4 |
| Tyr | 4.2 | 4.5 | 5.0 | 5.1 |
| Val | 7.2 | 7.2 | 7.1 | 7.3 |
| Ile | 4.5 | 4.9 | 5.2 | 5.2 |
| Leu | 8.1 | 9.2 | 9.7 | 9.7 |
| Phe | 6.0 | 7.1 | 9.2 | 8.5 |
| Lys | 5.6 | 4.5 | 3.9 | 4.6 |
| Total (µg/mL) | 3748 ± 1 | 6400 ± 200 | 6400 ± 100 | 5750 ± 80 |
Conclusions
The present study shows that it is possible to increase the concentration of protein-derived thiols in wort by the addition of a protease at the beginning of mashing. The additional thiols are believed to be derived from the increased solubilization of the soluble thiol-containing protein fraction of malt. Furthermore, most of the malt proteins are degraded to a certain extent by the protease, as determined by Bradford and SDS–PAGE analysis, resulting in increased levels of peptides in the wort, as determined by Kjeldahl and amino acid analysis. The most abundant beer protein, protein Z, is the only protein that clearly increased in concentration. The efficiency and resulting peptide and protein composition in wort is highly dependent on the type of protease, and in this study the metallo proteases most effectively increased thiol concentrations compared with the tested cysteine and serine proteases.
The effect of adding a protease during mashing on flavour and oxidative stability in beer during storage is currently being investigated.
Acknowledgements
The technical assistance of Pia Krall Faurschou and Linda de Sparra Terkelsen from the University of Copenhagen, Andrea Lorentzen from the University of Southern Denmark, Gregor Martinetz and Christian Isak Jørgensen from Novozymes A/S is acknowledged. Peter Rahbek Østergaard is thanked for providing the proteases. The work was financed through the Innovations Fund.


