Stearoyl-CoA desaturase 1 inhibition impairs triacylglycerol accumulation and lipid droplet formation in colorectal cancer cells
Abstract
Increases in fatty acid (FA) biosynthesis meet the higher lipid demand by intensely proliferating cancer cells and promoting their progression. Stearoyl-CoA desaturase 1 (SCD1) is the key enzyme in FA biosynthesis, converting saturated FA (SFA) into monounsaturated FA (MUFA). Increases in the MUFA/SFA ratio and SCD1 expression have been observed in cancers of various origins and correlate with their aggressiveness. However, much is still unknown about the SCD1-dependent molecular mechanisms that promote specific changes in metabolic pathways of cancer cells. The present study investigated the involvement of SCD1 in shaping glucose and lipid metabolism in colorectal cancer (CRC) cells. Excess FAs that derive from de novo lipogenesis are stored in organelles, called lipid droplets (LDs), mainly in the form of triacylglycerol (TAG) and cholesteryl esters. LD accumulation is associated with key features of cancer development and progression. Consistent with our findings, the pharmacological inhibition of SCD1 activity affects CRC cell viability and impairs TAG accumulation and LD formation in these cells through the activation of lipolytic and lipophagic pathways. We showed that SCD1 suppression affects crucial lipogenic processes that promote lipid accumulation in CRC cells but in a sterol regulatory element-binding protein 1-independent manner. We propose that adenosine monophosphate-activated protein kinase contributes to these changes through the activation of lipolysis and inhibition of TAG synthesis. We also provide evidence of the involvement of SCD1 in the regulation of glucose uptake and utilization in CRC cells. These findings underscore the importance of SCD1 in regulating cellular processes that promote cancer development and progression.
1 INTRODUCTION
Cancer cells are characterized by the profound reprogramming of cellular metabolism. A characteristic feature of these changes that distinguishes cancer cells from normal cells is an increase in the rate of de novo fatty acid (FA) biosynthesis. This provides a response to the higher demand for lipids by intensively growing and proliferating cancer cells that are simultaneously exposed to a limited supply of nutrients and oxygen in the tumor microenvironment. A wide body of evidence indicates that high lipid biosynthesis maintains the survival and metastatic potential of cancer cells and supports its progression (Ackerman & Simon, 2014; Röhrig & Schulze, 2016). Thus, cancer cells develop efficient lipogenic machinery, including an increase in the activity of sterol regulatory element-binding protein 1 (SREBP-1; i.e., the master regulator of lipogenesis) and most critical enzymatic players in lipid synthesis, such as adenosine triphosphate (ATP)-citrate lyase (ACLY), acetyl-CoA carboxylase (ACC), FA synthase (FAS), and stearoyl-CoA desaturase 1 (SCD1) (Guo et al., 2014; Swinnen et al., 2006). Increases in the activity of these lipogenic enzymes correlate with more advanced stages of cancer of various origins (Nieva et al., 2012). In cancer cells, glucose is the main source of carbon for de novo FA synthesis, and its glycolytic breakdown supplies cellular metabolism with energy, even under oxygen-rich conditions. This dependence on glucose uptake and utilization has been called the Warburg effect, serving to maintain a higher metabolic rate in intensely proliferating cancer cells (Zhang, 2012).
SCD1 is the most abundant isoform of SCD and a key enzyme in de novo FA synthesis, converting saturated FA (SFA) into monounsaturated FA (MUFA). The primary products of SCD1 enzymatic activity are palmitoleate (16:1n-7) and oleate (18:1n-9), which are converted from palmitic acid (16:0) and stearic acid (18:0), respectively (Nagao et al., 2019). MUFAs are found in diacylglycerols (DAGs), triacylglycerols (TAGs), cholesteryl esters (ChEs), and phospholipids (PLs), which are main lipid components of cell membranes and signaling molecules, providing a source of energy, especially in intensely proliferating cancer cells (Ravaut et al., 2020). Increases in the MUFA/SFA ratio and simultaneously higher levels of SCD1 expression have been observed in cancer tissue of various origins and correlate with the aggressiveness of malignancy (Budhu et al., 2013; Holder et al., 2013; Wang et al., 2016). Thus, SCD1 has emerged as a potential target for anticancer therapy. A wide range of SCD1 inhibitors have been tested in vitro and in animal models as candidate therapeutic agents (for review, see [Tracz-Gaszewska & Dobrzyn, 2019]).
Excess FAs that derive from exogenous uptake or de novo lipogenesis are stored in cellular organelles, called lipid droplets (LDs), mainly in the form of TAGs and ChEs. LDs are surrounded by two or more members of the perilipin (PLIN) family of LD surfaces proteins. The PLINs sequester lipids by protecting LDs from lipase action and degradation (Sztalryd & Brasaemle, 2017). LDs maintain proper lipid homeostasis, protect cancer cells from lipotoxicity, and provide a source of ATP and reduced nicotinamide adenine dinucleotide phosphate under conditions of metabolic stress (Koundouros & Poulogiannis, 2020). LD accumulation has been observed in various cancers and associated with crucial hallmarks of cancer, including cell cycle progression, the modulation of oncogenic signaling pathways, hypoxia-mediated alterations of lipid metabolism, the epithelial mesenchymal transition, the sequestration of hydrophobic anticancer agents, tumor-promoting inflammation through eicosanoid synthesis, and crosstalk between tumor and immune cells (Cruz et al., 2020). LD content in cancer cells has been clearly shown to correlate with cancer aggressiveness (Abramczyk et al., 2015; Cruz et al., 2020). MUFAs are main components of TAGs that are stored in LDs (Ravaut et al., 2020). The role of SCD1 in lipid accumulation appears to be substantial. Indeed, some studies reported that SCD1 contributes to FA accumulation and LD formation in various tissues in different organisms (Ralston et al., 2014; Ren et al., 2018; Shi et al., 2013), but very few studies have found such a relationship in human cancer cells (Huang et al., 2019).
LD content is abnormally high in colorectal cancer (CRC) tissues, supporting its progression, chemoresistance, and inflammatory potential (Accioly et al., 2008; Cotte et al., 2018; Kawasaki et al., 2017), and has been associated with the high tumorigenicity of CRC stem cells (CR-CSCs) (Tirinato et al., 2015). High SCD1 expression in CRC tissue has been correlated with a poor prognosis in CRC patients (Ran et al., 2018). Therefore, we investigated whether SCD1 is involved in LD formation and lipid accumulation in CRC cells. We found that SCD1 stimulated the accumulation of LDs in CRC cells and that SCD1 deficiency reduced the pool of cellular LDs through activation of the lipolytic pathway. We also found that lipophagy is implicated in the mobilization of FAs that are stored in LDs upon the inhibition of SCD1 enzymatic activity, in parallel with lipolysis. Additionally, endoplasmic reticulum (ER) stress that resulted from SCD1 inhibition caused the proteolytic cleavage of SREBP-1 to generate its transcriptionally active form. Although we observed this increase in the active form of SREBP-1 in CRC cells that were treated with a SCD1 inhibitor, we did not observe an increase in lipogenesis in these cells. We propose that adenosine monophosphate-activated protein kinase (AMPK) mediates LD breakdown, lipid degradation, and a decrease in TAG synthesis after SCD1 inhibition. Finally, we provide evidence that SCD1 contributes to the Warburg effect in CRC cells.
2 MATERIALS AND METHODS
2.1 Cell cultures, transfection, and treatment
The human HCT116 (CCL-247, American Type Culture Collection [ATCC]) colon cancer cell line, the human A549 (CCL-185, ATCC) non-small-cell lung cancer cell line, and human fibroblasts (PCS-201-012, ATCC) were a kind gift from Prof. Ewa Sikora (Nencki Institute of Experimental Biology). The human HT29 (HTB-38, ATCC) colon cancer cell line was kindly provided by Dr. Dawid Walerych (Mossakowski Medical Research Center, Polish Academy of Sciences). All cell lines were maintained in Dulbecco's Modified Eagle's Medium (DMEM) high-glucose medium (Biowest) that was supplemented with 10% fetal bovine serum and antibiotics (Sigma). Cells were grown at 37°C in a 5% CO2 humidified incubator. Cells were transfected with pCMV6-SCD1 (pSCD1, Origene) that encoded human SCD1 or with a pool of four siRNAs that targeted the human SCD1 gene (ON-TARGETplus SMARTpool siRNA, Dharmacon) with the use of jetOptimus transfecting reagent (Polyplus). HCT116 and HT29 cells were treated with 1 µM and 0.05−0.1 µM, respectively, of the SCD1 inhibitor A939572 (Biofine International). The ER stress inhibitor tauroursodeoxycholic acid dihydrate (TUDCA; Chemical Industry), AMPK inhibitor compound C (Sigma), adipose triglyceride lipase (ATGL) inhibitor atglistatin (Sigma), and autophagy inhibitor chloroquine diphosphate (CQ; Sigma) were applied to the cell culture at concentrations of 200, 5−10, 50−100, and 5−10 µM, respectively. Control cells were incubated for the same period of time with a corresponding concentration of dimethyl sulfoxide diluted in phosphate-buffered saline (PBS).
2.2 Antibodies
ACC phosphorylated at Ser79 (catalog no. 07-303) and glyceraldehyde-3-phosphate dehydrogenase (GAPDH; catalog no. MAB374) antibodies were purchased from Millipore. FAS (catalog no. sc-20140), SREBP-1 (catalog no. sc-13551), AMPKα (catalog no. sc-25792), glucose-regulated protein 78 (GRP78; catalog no. sc-376768), C/EBP homologous protein (CHOP; catalog no. sc-7351), and PLIN3 (catalog no. sc-390968) antibodies were purchased from Santa Cruz Biotechnology. ATGL (catalog no. 2138 S), ACC (catalog no. 3662 S), SCD1 (catalog no. 2283 S), hormone-sensitive lipase (HSL; catalog no. 4107 S), HSL phosphorylated at Ser565 (catalog no. 4137 S), AMPKα phosphorylated at Thr172 (catalog no. 2531), protein kinase B (AKT; catalog no. 2938), AKT phosphorylated at Ser473 (catalog no. 9271), AKT substrate of 160 kDa (AS160; catalog no. 2670), and AS160 phosphorylated at Thr642 (catalog no. 4288) antibodies were purchased from Cell Signaling (Hartsfordshire). Horseradish peroxidase (HRP)-conjugated β-actin antibody (catalog no. 3854) and microtubule-associated proteins 1 A/1B-light chain 3B (LC3B) antibody (catalog no. L7543) were purchased from Sigma. PLIN2 antibody (catalog no. GP40) was purchased from Progen. Goat anti-mouse (catalog no. 115-035-146, Jackson ImmunoResearch), goat anti-rabbit (catalog no. 67437; MP Biomedicals), and goat anti-guinea pig (catalog no. A18769, Thermo Scientific) HRP-conjugated secondary antibodies were used for Western blot.
2.3 LD staining with Oil Red O
Cells were seeded on glass coverslips that were placed in a 24-well plate. After treatment, the cells were washed twice with DPBS and incubated for 20 min in 4% paraformaldehyde at room temperature. After two washes with double-distilled H2O (ddH2O), the cells were incubated with 60% isopropanol for 5 min with gentle shaking. After removing isopropanol, fresh Oil Red O (Sigma) solution was added. After 10 min of incubation at room temperature, the cells were washed five times with ddH2O. DAPI was added to the fourth wash at a concentration of 0.5 μg/mL. The coverslips were mounted with Fluorescence Mounting Medium (Agilent Technologies). Images were acquired with an Olympus BX41 fluorescence microscope at ×100 magnification, and LDs were counted from n ≥ 12 scanned areas using ImageJ software.
2.4 Lipid extraction and analysis
Total lipids were extracted by the method of Bligh and Dyer (Bligh & Dyer, 1959). Briefly, cells were grown in a 75 cm2 flask, trypsinized, and washed twice with DPBS. One-tenth of the cells were taken to measure protein concentrations. After centrifugation at 3000 rotations per minute (rpm) for 10 min at 4°C, residual DPBS was removed, and 1 ml of a chloroform:methanol (2:1, v/v) mixture that was supplemented with 0.01% butylated hydroxytoluene (BHT; Sigma) was added to the cell pellet. The cells were then mechanically crushed with a T10 Basic Ultra-Turrax homogenizer (IKA, Staufen, Germany), and 0.5 ml of water was added. After 30 s of vortexing, the samples were centrifuged at 3000 rpm for 10 min at 4°C, and the bottom layer of chloroform that contained lipids was transferred to the Pyrex tube. For the preparation of samples for thin-layer chromatography (TLC), chloroform was evaporated under a stream of nitrogen, and dried lipid extracts were dissolved in chloroform:methanol (2:1 v/v). The amount of lipid extract that was loaded onto the TLC plate was normalized to protein content in the analyzed samples. Neutral lipids were separated in a heptane:isopropyl ether:glacial acetic acid (60:40:3, v/v/v) mixture. For the PL analysis, the TLC plate was developed in a chloroform:methanol:glacial acetic acid:H2O (65:43:2.5:3) mixture to two-thirds of its height, dried, and placed in the mixture for neutral lipid separation. After drying, the plate was rinsed with a 10% CuSO4/8% H3PO4 solution and heated at 140°C for 20 min or until brown stains appeared.
2.5 Western blot
Cells were lysed in Pierce RIPA buffer (Thermo Scientific) that was supplemented with phosphatase inhibitor cocktail tablets (PhosSTOP, Roche) and protease inhibitor cocktail tablets (cOmplete ULTRA Tablets, Roche). Lysates were centrifuged at 14000 rpm for 20 min at 4°C, and protein concentrations were determined with the Bio-Rad Protein Assay (Bio-Rad). Bovine serum albumin was used as the reference. Protein samples (40 μg) were separated with 7−15% SDS-polyacrylamide gel electrophoresis and transferred to a polyvinylidene difluoride membrane (Millipore). The membrane was blocked in 5% skimmed milk, incubated with antibodies, and visualized with SuperSignal West Pico PLUS Chemiluminescent Substrate (Thermo Scientific). Densitometry was performed using GelQuant.NET software.
2.6 Gene expression analysis
RNA was extracted from cells with the Total RNA Mini kit (A&A Biotechnology). Residual genomic DNA was removed by DNase treatment (A&A Biotechnology). cDNA synthesis was performed with the RevertAid H Minus Reverse Transcriptase system (Thermo Scientific). Gene expression levels were analyzed using GoTaq quantitative polymerase chain reaction (qPCR) Master Mix (Promega). Specificity of the designed primers was tested using the Primer-Blast tool on the National Center for Biotechnology Information platform (http://www.ncbi.nlm.nih.gov). mRNA levels of the analyzed genes were normalized to GAPDH or 18 S rRNA expression. CFX Connect thermocycler (Bio-Rad) was used with the following cycling conditions: 1 cycle of 95°C for 3 min, 40 cycles of 95°C for 15 s and 60°C for 30 s. A list of primers for real-time PCR is presented in Supporting Information: Table 1.
2.7 Glycerol release assay
Glycerol content in the medium was measured using the Free Glycerol Colorimetric/Fluorometric Assay Kit (BioVision) or Glycerol Phosphate/Oxidase Assay Kit (Biosystems) according to the manufacturer's instructions.
2.8 Glucose uptake assay
Cells were washed with glucose-free DMEM (Thermo Scientific) and starved within the same medium for 30 min. A 100 µg/mL solution of 2-(N-(7-nitrobenz-2-oxa-1,3-diazol-4-yl)amino)−2-deoxyglucose (2-NBDG; Thermo Scientific) in glucose-free DMEM was then added. After 30 min, the cells were washed three times with DPBS. The second wash was supplemented with 2.5 μg/mL Hoechst (Invitrogen) for normalization. The fluorescence of 2-NBDG (485/535 nm excitation/emission wavelengths) and Hoechst (352/461 nm excitation/emission wavelengths) was measured with an Infinite M200 Pro plate reader (Tecan).
2.9 Extracellular acidification assay
To analyze the glycolytic activity of cells, extracellular acidification was measured using the Glycolysis Assay (Abcam) according to the manufacturer's instructions.
2.10 Statistical analysis
The statistical analysis was performed using GraphPad Prism 6 software. For comparisons between two groups, two-sided t-tests were used. Values of p < 0.05 were considered statistically significant. The data are expressed as the mean ± standard deviation.
3 RESULTS
3.1 SCD1 promotes LD accumulation in CRC cells
The inhibition of SCD1 activity with A939572 reduced the viability of HCT116 CRC cells, whereas the viability of non-cancer human cells (fibroblasts) was affected by this compound to a lesser extent with the applied concentrations (Supporting Information: Figure S1A). Next, we performed the crystal violet staining of HCT116 cells, HT29 cells, and fibroblasts to assess cytotoxicity of the SCD1 inhibitor. We found higher cytotoxic effects of A939572 in both CRC cell lines compared with fibroblasts (Supporting Information: Figure S1B). This preliminary analysis allowed us to select appropriate low-toxic concentrations of A939572 before the subsequent experiments. The chosen concentrations of A939572 (1 μM for HCT116 cells and 0.1 μM for HT29 cells) appeared to exert the most significant effects on molecular and physiological pathways in CRC cells. Decreases in the 16:1/16:0 and 18:1/18:0 desaturation ratios confirmed the inhibitory effect of A939572 on the enzymatic activity of SCD1 in HCT116 cells (Supporting Information: Figure S1C). We also performed a migration assay on HTC116 cells and found that SCD1 inhibition reduces the migratory capacity of the cells (Supporting Information: Figure S2). Such an effect was observed in many cancer cell lines, including CRC cells (for review, see [Tracz-Gaszewska & Dobrzyn, 2019]).
To verify whether SCD1 is implicated in FA accumulation and LD formation in CRC cells, we transfected HCT116 cells with a plasmid that encoded SCD1 protein or treated them with the SCD1 inhibitor A939572 and then performed LD staining using Oil Red O. SCD1 overexpression increased the LD number/cell and its size (Figure 1a), whereas treatment with the SCD1 inhibitor decreased these parameters (Figure 1b). Additionally, the number but not size of LDs decreased after silencing SCD1 expression in HCT116 cells (Figure 1c). We achieved high efficiency in silencing SCD1 expression using a pool of four commercially available siRNAs (see Materials and Methods section), demonstrated by Western blot (Figures 3b and 4c). Additionally, neither A939572 treatment nor silencing SCD1 expression affected the expression of SCD5 (Supporting Information: Figure S3), one of two SCD isoforms that have been identified in human tissues (Castro et al., 2011).
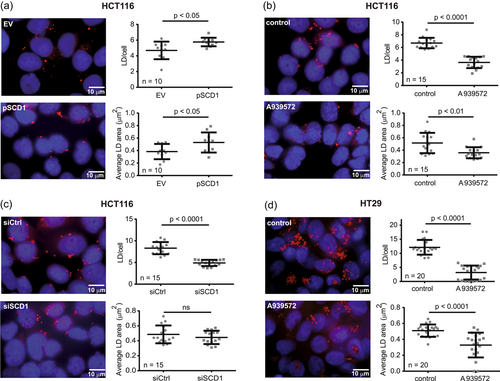
Because of the moderate number of LDs that were observed in HCT116 cells, we introduced to our study the HT29 CRC cell line, which is more potent in LD accumulation (Accioly et al., 2008). In these cells, a higher LD content and a stronger effect of SCD1 inhibition on the number of LDs per cell were observed compared with HCT116 cells (Figure 1d). However, because of ineffective transfection, we limited the use of HT29 cells to subsequent experiments in which the SCD1 inhibitor was applied.
3.2 SCD1 inhibition affects lipid profile and TAG synthesis in CRC cells
To test whether SCD1-dependent changes in LD number and size correlate with alterations of the content of lipids, we analyzed neutral lipids. The results revealed significant decreases in TAG, DAG, Chol, and ChE in HT29 cells that were treated with the SCD1 inhibitor (Figure 2a). In HCT116 cells, we observed a less pronounced decrease in TAG content and, interestingly, a higher content of DAG, Chol, and ChE (Figure 2b). We also observed a slight increase in TAG content in HCT116 cells that overexpressed SCD1 (Figure 2c). These data are consistent with the results of the LD staining pattern, showing that HT29 cells were more potent than HCT116 cells in forming LDs, with a significantly lower number and size after SCD1 inhibition (Figure 1).
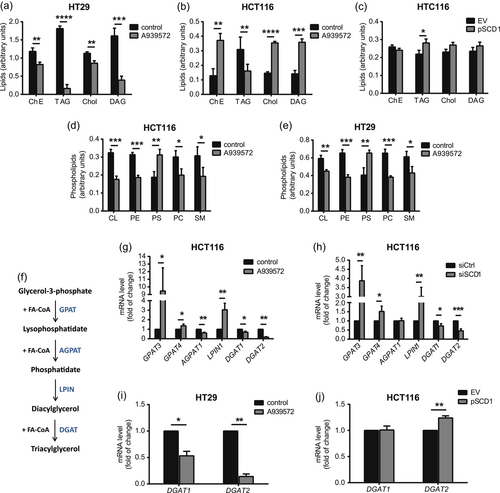
The intense proliferation of cancer cells requires an increase in intracellular PL synthesis to meet the high demand for newly formed cell membranes (Cheng et al., 2016). To determine whether SCD1 contributes to PL synthesis in CRC cells, we analyzed the PL profile of HCT116 and HT29 cells that were treated with the SCD1 inhibitor. For both cell lines, we observed decreases in cardiolipin (CL), phosphatidylethanolamine (PE), phosphatidylcholine (PC), and sphingomyelin (SM) and an increase in phosphatidylserine (PS) after treatment with A939572 (Figure 2d,e). Thus, we found that SCD1 promotes TAG accumulation and PL synthesis in CRC cell lines.
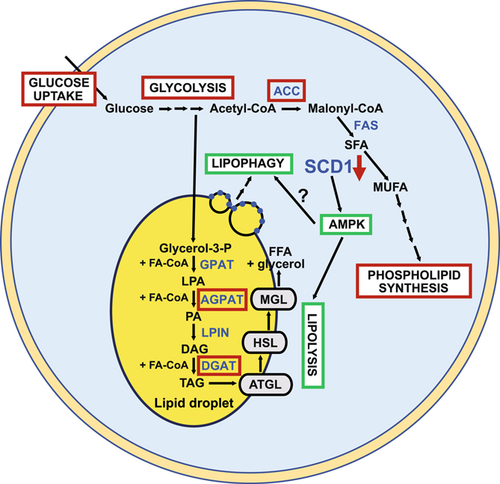
TAG biosynthesis involves the conversion of glycerol-3-phosphate to TAG during the course of subsequent reactions that are catalyzed by the following ER-associated enzymes: glycerol-3-phosphate acyltransferase (GPAT), 1-acyl-sn-GPAT (AGPAT), phosphatidic acid phosphohydrolase/lipin (LPIN), and DAG acyltransferase (DGAT) (Coleman & Mashek, 2011) (Figure 2f). Considering the main isoforms of these enzymes, we found that the inhibition of SCD1 activity increased the expression of GPAT3, GPAT4, and LPIN1 but decreased the expression of AGPAT1, DGAT1, and DGAT2 in HCT116 cells (Figure 2g). The results were similar for HCT116 cells with silenced SCD1 expression, with the exception of AGPAT1, for which we observed no change after SCD1 knockdown (Figure 2h). We also observed an inhibitory effect of A939572 on DGAT1 and DGAT2 expression in HT29 cells (Figure 2i) and found that SCD1 overexpression in HCT116 cells did not affect the expression of DGAT1 but upregulated DGAT2 (Figure 2j). Thus, the observed SCD1-dependent accumulation of LDs and TAG may result from the modulation of TAG synthesis by SCD1 in CRC cells.
3.3 SREBP-1 is not involved in SCD1 dependent lipid accumulation in CRC cells
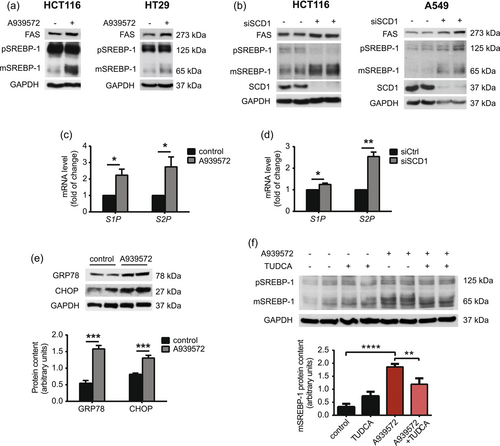
SREBP-1 transcription factor is the master regulator of FA synthesis by controlling the expression of lipogenic enzymes, including ACC, FAS, and SCD1. To achieve transcriptional activity, precursor SREBP-1 must be cleaved by ER-associated site-1 protease (S1P) and site-2 protease (S2P) to generate its transcriptionally active form (Dorotea et al., 2020). We observed SCD1-dependent changes in TAG accumulation (Figure 2a−c) and further analyzed the activation of SREBP-1 upon SCD1 inhibition or silencing in CRC cells. We observed increases in levels of the mature form of SREBP-1 (~65 kDa) and FAS expression after the treatment of HCT116 and HT29 cells with the SCD1 inhibitor (Figure 3a). We also observed an increase in levels of the mature form of SREBP-1 and FAS protein in HCT116 cells and A549 lung adenocarcinoma cells with silenced SCD1 expression (Figure 3b), suggesting that cleavage of the SREBP-1 precursor upon the depletion of SCD1 expression/activity is specific to cancer cells of various origins. Additionally, mRNA levels of SREBP-1c and its master regulator liver X receptor α were unaffected by A939572 in HCT116 cells (Supporting Information: Figure S4). The inhibition of SCD1 activity induces ER stress and the unfolded protein response (UPR) through perturbations of lipid homeostasis in the ER (Leung & Kim, 2013). ER stress causes the activation of S1P and S2P proteases that, in turn, process the precursor form of SREBP-1 (Kim et al., 2018; Ye et al., 2000). The treatment of HCT116 cells with A939572 (Figure 3c) and silencing of SCD1 expression in HCT116 cells with siRNA (Figure 3d) increased S1P and S2P mRNA levels. The inhibition of SCD1 activity with A939572 induced the expression of markers of ER stress, including glucose regulated protein-78 (GRP78) and C/EBP homologous protein (CHOP) in HCT116 cells (Figure 3e). The additional treatment of HCT116 cells with the ER stress inhibitor TUDCA abolished, to some extent, A939572-induced SREBP-1 cleavage (Figure 3f). As shown above, the depletion of SCD1 activity or inhibition of SCD1 expression in cancer cells of various origins caused ER stress-mediated generation of the active form of SREBP-1.
3.4 SCD1 inhibition induces lipolysis in CRC cells
The observed reduction of lipid accumulation after the inhibition of SCD1 activity occurred independently of SREBP-1. Therefore, we further analyzed the lipolytic breakdown of lipids. Lipolysis is a process by which TAGs are hydrolyzed to FAs and glycerol by a series of enzymes, including ATGL, HSL, and monoacylglycerol lipase (MAGL) (Iglesias et al., 2016). AMPK maintains cellular energy homeostasis and is activated in response to energy deficiency. AMPK promotes lipolysis by activating ATGL through phosphorylation and inhibits lipogenesis by introducing the inhibitory phosphorylation of ACC (Segatto et al., 2016). We observed an increase in AMPK phosphorylation at Thr172, which stimulates its activity, and the concomitant inhibitory phosphorylation of ACC at Ser79 in both HCT116 (Figure 4a) and HT29 (Figure 4b) cells that were treated with A939572. We also observed higher levels of ATGL and a decrease in the inhibitory phosphorylation of HSL at Ser565 in these cells. Similar effects were observed in HCT116 cells with silenced SCD1 expression (Figure 4c), but we did not observe any changes in protein levels of lipolytic factors upon SCD1 overexpression (Supporting Information: Figure S5). Unfortunately, we were unable to detect the phosphorylation of HSL at Ser563, which increases its activity, in the above experiments. Thus, “pHSL” in Figure 4a−c and 6c, and Supporting Information: Figure S5 refers to phosphorylated HSL at Ser565. Because HSL is phosphorylated at Ser565 by active AMPK, we cannot exclude the possibility that the increase in HSL phosphorylation after SCD1 depletion that was observed in the present study may have resulted from the suppression of HSL dephosphorylation at this site, which has not been previously studied. Additionally, the real-time quantitative PCR (RT-qPCR) analysis showed increases in ATGL, HSL, MAGL, and abhydrolase domain containing 5, lysophosphatidic acid acyltransferase (ABHD5, a coactivator of ATGL expression) in HCT116 cells that were treated with the SCD1 inhibitor or transfected with an siRNA that targeted SCD1 (Supporting Information: Figure S6).
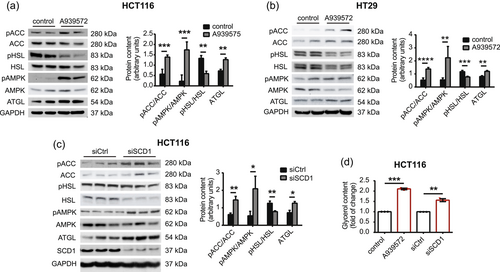
Free FAs and glycerol are final products of the lipolytic breakdown of TAGs (Iglesias et al., 2016). We observed an increase in glycerol content in the culture medium of HCT116 cells that were treated with A939572 or transfected with siRNA that targeted SCD1 (Figure 4d). Thus, we found higher levels of lipolysis in SCD1-deficient CRC cells. Conversely, active SCD1 may suppress lipolytic pathways in these cells.
3.5 Inhibition of SCD1 activity induces lipophagy in CRC cells
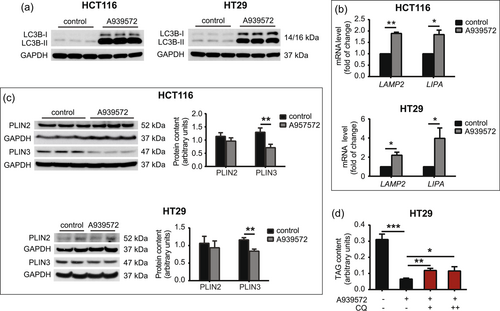
In addition to the mobilization of FAs from LDs through the lipolytic pathway, a type of selective autophagy, called lipophagy, targets LDs to maintain lipid homeostasis under specific conditions, such as nutrient deprivation and hypoxia (Shin, 2020). Lipophagy begins with encapsulation of the engulfed portion of LDs with a double membrane to form an autophagosome, with the involvement of autophagy-related proteins (ATGs) and microtubule-associated proteins 1 A/1B-LC3B. After fusion with the liposome, TAG and ChE are hydrolyzed by lysosomal acid lipase/ChE hydrolase (LIPA) to generate free FAs and cholesterol, respectively (Li & Zhang, 2019). Chaperone-mediated autophagy (CMA) is a particular process that supports lipophagy through degradation of the coat proteins PLIN2 and PLIN3 in the coordinated action of heat shock cognate 71 kDa protein (HSC70) and lysosome-associated membrane protein 2 A (LAMP2). This provides access for cytosolic lipases (ATGL, HSL, and MAGL) or proteins of lipophagic machinery to LD content (Ward et al., 2016). We found that the inhibition of SCD1 with A939572 in HCT116 and HT29 cells caused a strong increase in the membrane-bound LC3B-II form that is converted from the cytoplasmic LC3B-I form and recruited to autophagosomal membranes (Figure 5a). We also observed the higher expression of genes that encode the lysosomal lipase LIPA and CMA-related LAMP2 protein in HCT116 and HT29 cells that were treated with A939572 (Figure 5b). These results suggest that SCD1 inhibition may induce, together with lipolysis, autophagic processes that target FAs that are stored in LDs in CRC cells. We next investigated whether PLIN2 and PLIN3 degradation accompanies the process of autophagy after SCD1 inhibition. Four isoforms of these LD-associated proteins coat the LD surface and regulate lipid storage. The expression of PLIN1 and PLIN4 is restricted to adipocytes and steroidogenic cells, and PLIN2 and PLIN3 are found in various tissues and are possible biomarkers of some types of cancer (Zhang et al., 2018). We found that SCD1 inhibition did not affect PLIN2 protein levels but decreased PLIN3 protein levels in HCT116 and HT29 cells (Figure 5c). To test whether the above observations translate into an increase in lipophagy following SCD1 inhibition, we treated HT29 cells with the autophagy inhibitor chloroquine (CQ). CQ inhibits autophagic flux by impairing autophagosome-lysosome fusion (Mauthe et al., 2018). CQ administration slightly restored TAG accumulation that was previously reduced by SCD1 inhibition in HT29 cells (Figure 5d). Higher than 10 μM concentrations of CQ were toxic to HT29 cells. These findings indicate that the inhibition of SCD1 activity induced both the lipolytic and lipophagic degradation of FAs in CRC cells.
3.6 AMPK mediates SCD1 inhibition-dependent TAG degradation in CRC cells
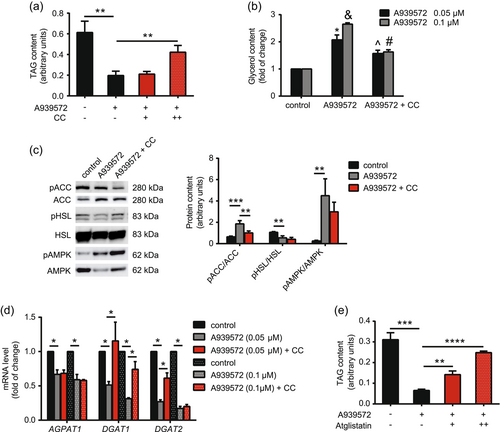
We found that SCD1 depletion activated AMPK in CRC cells (Figure 4). Therefore, we next investigated whether AMPK mediates SCD1-dependent effects on LD and TAG accumulation (Figure 1 and 2). We used compound C, a potent AMPK inhibitor, and found that it abolished, to some extent, the inhibitory effect of A939572 on TAG accumulation in HT29 cells (Figure 6a). This may have resulted from the lower rate of lipolysis in A939572/compound C-treated cells (Figure 6b). Although compound C administration did not affect A939572-stimulated AMPK phosphorylation, it reduced ACC phosphorylation in cells that were treated with the SCD1 inhibitor (Figure 6c). We also observed no effect of compound C treatment on HSL phosphorylation at Ser565, which was previously reduced by A939572 (Figure 6c). Another mechanism of action of SCD1 that depends on AMPK activity may include its regulatory effect on TAG synthesis. Treatment with compound C abolished, to some extent, the inhibitory effect of A939572 on DGAT1 and DGAT2 expression (Figure 6d). SCD1 inhibition decreased AGPAT1 expression in HCT116 (Figure 2g) and HT29 (Figure 6d) cells, but these changes occurred independently of AMPK activity (Figure 6d). Interestingly, administration of the ATGL inhibitor atglistatin in HT29 cells that were also treated with A949572 had a similar effect on TAG content as the AMPK inhibitor (Figure 6e), suggesting that SCD1 inhibition activated the AMPK-ATGL axis in these cells. Thus, the observed induction of lipolysis upon SCD1 inhibition appears to depend on AMPK activity.
3.7 SCD1 inhibition decreases glucose uptake in CRC cells
Glucose, the consumption of which increases in cancer cells, is a substrate for de novo FA synthesis (Zhang, 2012). Using the fluorescent glucose analog 2-NBDG, we found that SCD1 inhibition/silencing reduced glucose uptake in HCT116 and HT29 cells (Figure 7a). Glucose transporter type 1 (GLUT1), GLUT3, GLUT4, and GLUT12 proteins are the most common glucose transporters that are involved in glucose uptake in cancer cells of various origins (Ancey et al., 2018; Barron et al., 2016). We found that the expression of GLUT4 and GLUT12 decreased after both A939572 treatment and the silencing of SCD1 expression in HCT116 cells (Figure 7b). Interestingly, GLUT1 mRNA levels also decreased after SCD1 gene interference in HCT116 cells (Figure 7b, top) but increased upon treatment with the SCD1 inhibitor (Figure 7b, bottom).
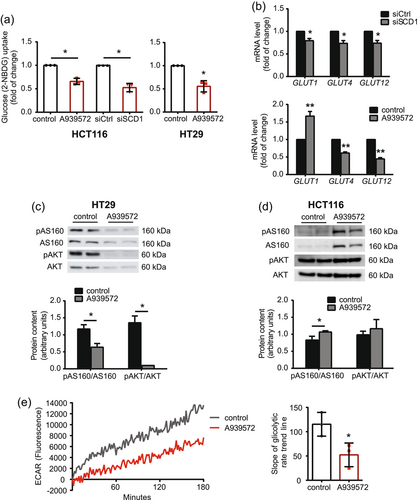
Cancer-related alterations of glucose metabolism result from the aberrant activation of AKT, which enhances glucose uptake and activates several glycolytic enzymes through post-translational and transcriptional mechanisms (Hosios & Manning, 2021). We observed a decrease in AKT phosphorylation at Ser473, which stimulates its activity, and a simultaneous decrease in the AKT-dependent phosphorylation of AS160, which contributes to GLUT4 translocation to the cell membrane (Hoxhaj & Manning, 2020), in HT29 cells treated with A939572 (Figure 7c). However, we did not detect changes in AKT phosphorylation in HCT116 cells that were treated with the SCD1 inhibitor (Figure 7d). We also found that the treatment of HCT116 cells with A939572 reduced extracellular acidification (Figure 7e), reflected by release of the glucose breakdown product lactate into the culture medium, indicating lower glycolytic flux in these cells.
We propose that SCD1 glucose uptake and utilization in CRC cell lines. Additionally, the uptake of exogenous FAs that supply the pool of cellular lipids (Koundouros & Poulogiannis, 2020) was unaffected by SCD1 inhibition or deficiency in HCT116 and HT29 cells (Supporting Information: Figure S7).
4 DISCUSSION
The tight regulation of lipid homeostasis is vital for the proper functioning of cancer cells of different origins (Zhang, 2012). The significant role of SCD1 in the regulation of lipid metabolism in vivo has been highlighted (Dobrzyn et al., 2015). In the present study, we provide evidence that SCD1 controls both lipogenic and lipolytic processes that shape lipid content in CRC cells. We also propose that SCD1 is involved in the regulation of glucose uptake and utilization in CRC cells, a branch of cellular metabolism that is highly reprogrammed in cancer cells (Hosios & Manning, 2021). The significance of the present results is underscored by the fact that the higher expression of SCD1 in CRC tissue correlates with poor outcomes in CRC patients (Ran et al., 2018).
In the present study, the viability of HCT116 and HT29 cells was lower after SCD1 inhibition compared with noncancerous human fibroblasts. We confirmed previous observations that SCD1 activity is crucial for CRC cell viability and that the viability of normal cells is affected by SCD1 inhibition to a lesser extent (Hess et al., 2010). Moreover, the observed cytotoxic effect of A939572 on CRC cells appears to be mainly attributable to impairments in MUFA synthesis because it was reversed by the administration of oleic acid (18:1) (Chen et al., 2016).
Increases in de novo FA synthesis and accumulation provide a source of structural components and energy in intensely dividing cancer cells (Röhrig & Schulze, 2016). Excess FAs are stored in LDs, the formation of which has been linked to many processes that drive cancer growth and progression (Cruz et al., 2020). We found that SCD1 promotes the accumulation of TAG, the main reservoir of FAs that are stored in LDs, and the formation of LDs in CRC cells. Some studies reported that SCD1 may contribute to FA accumulation in various types of mammalian cells (Iwai et al., 2016; Ralston et al., 2014; Ren et al., 2018), but very few studies have found this relationship in human cancer cells (Huang et al., 2019). Together with TAG, ChE is another important component of LDs (Cruz et al., 2020). In HCT116 cells, ChE contribution to FA accumulation appears to be limited because only TAG content correlates with SCD1-dependent changes in the number and size of LDs.
The balance between storage and utilization of lipids accumulated in the LDs is regulated by PLIN. We found that SCD1 inhibition did not affect PLIN2 protein levels, but reduced PLIN3 protein levels in HCT116 and HT29 cells. This effect may be related to the different cellular functions of these proteins. PLIN2 plays a role in attenuating lipolysis by regulating ATGL access to LDs, whereas PLIN3 plays a role in stabilizing stored TAG (Sztalryd & Brasaemle, 2017). Therefore, the unaltered PLIN2 protein content in SCD1-inhibited CRC cells ensures the possibility of efficient LDs lipolysis. Furthermore, the reduced PLIN3 protein content in CRC cells after SCD1 inhibition contributes to increased lipolysis by destabilizing LDs and results in a reduced number of LDs.
We also observed SCD1-dependent alterations of the cellular abundance of different classes of PLs, which are in very high demand in continuously dividing cancer cells (Cheng et al., 2016). Moreover, LDs are surrounded by a monolayer of PLs that are composed mainly of PC (Tauchi-Sato et al., 2002), levels of which were lower in both the studied cell lines after SCD1 inhibition. Interestingly, PS was the only one of the analyzed PLs whose content increased after A939572 treatment in CRC cells. As this was accompanied by a concomitant reduction in PC and PE content, increased activity of PS synthases-1 and -2 (PTDSS1 and PTDSS2), which convert PC and PE to PS (Kimura & Kimura, 2021), may be involved.
Considering the observed SCD1-dependent changes in FA and LD accumulation, we focused on SREBP-1, the main transcription factor that controls FA biosynthesis (Dorotea et al., 2020). We found that SCD1-dependent FA accumulation occurred independently of SREBP-1 activity, in which SCD1 depletion caused an ER stress-associated increase in the active form of SREBP-1 in CRC cells. These results are supported by previous findings that SCD1 inhibition disturbed cellular lipid homeostasis, which induces ER stress and the UPR (Leung & Kim, 2013). ER stress, in turn, activates S1P and S2P proteases, which process the precursor form of SREBP-1 to generate its transcriptionally active form (Kim et al., 2018; Ye et al., 2000).
Despite the observed increase in the active form of SREBP-1 and protein level of its downstream target, FAS, which catalyzes the production of long-chain FAs, we found that SCD1 inhibition or downregulation reduced the ability of CRC cells to synthesize and store new FAs. We propose that the de novo synthesis of FAs may be blocked upon SCD1 depletion by the inhibitory phosphorylation of ACC, the enzyme that catalyzes the irreversible carboxylation of acetyl-CoA to produce malonyl-CoA, the reaction that is considered the rate-limiting step of FA synthesis (Felix et al., 2021). As previously reported (Ono et al., 2017; Scaglia et al., 2009) and confirmed in the present study, SCD1 inhibition activates AMPK, which, in turn, phosphorylates ACC. The AMPK-mediated inhibitory phosphorylation of ACC suppresses lipogenesis and has been recognized as a hallmark of ongoing lipolysis (Garcia & Shaw, 2017). Evidence of the induction of lipolysis by SCD1 depletion in CRC cells was found in the present study at the level of the expression/activation of its effector proteins ATGL, HSL, MGL, and ATGL coactivator ABHD5 and by measuring the content of its by-product, glycerol, in the culture medium. However, we did not observe changes in protein levels of lipolytic factors when SCD1 was overexpressed in HCT116 cells. This may be attributable to the fact that SCD1 expression is already elevated in CRC (Ran et al., 2018), and further increases in SCD1 levels may not affect some cellular processes. Furthermore, SCD1 expression is markedly higher in HCT116 cells than in other CRC cell lines (Ran et al., 2018).
The induction of AMPK-dependent autophagy has been shown to evade the cytotoxic effects of SCD1 inhibition in HCT116 cells (Ono et al., 2017). Under conditions of nutrient or O2 deprivation, autophagy supports the mobilization of FAs from LDs in the process of lipophagy, assisted by CMA (Shin, 2020). In our experimental model, we found the occurrence of both lipophagy and CMA, together with lipolysis, by showing changes in the expression of their markers (LC3BII, LIPA, LAMP2, and PLIN3) and reversing, to some extent, the effect of SCD1 inhibition on TAG accumulation using the autophagy inhibitor CQ. However, given the relatively mild effect of CQ on TAG content, we propose that FA accumulation is mainly shaped by AMPK-dependent modifications of lipogenic and lipolytic pathways following SCD1 depletion in CRC cells. This was supported by our observation that the AMPK inhibitor compound C decreased ACC phosphorylation and significantly reduced the lipolytic breakdown of FAs, both induced previously by SCD1 inhibition in HT29 cells. Additionally, based on a previous study by Kim et al. (Kim et al., 2016), we hypothesize that AMPK may mediate the SCD1 inhibition-dependent decrease in TAG content by activating ATGL via phosphorylation. However, we propose that AMPK may also mediate SCD1-dependent changes in TAG biosynthesis, with a focus on its final step that is catalyzed by DGATs (Coleman & Mashek, 2011). Mouse adipocytes and other murine tissues that are deficient in both DGAT1 and DGAT2 enzymes, which convert DAG into TAG, are unable to accumulate TAG and LDs (Harris et al., 2011). The inhibition of DGAT2 impairs LD biosynthesis and sensitizes breast cancer cells to radiation (Nisticò et al., 2021). DGAT1 has been proposed as an oncoprotein that empowers cancer cells to accumulate FAs while evading lipotoxicity and whose expression is associated with a poor prognosis in cancers of various origins (Cheng et al., 2020). According to the present results, the administration of compound C restored mRNA levels of DGAT1, which were strongly reduced by SCD1 depletion in HT29 cells. In the case of DGAT2, we observed this effect only at the lower concentration of A939572. However, we conclude that AMPK activity negatively correlates with DGAT expression because it was also observed by Assifi et al. in the liver in starved/carbohydrate-refed rats (Assifi et al., 2005). Thus, the present results support the observations of Ono et al. that SCD1 knockout in HCT116 cells causes the AMPK-dependent attenuation of FA synthesis and induction of autophagy to provide an escape route from cytotoxic effects of SCD1 deficiency (Ono et al., 2017).
Alterations of glucose metabolism are among the most common metabolic changes that distinguish cancer cells from healthy cells (Zhang, 2012). Given the SCD1-dependent changes in lipid metabolism that were observed in the present study, we investigated whether SCD1 may also regulate the uptake and utilization of glucose, the main source of ATP and carbon for de novo FA synthesis in cancer cells (Zhang, 2012). We observed a decrease in the uptake of glucose upon SCD1 deficiency in HCT116 and HT29 cells, which correlated with a decrease in the expression of GLUT4 and GLUT12 in HCT116 cells that were treated with the SCD1 inhibitor or transfected with an siRNA that targeted SCD1. GLUT1 mRNA levels decreased after silencing SCD1 expression but increased upon A939572 treatment. We assume that the contribution of this transporter to glucose uptake may not be significant in HCT116 cells. The choice of the above GLUTs in the present study was based on their specific involvement in alterations of glucose uptake in cancer cells (Ancey et al., 2018; Barron et al., 2016). Changes in extracellular acidification that were observed in HCT116 cells after treatment with the SCD1 inhibitor indicate that SCD1 may also be implicated in regulation of the glycolytic breakdown of glucose in CRC cells. However, the involvement of AKT signaling in SCD1-dependent alterations of glucose uptake and metabolism that were observed in the present study is unclear because we did not observe changes in AKT phosphorylation in HCT116 cells after SCD1 inhibition. Additionally, the contribution of SCD1 to glucose metabolism in cancer cells appears to stand in opposition to its role in this process in healthy tissues. For example, SCD1 knockout causes hypoglycemia and increases in both basal and insulin-mediated glucose uptake and utilization by skeletal muscles and white adipose tissue in mice (ALJohani et al., 2017).
In summary, we demonstrated that SCD1 activity contributes to the regulation of most key pathways of the cancer cell-specific metabolic program, including lipid biosynthesis and storage, PL synthesis, and glucose uptake and utilization, in CRC cells (Figure 8). Our findings provide further evidence of the importance of SCD1 in the regulation of cellular processes that promote cancer development and progression and upholds the validity of considering SCD1 as a suitable target for anticancer therapy.
AUTHOR CONTRIBUTIONS
Conceptualization: Zuzanna Tracz-Gaszewska and Pawel Dobrzyn. Investigation: Zuzanna Tracz-Gaszewska and Adrian Sowka. Data curation: Zuzanna Tracz-Gaszewska and Pawel Dobrzyn. Writing—original draft preparation: Zuzanna Tracz-Gaszewska and Pawel Dobrzyn. Writing—review and editing: Zuzanna Tracz-Gaszewska and Pawel Dobrzyn. Visualization: Zuzanna Tracz-Gaszewska and Pawel Dobrzyn. Supervision: Zuzanna Tracz-Gaszewska and Pawel Dobrzyn. Project administration: Pawel Dobrzyn. Funding acquisition: Pawel Dobrzyn. All authors have read and agreed to the published version of the manuscript.
ACKNOWLEDGMENTS
This research was funded by grant no. UMO-2016/22/E/NZ4/00650 (P.D) from the National Science Center, Poland.
CONFLICT OF INTEREST STATEMENT
The authors declare no conflict of interest.


